
The gold dollar relationship is one of the most reliable patterns in commodity trading: when the U.S. dollar weakens, gold typically rises, and when the dollar strengthens, gold tends to fall. You've probably seen this play out on your own screens. The dollar takes a hit after an inflation report, and gold futures spike within minutes. We'll walk you through exactly how this correlation works, how to read dollar signals to time your gold entries, when the correlation breaks down, and how to manage your risk through all of it.
What's the Relationship Between Gold and the Dollar?
Bottom Line: The gold-dollar inverse correlation is a useful and historically consistent pattern, but it requires active interpretation rather than passive assumption. Traders who combine DXY analysis with an awareness of when the correlation breaks down, and who size positions appropriately using tools like micro gold contracts, are better positioned to use this relationship as a repeatable edge rather than a shortcut.
The relationship between gold and the dollar is primarily an inverse correlation. Because gold is priced in U.S. dollars globally, a weaker dollar makes gold cheaper for foreign buyers, which drives up demand and price. A stronger dollar makes gold more expensive for international markets, which generally suppresses demand and pushes prices lower.
Understanding this dynamic is essential for any commodity trader. When you pull up a gold and USD correlation chart, the opposing price action becomes immediately apparent. If the dollar trends upward over a three-month period, gold typically experiences a corresponding downtrend.
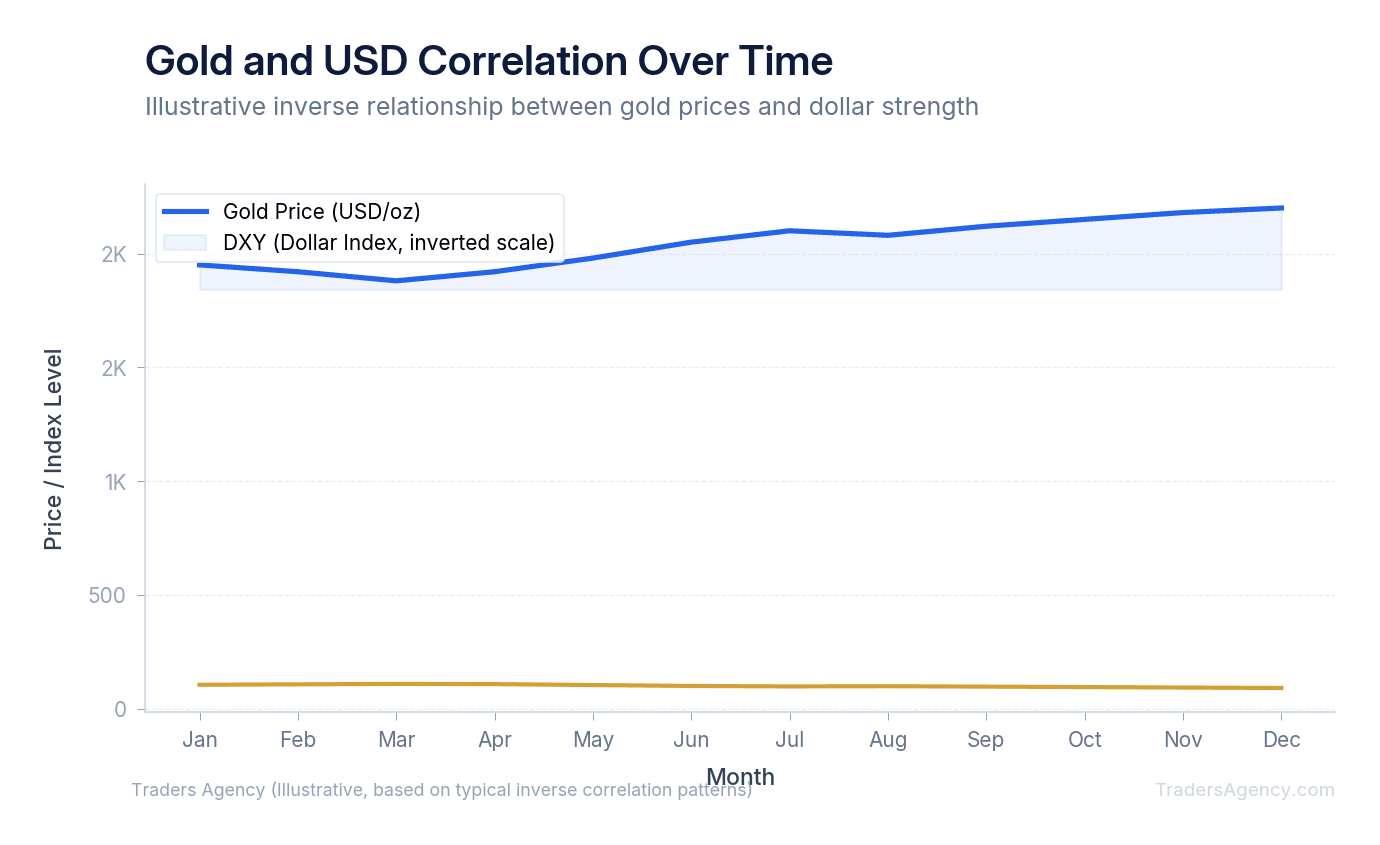
We teach our members to view the dollar as the primary headwind or tailwind for precious metals. You cannot effectively trade gold without keeping one eye on the currency markets. The U.S. dollar and gold relationship forms the foundation of most professional precious metals trading strategies.
Key Concept: Gold and the U.S. dollar compete as global reserve assets. When the dollar weakens, gold becomes cheaper for foreign buyers, increasing demand and pushing prices higher. When the dollar strengthens, the opposite occurs.
Why Do Gold and USD Have an Inverse Relationship?
Gold and the USD move inversely because they compete for the same role in global portfolios: a store of value. When investors lose confidence in fiat currencies due to inflation or falling interest rates, they move capital into hard assets like gold. When the dollar offers higher returns through rising yields, capital flows back into cash.
Think of this dynamic like a seesaw. Capital constantly flows between yield-bearing assets (like cash in a high-interest environment) and non-yielding safe havens (like gold). Because gold pays no dividend and yields no interest, it struggles to compete when cash offers a high, risk-free return.
Institutional traders constantly adjust their portfolios based on real interest rates. When inflation outpaces the interest paid on the dollar, the real yield turns negative. That is the exact environment where gold thrives. You can track these dynamics through the Federal Reserve's published rate decisions and economic projections.
How Do You Read the DXY as a Gold Trading Signal?
To track the dollar, we use the U.S. Dollar Index (DXY). The DXY measures the value of the dollar against a basket of six major foreign currencies. Our team prefers to use the DXY as a leading indicator for gold entries and exits.
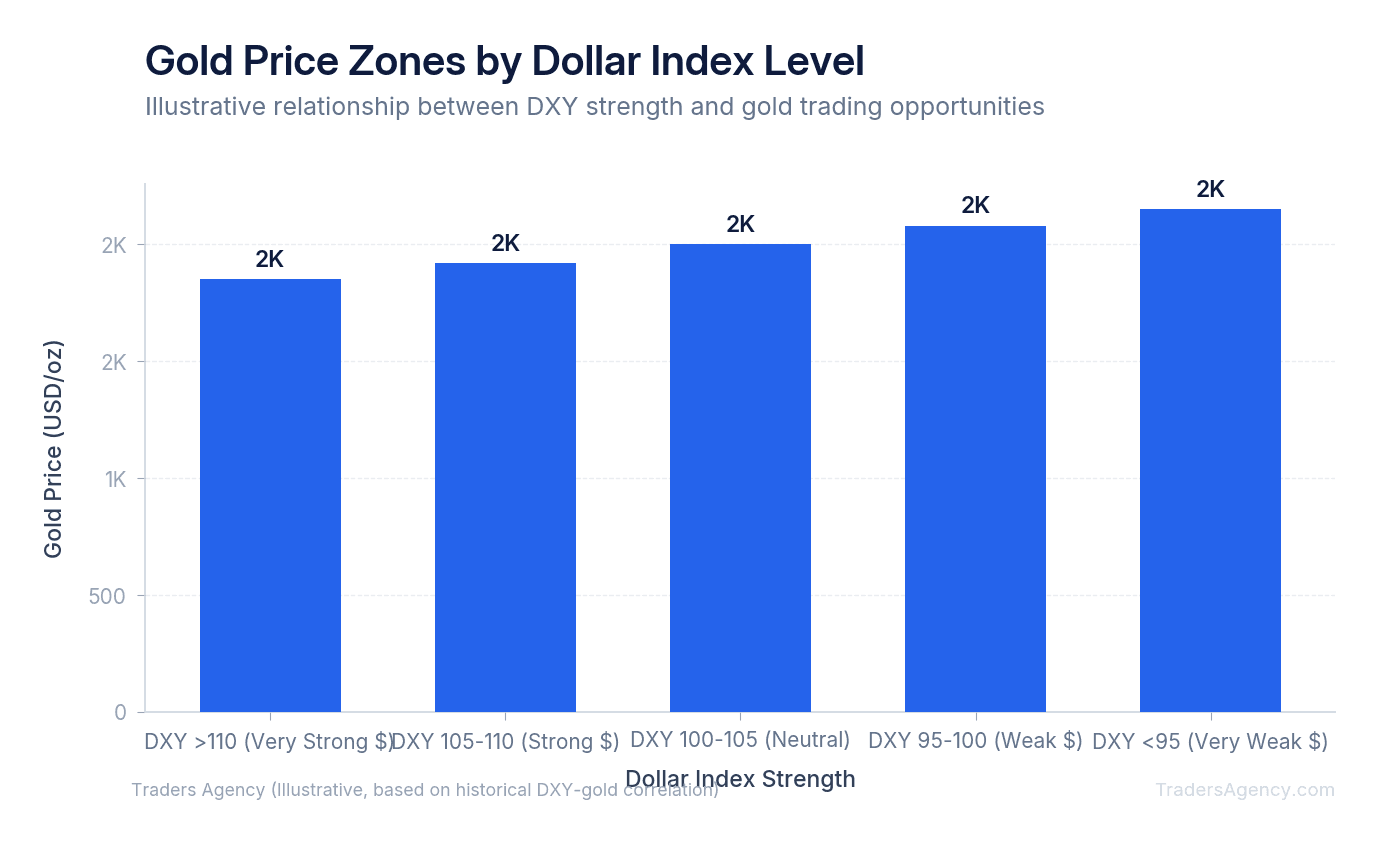
Here's how we teach our members to execute a trade based on this signal:
- Identify the DXY Setup: Open a daily chart of the DXY. You're looking for technical exhaustion. For example, say the DXY has rallied for three weeks and is now hitting heavy resistance at the 105.50 level. The momentum indicators show the dollar is overbought. We anticipate a pullback in the dollar.
- Confirm the Gold Setup: Switch to a gold chart. You can use GC (Gold Futures) or GLD (SPDR Gold Shares ETF). If the DXY is at resistance, gold should be sitting at support. We want to see gold holding a major support level, such as $2,000 per ounce for futures or $185 for the GLD ETF.
- Execute the Trade: Once the DXY begins to reject its resistance level, we enter the gold trade. See the trade parameters in the table below.
- Manage the Risk: We set our stop loss based on the DXY, not just the gold price. If the DXY breaks above 105.50 and closes higher, our thesis is wrong. We exit the GLD call option immediately to preserve capital, even if it means taking a partial loss on the premium.
| Parameter | Value |
|---|---|
| Asset | Buy the GLD $185 strike call option |
| Expiration | 45 days out |
| Premium | $3.50 per contract (Total cost: $350) |
| Breakeven | $188.50 at expiration |
| Max Loss | $350 (the premium paid) |
| Max Gain | Theoretically unlimited |
Watch Out: Always set your stop loss based on the DXY level, not just the gold chart. If the dollar breaks through resistance and closes higher, your inverse-correlation thesis is invalidated. Exit immediately to preserve capital.
Want expert trading insights delivered daily?
Join thousands of traders who rely on Traders Agency for market analysis and trade ideas.
Join Traders AgencyWhen Does the Gold-Dollar Relationship Break Down?
The gold-dollar relationship breaks down during periods of extreme geopolitical stress or massive central bank intervention. In these scenarios, both gold and the dollar can rise simultaneously as investors seek multiple safe havens, temporarily overriding the traditional inverse correlation.
Many new traders ask: does a weak dollar always mean strong gold? The answer is no. There are specific market regimes where the rules change entirely.
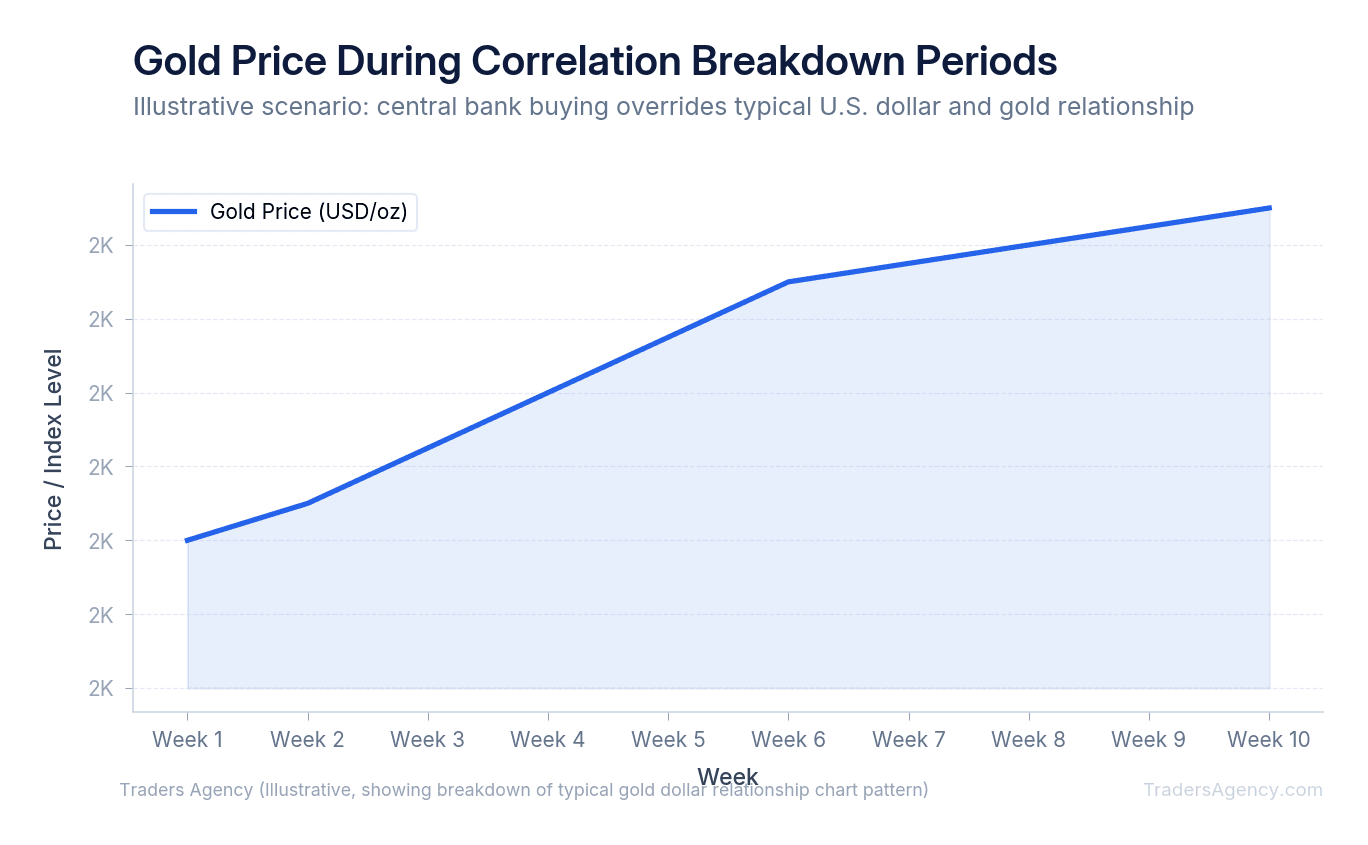
If a global crisis occurs, foreign investors will buy U.S. dollars for liquidity and safety. At the exact same time, other institutions will buy gold to protect against systemic risk. When you see both the DXY and gold rising together for more than a few days, it's a clear signal that fear is driving the market, not standard currency mechanics.
During these periods, we recommend reducing your position sizes. The standard correlation models will fail, and technical levels become much less reliable.
How Does Central Bank Gold Buying Affect the Gold-Dollar Correlation?
Another factor that disrupts the standard correlation is aggressive purchasing by central banks. When foreign nations decide to diversify their reserves away from the U.S. dollar, they buy physical gold in massive quantities.
This creates a structural floor under the price of gold. Even if the DXY is strong, gold might refuse to drop because sovereign nations are absorbing all the available supply. We saw this exact scenario play out heavily in recent years. The dollar remained strong due to high interest rates, but gold held its value because central banks were buying record amounts of bullion.
If you're wondering why the gold-dollar inverse relationship sometimes breaks down, central bank activity is usually the primary culprit. You need to track institutional demand, not just currency charts. The CME Group provides useful data on gold futures positioning that can help you gauge institutional flows.
Key Concept: When central banks buy gold in large quantities to diversify away from dollar reserves, they create a price floor that can override the normal inverse correlation. Always monitor sovereign demand alongside your DXY analysis.
How Does Gold Fit Into a Broader Portfolio?
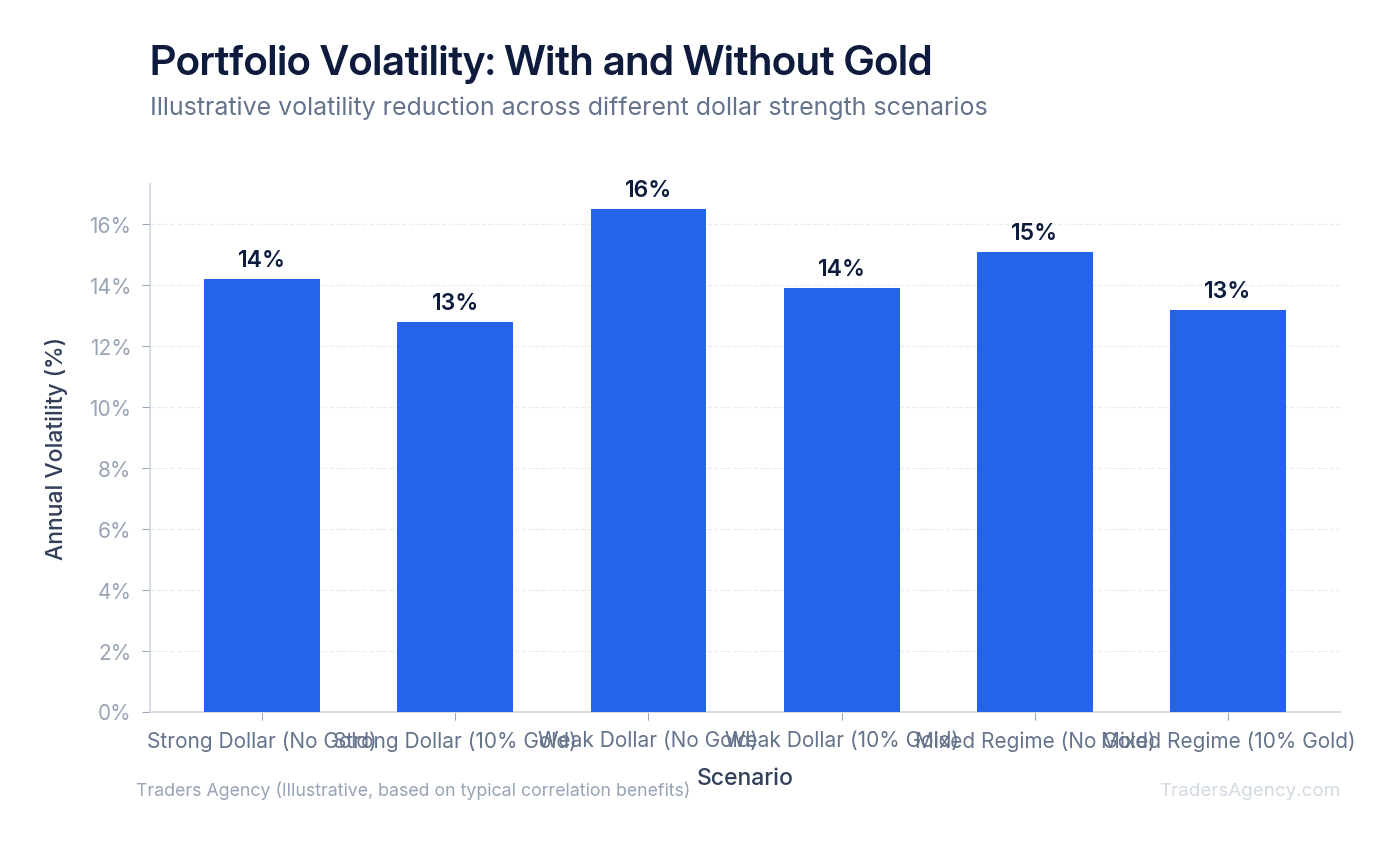
Understanding the relationship between gold and the dollar helps you balance your overall equity exposure. Most traditional portfolios are heavily weighted in U.S. stocks. Because U.S. stocks are priced in dollars, holding gold provides a natural hedge against dollar depreciation.
When we design portfolio allocations, we use a gold-dollar correlation chart to determine our optimal exposure.
Here are the primary vehicles we use to gain gold exposure:
- Physical Gold: Coins or bars. Best for long-term wealth preservation, but carries high storage costs and wide dealer markups.
- Gold ETFs (GLD, IAU): The easiest way for retail traders to get exposure. Highly liquid and easy to trade in standard brokerage accounts.
- Gold Futures (GC): Best for active, experienced traders. Offers high leverage and trades nearly 24 hours a day, allowing you to react instantly to global currency fluctuations.
Our team generally recommends keeping gold exposure to between 5% and 10% of a total portfolio. This is enough to provide a hedge against dollar weakness without dragging down overall returns during strong bull markets.
Common Trading Mistakes to Avoid
Even with a solid understanding of the gold-dollar relationship, traders frequently make execution errors. Here are the most common mistakes we see, and how you can avoid them.
Ignoring Real Interest Rates
Traders often watch the DXY but ignore the bond market. If the dollar is falling but Treasury yields are spiking, gold might still struggle. You need to look at the complete picture. The U.S. Federal Reserve's interest rate decisions dictate both dollar strength and gold demand.
Trading Without a Stop Loss
Because gold is a global commodity, it's subject to sudden price shocks from international news. A geopolitical event can cause a $50 spike or drop in minutes. Never enter a futures or ETF trade without a hard stop loss resting in the market.
Overleveraging Futures Contracts
Gold futures (GC) control 100 troy ounces per contract. A simple $10 move in the price of gold equals a $1,000 swing in your account balance. Many intermediate traders take on too many contracts, assuming the dollar correlation will protect them. We prefer to use micro gold contracts (MGC), which are one-tenth the size, allowing for much safer position sizing.
Watch Out: A single standard gold futures contract (GC) means a $10 price move creates a $1,000 account swing. If you're still building your risk management skills, start with micro gold contracts (MGC) at one-tenth the exposure.
By tracking the DXY, respecting the macroeconomic environment, and managing your risk strictly, you can turn this historical correlation into a reliable part of your trading routine.
Want expert trading insights delivered daily?
Join thousands of traders who rely on Traders Agency for market analysis and trade ideas.
Join Traders AgencyKey Takeaways
- Gold is priced in U.S. dollars globally, so a weaker dollar makes gold cheaper for foreign buyers and drives demand up, while a stronger dollar suppresses international demand and pushes prices lower.
- The DXY (U.S. Dollar Index) is the primary signal to watch: a sustained uptrend in the DXY typically corresponds to a downtrend in gold over the same period.
- The gold-dollar inverse correlation is not guaranteed. Central bank gold buying is one documented factor that can override the typical pattern.
- A single standard gold futures contract (GC) means a $10 price move creates a $1,000 account swing. Traders still developing risk management skills should use micro gold contracts (MGC), which carry one-tenth the exposure.
- Tracking the DXY, respecting the broader macroeconomic environment, and applying strict position sizing are the three core habits the article identifies for trading this correlation reliably.
DISCLAIMER: Traders Agency does not offer financial advice. The information provided is for educational purposes only and should not be considered financial advice. Traders Agency is not responsible for any financial losses or consequences resulting from the use of the information provided. Trading carries inherent risks and may not be suitable for all individuals. You are advised to conduct your own research and seek personalized advice before making any investment decisions, recognizing the potential risks and rewards involved.
See more from Traders Agency on Google
Make us a preferred source and our market analysis will appear more prominently in your Google Search, Top Stories, and AI results.
Add to Preferred Sources