
The head and shoulders pattern is a technical reversal formation that signals a prior trend is losing strength and preparing to change direction. You've probably watched a strong uptrend suddenly lose momentum, chop around for a few weeks, and then collapse. Predicting exactly when that reversal happens is difficult, but specific chart formations can give you a massive edge. We're going to walk you through exactly how to identify this setup on your charts, where to place your entries, how to calculate your profit targets, and where to set your stop losses to protect your capital.
Our team relies on this specific formation to spot exhaustion in the market before the crowd realizes the trend is over. Reversal trading carries risk, but applying a structured methodology helps manage that exposure. By the end of this guide, you'll know the exact head and shoulders pattern rules we teach our members.
What Is the Head and Shoulders Pattern?
Bottom Line: The head and shoulders pattern gives traders a structured, rules-based way to identify trend exhaustion before the broader market catches on. The edge comes from combining accurate pattern recognition with disciplined entry timing, a defined profit target, and a stop loss placed to survive normal price noise. Master the neckline break as your trigger, and this formation becomes one of the more dependable setups in a reversal trader's toolkit.
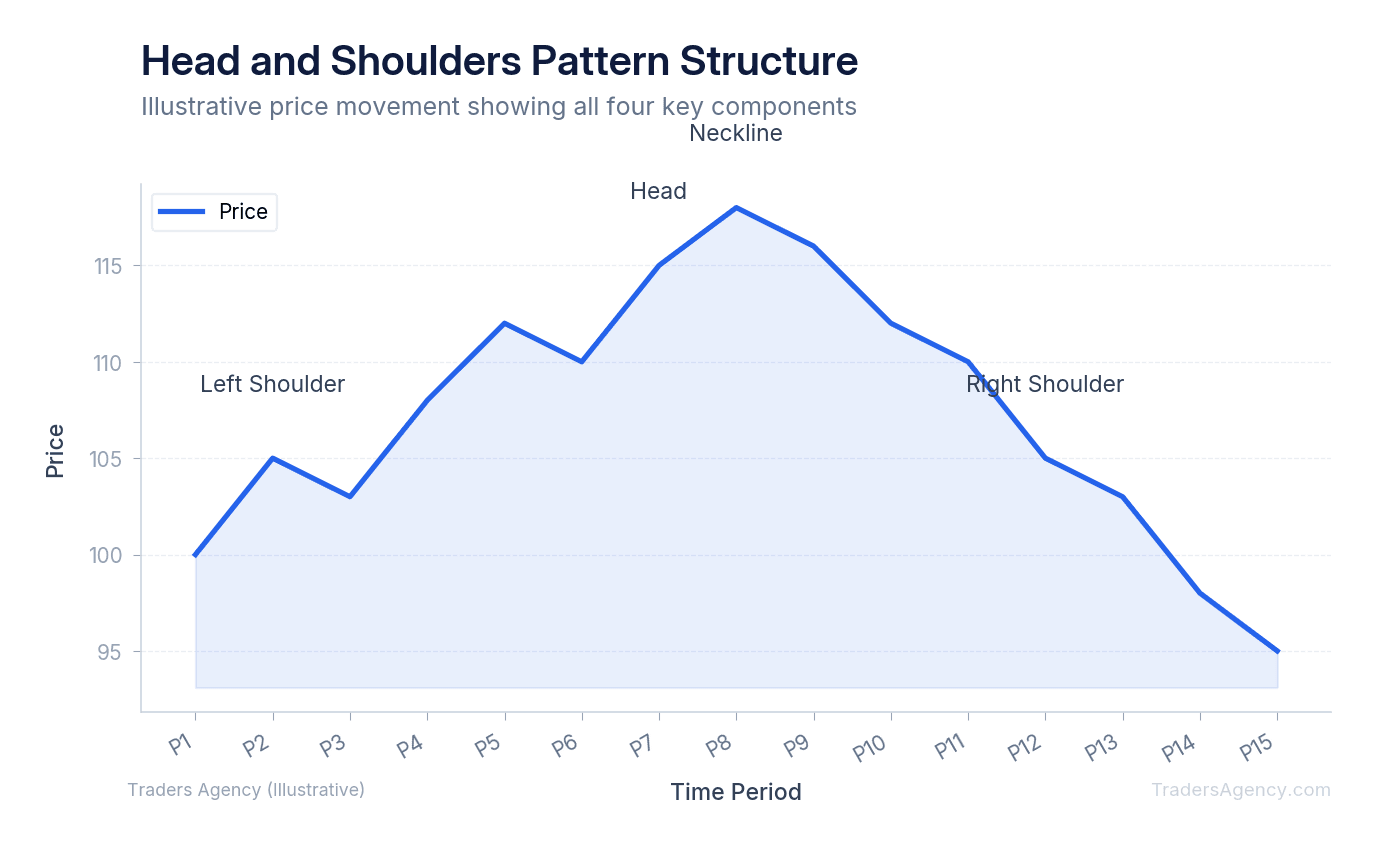
The head and shoulders pattern is a bearish technical reversal setup consisting of three consecutive price peaks. The middle peak is the highest, flanked by two lower peaks of roughly equal height. A support line called the neckline connects the bottoms between these peaks. A break below this line triggers a sell signal.
This formation works because it visually maps out a shift in supply and demand. Buyers push the price to a new high during the middle peak, but they lack the conviction to keep it there. When the price rallies a third time but fails to reach the previous high, it shows sellers are taking control. The psychology shifts from greed to fear.
Think of it like a runner trying to sprint up a steep hill. The first sprint is strong. The second sprint pushes a bit further but exhausts the runner completely. The third attempt is weak and falls short, signaling it's time to turn around and walk back down. This formation is widely recognized across the industry as a reliable indicator of trend exhaustion, and it's one of the setups we come back to again and again in our technical analysis education.
Key Concept: The head and shoulders pattern maps the exact moment when buyers lose control and sellers take over. Three peaks form: the middle one is the highest (the head), and the two flanking peaks (the shoulders) are lower. A break below the neckline confirms the reversal.
What Are the Key Components of the Head and Shoulders Pattern?
To trade this setup effectively, you must identify four distinct parts on your chart. Missing even one of these components means the pattern is invalid. We train our traders to look for specific price action in each phase.
- Left Shoulder: The price rises to a peak on strong volume, driven by market optimism. It then pulls back to establish a short-term support level as early buyers take profits.
- Head: Buyers step back in and push the price to a higher high, exceeding the left shoulder. Euphoria peaks here. The price then falls back down to the previous support area, trapping late buyers.
- Right Shoulder: The price rallies one last time but forms a lower high. This is the first clear sign that upward momentum is dying. Buyers are exhausted.
- Neckline: This is the horizontal or slightly angled trendline connecting the swing lows between the three peaks. It acts as the trigger line for the entire trade.
What Is the Success Rate of the Head and Shoulders Pattern?
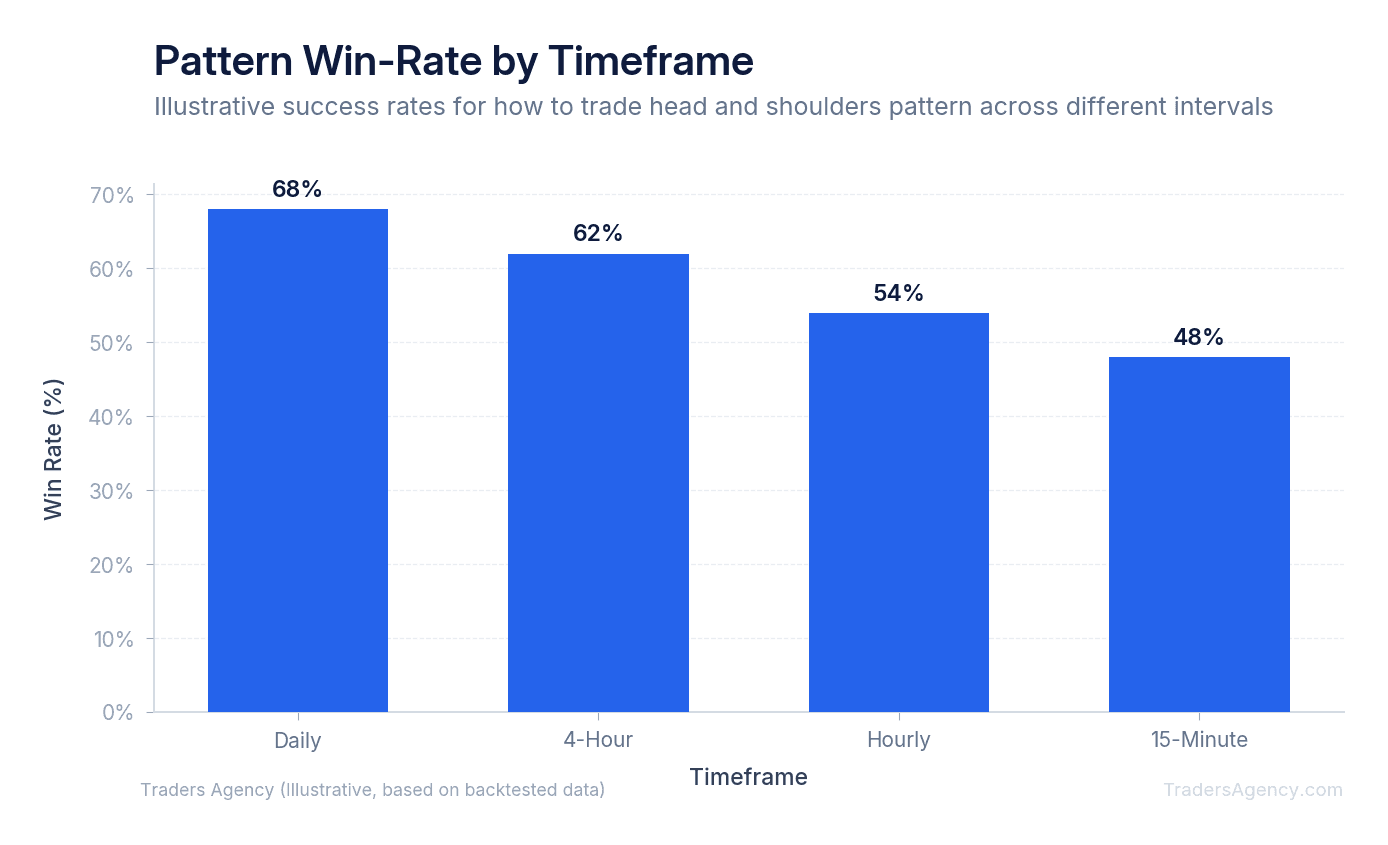
The success rate of the head and shoulders pattern typically ranges between 65% and 71% when traded on daily or weekly charts. The reliability drops significantly on shorter timeframes like five-minute charts, where market noise frequently causes false breakouts and failed patterns.
We prefer to look for this setup on the daily or 4-hour charts. The timeframe you choose dictates your holding period and risk parameters. A pattern that takes three months to form on a daily chart carries much more weight than one that forms over three hours. Institutional money moves slowly, and higher timeframes reflect those massive capital shifts.
When looking at head and shoulders pattern forex charts, you might see slightly angled necklines due to the continuous 24-hour trading cycle. An upward-sloping neckline often yields a lower success rate than a flat or downward-sloping one. Downward-sloping necklines indicate that sellers are already pressing the price lower before the pattern even completes.
Is a Head and Shoulders Pattern Bullish?
A standard head and shoulders pattern is strictly bearish, signaling a shift from an uptrend to a downtrend. However, its upside-down counterpart, the inverse head and shoulders pattern, is a highly reliable bullish reversal signal that forms at the bottom of a downtrend.
The mechanics are identical, just flipped. You'll see a low (left shoulder), a lower low (head), and a higher low (right shoulder). The neckline connects the rally peaks between these drops. When the price breaks above the neckline, it triggers a long entry. This shows that sellers have finally exhausted their supply, and buyers are stepping in at higher prices.
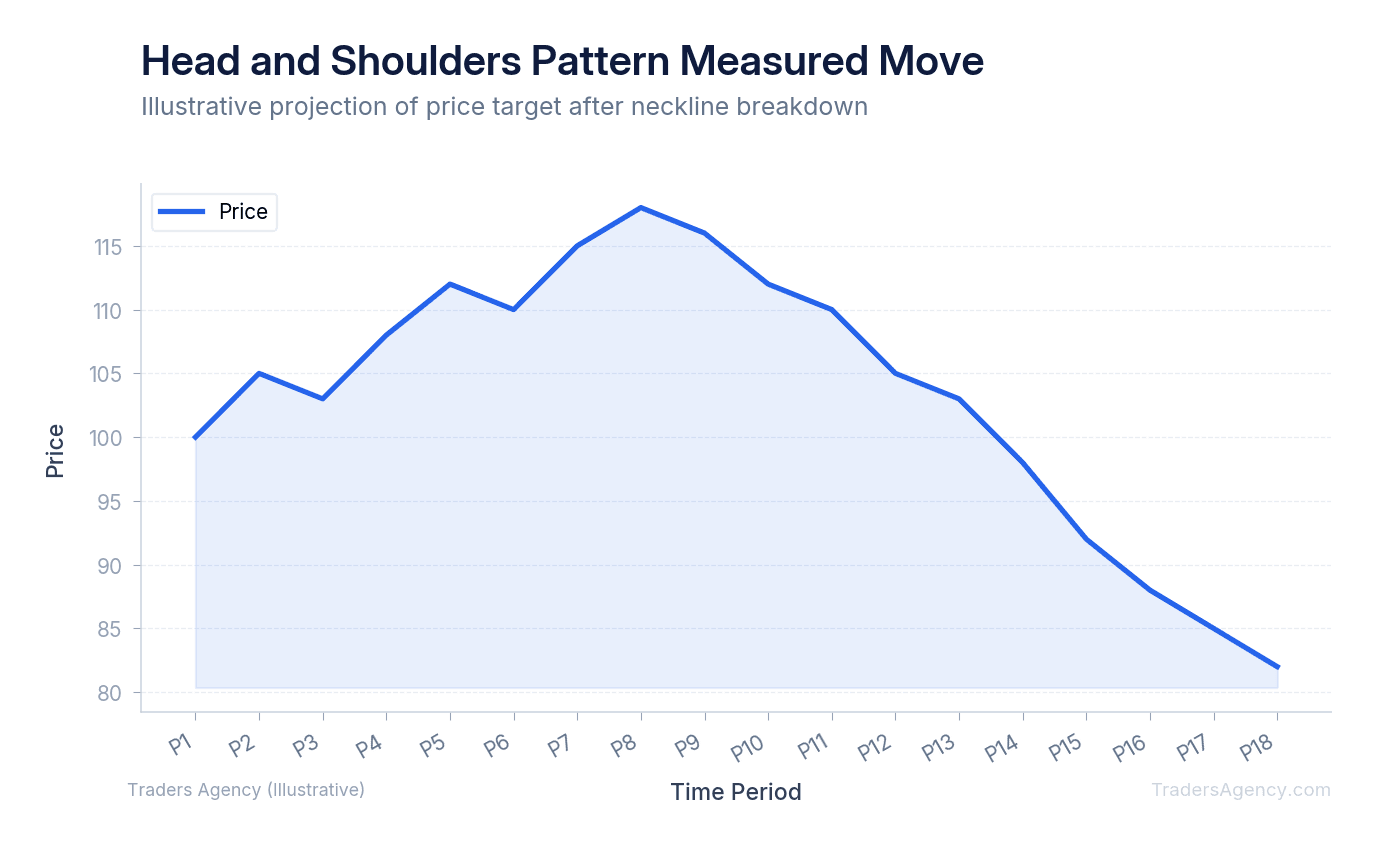
Whether you're trading the bearish or bullish version, the target calculation remains the same. You measure the vertical distance from the tip of the head to the neckline. You then project that exact distance from the breakout point to find your primary profit target.
Want expert trading insights delivered daily?
Join thousands of traders who rely on Traders Agency for market analysis and trade ideas.
Join Traders AgencyHow Do You Trade the Head and Shoulders Pattern?
Learning how to trade head and shoulders pattern setups requires strict discipline and patience. We teach our members to wait for a confirmed daily close below the neckline before entering a short position. Anticipating the break early is a fast way to lose money.
Here's one of our favorite head and shoulders pattern examples using a hypothetical stock, XYZ Corp. We'll walk through the exact mechanics of the trade from setup to exit.
- Identify the Setup: Assume XYZ Corp has been in a strong uptrend for six months. The price peaks at $140 (Left Shoulder) and pulls back to $130. It then rallies to $150 (Head) before dropping back to $132. Finally, it rallies to $142 (Right Shoulder) and falls back to $131. You now have a clear neckline connecting the lows around the $130 to $132 zone. The lower high on the right shoulder confirms the buyers are losing strength.
- Execute the Entry: You wait for XYZ Corp to break below the neckline. On Tuesday, the stock closes at $128 on heavy volume. This confirmed break is your trigger. You enter a short position at $128. If you trade options, you might buy a put option instead of shorting the stock directly. For a stock at $128, you could buy a $125 strike put expiring in 45 days. If the premium is $3.50, your maximum loss on the options trade is the $350 paid per contract. We prefer options with a Delta of at least -0.40 for these directional plays.
- Set the Target and Stop Loss: To find your profit target, measure the distance from the head ($150) to the neckline ($131). That's a $19 difference. Subtract $19 from the breakout point ($128) to get a measured move target of $109. Place your stop loss just above the right shoulder. In this case, if the price reclaims $143, the pattern is invalidated. This gives you a clear, mathematical risk-to-reward ratio before you ever place the trade. If the distance to your stop loss is larger than the distance to your profit target, we recommend skipping the trade entirely.
| Parameter | Value |
|---|---|
| Stock | XYZ Corp |
| Left Shoulder | $140 |
| Head | $150 |
| Right Shoulder | $142 |
| Neckline Zone | $130 - $132 |
| Entry (Short) | $128 (confirmed neckline break) |
| Stop Loss | $143 (above right shoulder) |
| Measured Move Target | $109 ($150 - $131 = $19; $128 - $19 = $109) |
| Options Alternative | $125 strike put, 45 DTE, $3.50 premium, Delta -0.40+ |
Combining the Pattern With Other Indicators for Higher Conviction
Trading a chart pattern in isolation is risky. We prefer to combine the head and shoulders formation with volume analysis and momentum oscillators to filter out bad trades. Confirming trends with multiple data points is a core principle of our approach, and it's a best practice emphasized by the SEC's investor education resources.
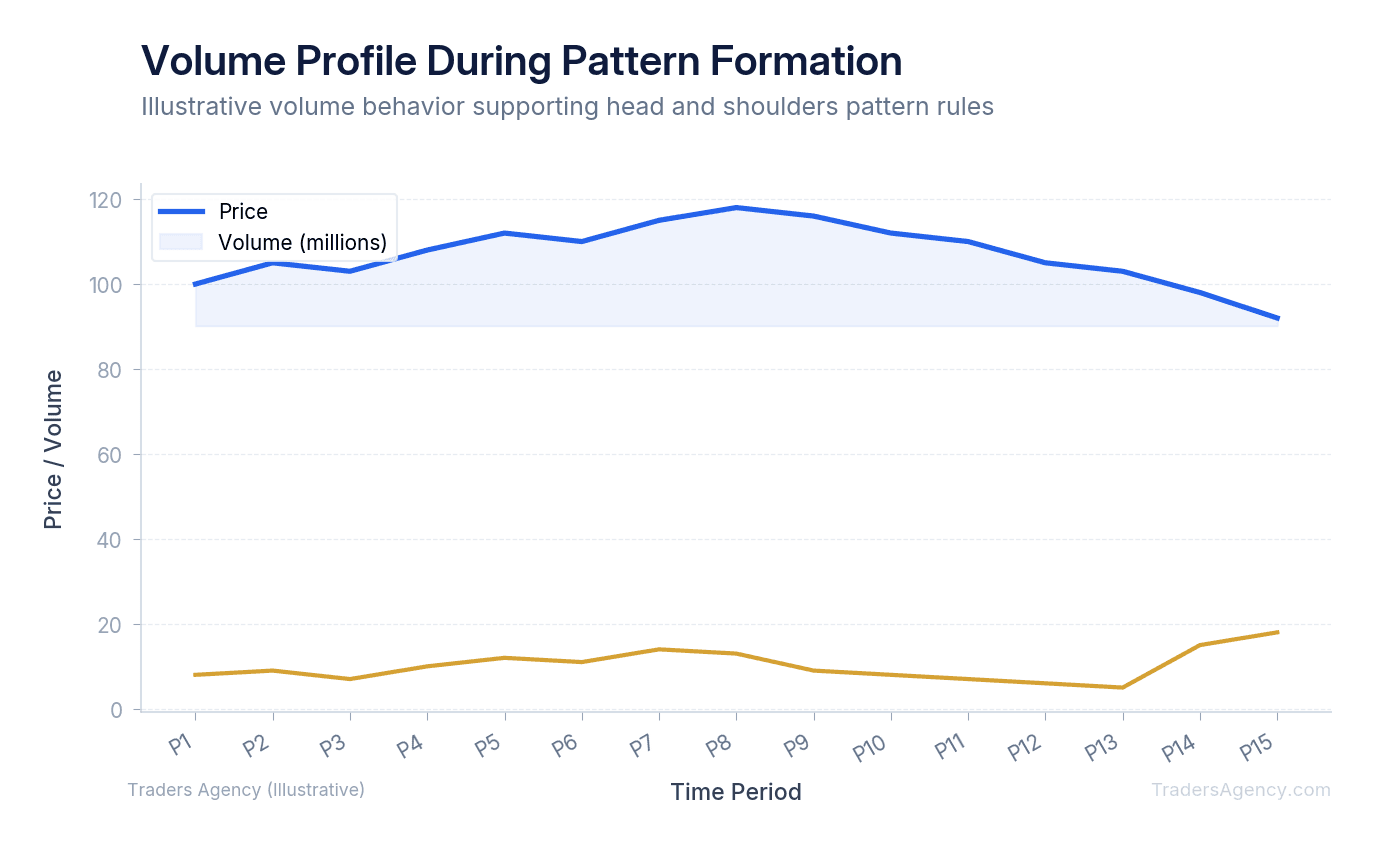
Volume is your best confirmation tool. During a valid head and shoulders setup, volume should be heaviest on the left shoulder, lighter on the head, and lightest on the right shoulder. This declining volume profile proves that buying interest is fading. When the price finally breaks the neckline, you want to see a massive spike in selling volume.
If the neckline breaks on low volume, we usually skip the trade. Low volume indicates a lack of institutional selling pressure. This makes a false breakdown highly likely.
We also check the Relative Strength Index (RSI). We look for bearish divergence between the left shoulder and the head. If the price makes a higher high at the head, but the RSI makes a lower high, it confirms that the upward momentum is internally weak. Combining RSI divergence with a confirmed neckline break provides a high-probability entry signal.
Key Concept: The strongest head and shoulders setups show three confirming signals at once: a completed pattern with a lower right shoulder, declining volume across the three peaks, and bearish RSI divergence between the left shoulder and the head. When all three align, you have a high-conviction trade.
What Are the Most Common Mistakes When Trading This Pattern?
The most common mistake traders make is jumping the gun. They see the right shoulder forming and short the stock before the neckline actually breaks. This is dangerous because the price can easily bounce off the neckline and continue its uptrend. You must wait for the structural support to fail.
Another frequent challenge is the "neckline retest." Often, a stock will break the neckline, drop slightly, and then rally back up to touch the neckline from below. This retest shakes out nervous traders. We teach our members to hold their short positions during a retest as long as the price does not close back above the neckline. The old support line should now act as firm resistance.
You must also know how to handle a failed pattern. A failed head and shoulders occurs when the price breaks the neckline, traps short sellers, and immediately reverses back above the right shoulder. When this happens, the resulting short squeeze can be violent.
Watch Out: A failed head and shoulders pattern can trigger an aggressive short squeeze. If the price reclaims the right shoulder after breaking the neckline, exit immediately. The resulting rally can be sharp and punishing for anyone still holding a short position.
To protect your account, follow these risk management rules:
- Never risk more than 1% to 2% of your total account equity on a single pattern trade.
- Always place a hard stop loss above the right shoulder peak.
- Do not force the pattern. If the shoulders are wildly disproportionate or the neckline is too steep, look for a different setup.
- Avoid trading this pattern directly ahead of major earnings announcements, as fundamental news can destroy technical setups instantly.
We recommend practicing this strategy on a paper trading account first. Scan your daily charts, draw your necklines, and track the outcomes before committing real capital. Once you train your eyes to spot the head and shoulders pattern rules accurately, it becomes one of the most reliable tools in your trading arsenal.
Our education team publishes new strategy guides and market analysis every week. If you found this breakdown helpful, consider joining our community for ongoing training and live trade setups.
Want expert trading insights delivered daily?
Join thousands of traders who rely on Traders Agency for market analysis and trade ideas.
Join Traders AgencyKey Takeaways
- The head and shoulders pattern consists of three price peaks where the middle peak is the highest, flanked by two lower peaks of roughly equal height, forming a reliable bearish reversal signal.
- The neckline connects the two troughs between the peaks, and a confirmed close below it is the actual sell trigger, not just a brief intraday dip.
- The pattern signals exhaustion because buyers fail to push price to a new high on the third rally, revealing a shift in supply and demand before most traders recognize the trend has changed.
- Avoid trading this setup directly ahead of major earnings announcements, since fundamental news can invalidate the technical structure instantly.
- Practicing on a paper trading account first, by scanning daily charts and tracking neckline breaks, is the recommended path before committing real capital to this strategy.
DISCLAIMER: Traders Agency does not offer financial advice. The information provided is for educational purposes only and should not be considered financial advice. Traders Agency is not responsible for any financial losses or consequences resulting from the use of the information provided. Trading carries inherent risks and may not be suitable for all individuals. You are advised to conduct your own research and seek personalized advice before making any investment decisions, recognizing the potential risks and rewards involved.
See more from Traders Agency on Google
Make us a preferred source and our market analysis will appear more prominently in your Google Search, Top Stories, and AI results.
Add to Preferred Sources