
You've probably watched a stock trade in a tight, boring range for weeks, only to suddenly explode higher or lower. Many traders get frustrated by these sideways markets and look away just before the big move happens. We're going to walk you through the Bollinger Band squeeze strategy so you can spot these setups before the expansion begins and position yourself on the right side of the trade.
Our team teaches traders how to identify periods of low volatility and use them to predict upcoming momentum. By the end of this guide, you'll know exactly how to read these signals on your charts. You'll learn how to enter breakouts, fade false moves, and manage your risk effectively.
What Is a Bollinger Band Squeeze?
Bottom Line: The Bollinger Band squeeze strategy is built on one core idea: low volatility precedes high volatility, and the bands measure that transition in real time. Traders who wait for volume confirmation and follow strict stop loss rules can separate genuine breakouts from head fakes. The edge comes from patience during the contraction phase, not from reacting quickly once the move has already started.
A Bollinger Band squeeze is a technical analysis pattern that occurs when a financial instrument experiences a period of historically low volatility. During this time, the upper and lower bands contract tightly around the moving average. This contraction signals that a significant price breakout is likely approaching.
To understand the Bollinger Band squeeze meaning, you need to understand how the bands are calculated. The indicator consists of a 20-period simple moving average in the middle, flanked by an upper and lower band. These outer bands are typically set two standard deviations away from the moving average.
When the market gets quiet, standard deviation drops. This causes the outer bands to pinch inward toward the moving average.
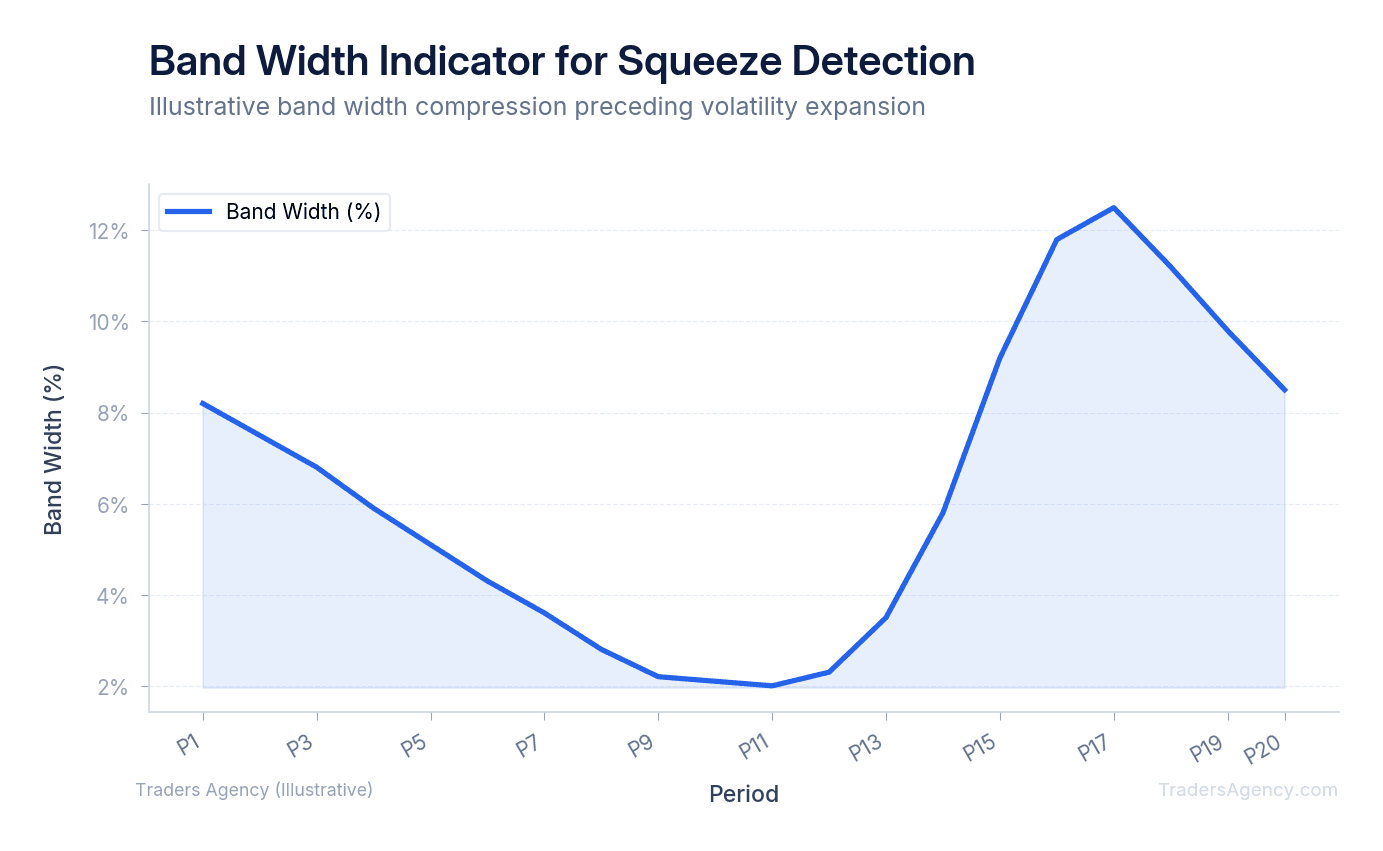
Think of this contraction like shaking a closed bottle of soda. The pressure builds quietly beneath the surface. When the bands finally expand, it's like taking the cap off the bottle. The resulting price movement is often fast and aggressive.
Key Concept: A Bollinger Band squeeze occurs when the upper and lower bands contract to their narrowest point relative to recent history. This compression of volatility signals that a powerful directional move is building beneath the surface.
How Does the Bollinger Band Squeeze Breakout Strategy Work?
The Bollinger Band squeeze breakout strategy works by identifying periods of low volatility and entering a trade when the price closes outside the contracted bands. We buy when price breaks the upper band or short when it breaks the lower band. The goal is to capture the momentum that follows a period of compression.
Financial markets constantly cycle between periods of high volatility and low volatility. Options traders at exchanges like the CBOE track these volatility cycles closely to price upcoming moves. When volatility is low, options premiums are cheap, making it an ideal time to position for a breakout.
We teach our members to wait for the market to show its hand. You should never guess which way the squeeze will resolve. Instead, you wait for a confirmed candlestick close outside the bands.
Here's a practical example: if a stock has been trading between $100.00 and $102.00 for three weeks, the bands will be very tight. If the price suddenly closes at $103.50 on heavy volume, the bands will begin to widen apart. This expansion confirms the breakout is underway.
What Is the Difference Between a Bollinger Band Squeeze and a Keltner Channel Squeeze?
The main difference is how they measure volatility. Bollinger Bands use standard deviation, which expands and contracts rapidly. Keltner Channels use Average True Range, creating smoother bands. A true squeeze signal occurs when the Bollinger Bands contract entirely inside the Keltner Channels.
Many charting platforms combine these two indicators to create a more reliable signal. This combination is known as the Bollinger Band squeeze Keltner setup. Using both indicators helps filter out weak signals and highlights only the most extreme periods of low volatility.
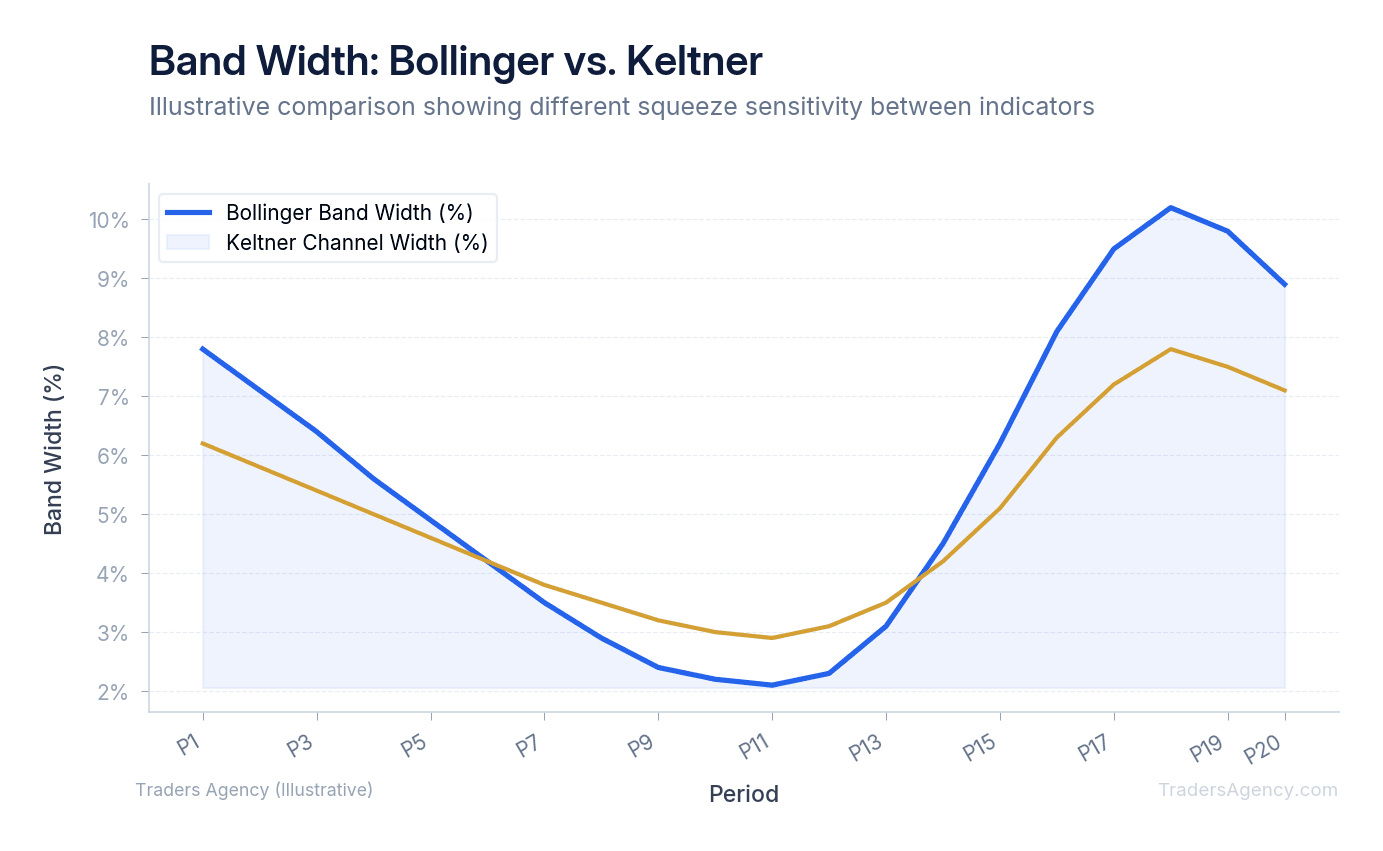
When the Bollinger Bands move inside the Keltner Channels, the market is exceptionally quiet. When the Bollinger Bands break back outside the Keltner Channels, the squeeze has officially fired. We prefer this dual-indicator method because it provides a clear, objective rule for entry.
| Feature | Bollinger Bands | Keltner Channels |
|---|---|---|
| Volatility Measure | Standard Deviation | Average True Range (ATR) |
| Band Behavior | Expands and contracts rapidly | Smoother, more gradual changes |
| Center Line | 20-period SMA | 20-period EMA |
| Squeeze Signal | Bands narrow relative to history | Bollinger Bands move inside Keltner Channels |
| Best Used For | Standalone squeeze detection | Confirming extreme low-volatility setups |
Want expert trading insights delivered daily?
Join thousands of traders who rely on Traders Agency for market analysis and trade ideas.
Join Traders AgencyHow Do You Trade the Breakout After a Squeeze?
You trade the breakout by waiting for a strong candlestick close beyond the upper or lower band on above-average volume. We recommend placing a stop loss just below the moving average for long trades. Your profit target should be at least twice your risk, and you should trail your stop as momentum continues.
To make this practical, we'll walk you through a specific example using the Bollinger Band squeeze indicator on a daily chart.
- Identify the Setup: Scan for stocks where the bands are visibly pinched. Let's say stock XYZ is trading at $50.00. The upper band is at $50.50 and the lower band is at $49.50. This $1.00 range is much tighter than the stock's historical average. The squeeze is active.
- Wait for the Trigger: You must wait for a daily candle to close outside this tight range. On Tuesday, XYZ pushes up and closes at $51.20. The volume on this day is 2.5 million shares, which is double the average daily volume. The bands begin to widen rapidly.
- Execute and Manage Risk: We enter the trade the next morning near $51.20. We place our stop loss at $49.80, just below the 20-period moving average. Our total risk is $1.40 per share. We set our initial profit target at $54.00, offering a two-to-one reward-to-risk ratio. As the stock climbs to $53.00, we trail our stop loss up to our breakeven point at $51.20 to protect our capital.
| Parameter | Value |
|---|---|
| Stock | XYZ at $50.00 |
| Squeeze Range | $49.50 (lower band) to $50.50 (upper band) |
| Breakout Entry | $51.20 |
| Stop Loss | $49.80 (below 20-period SMA) |
| Risk Per Share | $1.40 |
| Profit Target | $54.00 (2:1 reward-to-risk) |
| Volume Confirmation | 2.5M shares (2x average) |
How Do You Use RSI to Confirm a Mean Reversion Entry at the Bollinger Bands?
Mean reversion entries involve fading the initial breakout by waiting for the price to touch the outer band while an oscillator shows divergence. We look for the price to hit the lower band while the Relative Strength Index (RSI) is oversold, signaling a potential reversal back to the midline.
While breakouts are popular, they often fail. We prefer to teach our members how to trade the snapback. You don't need an expensive scanner for this. You can build a Bollinger Band squeeze setup free on most standard charting platforms using just the bands and the 14-period RSI.
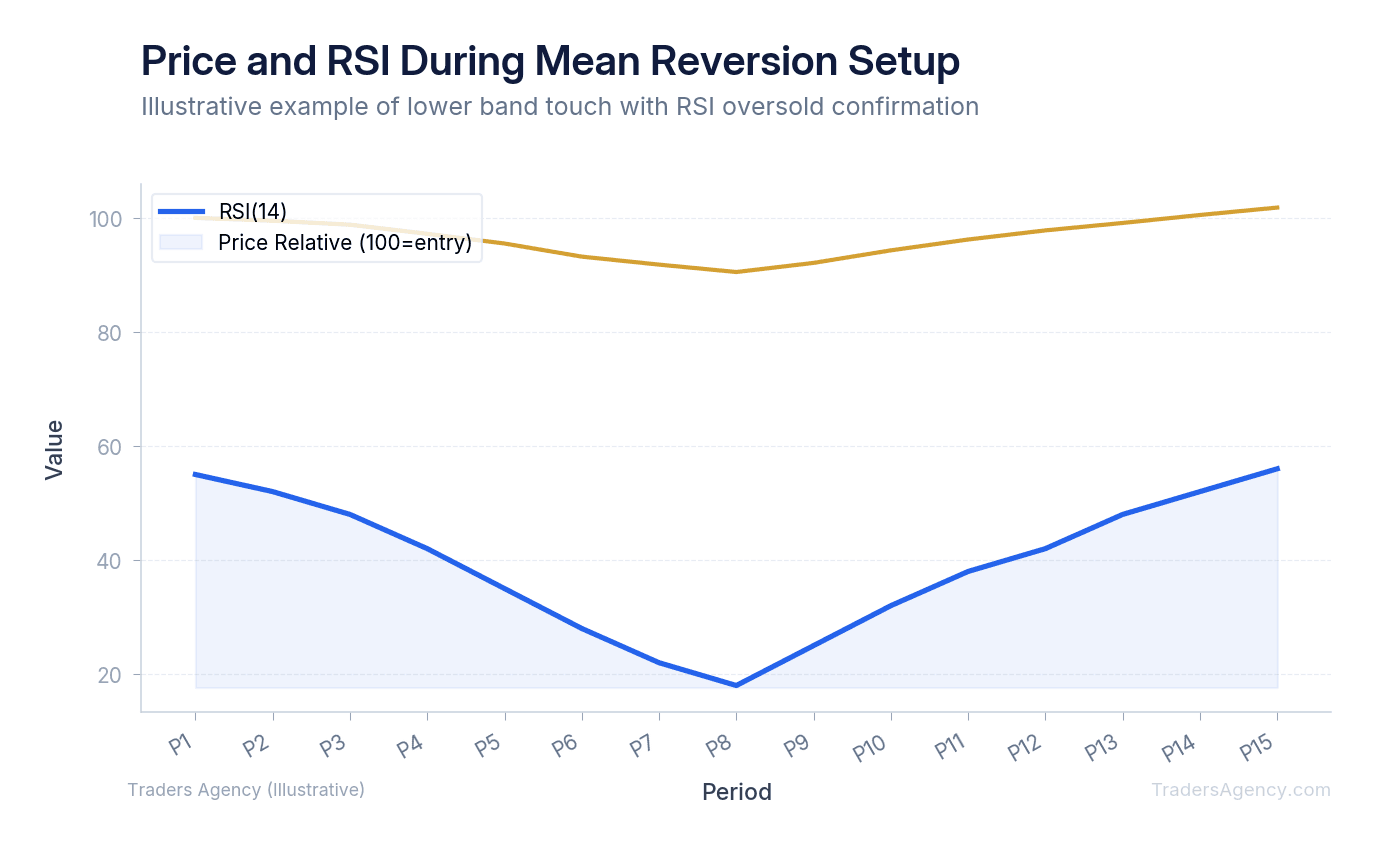
Here's how we execute a mean reversion trade:
- Spot the Band Touch: Wait for the price to break the lower band during or immediately after a squeeze.
- Check the RSI: If the RSI is below 30 (oversold) but starting to curl upward, it shows momentum is slowing and sellers are losing steam.
- Enter the Trade: Go long when the price crosses back above the lower band.
- Set Your Stop: Place a tight stop loss just below the recent swing low.
- Take Profits: Exit when the price reaches the 20-period simple moving average.
Here's a real-world example: if a stock drops to $45.00 and tags the lower band, but RSI is forming a higher low, the sellers are exhausted. We buy the bounce at $45.50 and target the moving average at $48.00. That's a clean $2.50 move with a well-defined risk level.
Key Concept: Mean reversion trades work best when an oscillator like RSI shows divergence at the outer band. Price making a lower low while RSI makes a higher low is a strong signal that selling pressure is fading and a snapback to the midline is likely.
What Are the Best Timeframes and Markets for Trading a Bollinger Band Squeeze?
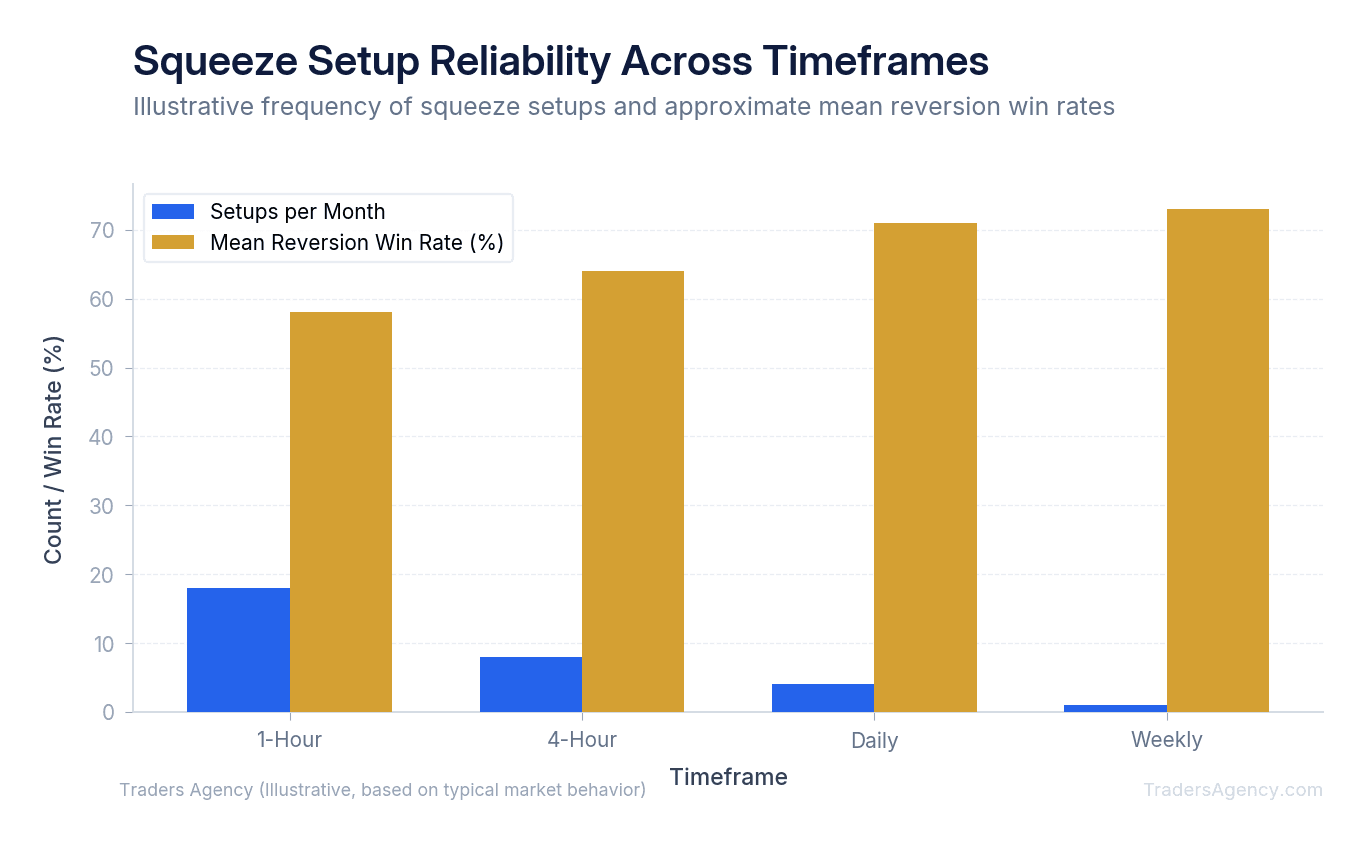
The most reliable timeframes for squeeze setups are the daily and weekly charts. Intraday timeframes like the five-minute or fifteen-minute charts produce too much noise and false breakouts. We prefer applying this strategy to highly liquid stocks and index ETFs that have clear historical trends.
Many new traders ask us for a Bollinger Bands squeeze setups PDF to print out and keep on their desks. The most important rule on that cheat sheet is to respect the higher timeframes. A squeeze on a weekly chart has months of built-up energy behind it.
We recommend applying this strategy to major index ETFs like SPY or QQQ, as well as large-cap tech stocks. These instruments have the institutional volume required to sustain a breakout. Low-float penny stocks are too erratic and will often gap right past your stop loss.
If you must trade intraday, stick to the 1-hour chart. It filters out the erratic morning volatility while still providing multiple trade setups per week.
| Timeframe | Squeeze Reliability | Best For |
|---|---|---|
| Weekly | Highest. Months of compressed energy. | Swing and position traders |
| Daily | High. Our preferred timeframe. | Swing traders |
| 1-Hour | Moderate. Acceptable for intraday. | Active day traders |
| 5-Min / 15-Min | Low. Too much noise and false signals. | Not recommended |
What Causes a Bollinger Band Head Fake and How Do You Avoid It?
The most common mistake is falling for a head fake, where the price breaks out in one direction before violently reversing. You can avoid this by requiring volume confirmation and waiting for the candle to close. Never enter a trade based on an intraday band pierce alone.
The Bollinger Band squeeze formula relies entirely on closing prices. If you buy a stock at 11:00 AM because it's trading above the upper band, you're taking a massive risk. By 4:00 PM, the stock might reverse and close back inside the range, leaving you trapped in a losing position.
Watch Out: A wick outside the Bollinger Band is NOT a breakout. The most dangerous trap in squeeze trading is entering before the candle closes. Wait for the daily close, confirm with volume, and only then commit your capital.
Here are the rules we follow to protect our capital:
- Always wait for the close. A wick outside the band is not a breakout. Only a closing price beyond the band counts.
- Check the volume. A breakout on low volume is usually a trap. We want to see volume at least 150% of the daily average.
- Control your position size. Never allocate more than 10% of your account to a single breakout trade.
- Use hard stop losses. If the price closes back inside the moving average, the setup is invalidated. Exit the trade immediately.
Trading a squeeze requires patience. You'll spend most of your time waiting for the bands to contract and the volume to confirm the move. By following these strict rules, you can avoid the traps that wipe out impatient traders and position yourself for the real momentum moves.
Want expert trading insights delivered daily?
Join thousands of traders who rely on Traders Agency for market analysis and trade ideas.
Join Traders AgencyKey Takeaways
- A Bollinger Band squeeze forms when the upper and lower bands contract around the 20-period simple moving average, signaling that a significant price move is building due to historically low standard deviation.
- Volume confirmation is non-negotiable: a valid breakout requires volume at least 150% of the daily average. Anything less is likely a trap.
- Position sizing rules limit single breakout trades to no more than 10% of your account, protecting capital during the frequent false moves that squeeze setups produce.
- A hard stop loss rule applies when price closes back inside the moving average after a breakout, which immediately invalidates the setup and signals an exit.
- RSI confirmation is used alongside band touches for mean reversion entries, giving traders a second data point before fading a move rather than chasing it.
DISCLAIMER: Traders Agency does not offer financial advice. The information provided is for educational purposes only and should not be considered financial advice. Traders Agency is not responsible for any financial losses or consequences resulting from the use of the information provided. Trading carries inherent risks and may not be suitable for all individuals. You are advised to conduct your own research and seek personalized advice before making any investment decisions, recognizing the potential risks and rewards involved.
See more from Traders Agency on Google
Make us a preferred source and our market analysis will appear more prominently in your Google Search, Top Stories, and AI results.
Add to Preferred Sources