
The gold-dollar relationship is one of the most reliable dynamics in the financial markets, and understanding it can give you a serious edge when trading precious metals. Because gold is priced in U.S. dollars globally, a stronger dollar makes gold more expensive for international buyers, which typically drives down demand and price. We'll walk you through exactly how this inverse correlation works, when it breaks down, and how to structure trades around it using specific vehicles like ETFs and options.
You've probably seen this play out on your trading screens. The dollar spikes on a strong jobs report, and your gold positions immediately take a hit. Many intermediate traders struggle with precious metals because they only look at the gold chart. They ignore the currency side of the equation entirely, and that's a costly blind spot.
By the end of this guide, you'll know how to read the U.S. Dollar Index (DXY) to time your gold entries. We'll also show you how to structure defined-risk trades using the SPDR Gold Trust (GLD) and options contracts.
Why Do Gold and the U.S. Dollar Have an Inverse Relationship?
Bottom Line: The gold-dollar relationship gives traders a concrete, actionable framework for timing precious metals positions, but only if they treat the DXY as part of the trade setup rather than an afterthought. The correlation is reliable, not guaranteed, and knowing when it breaks down is just as important as knowing when it holds. Position sizing discipline and hard stop losses are what keep you in the game long enough to benefit from the edge.
Gold and the USD move inversely because gold trades in U.S. dollars on every major global exchange. When the dollar gains value, foreign buyers must spend more of their local currency to purchase the same ounce of gold. This reduced purchasing power lowers global demand, which pushes gold prices down.
Our team recommends treating the dollar as a leading indicator for precious metals. If you're trading the GLD ETF or gold futures, you simply cannot ignore currency movements. The two assets sit on opposite ends of a seesaw.
Think about a jewelry manufacturer in India or China. If their local currency weakens against the dollar, importing gold becomes significantly more expensive. They buy less physical metal, which reduces aggregate global demand and puts downward pressure on price.
When inflation rises and the dollar loses purchasing power, investors flock to gold as a store of value. This flight to safety pushes gold prices higher while the fiat currency weakens.
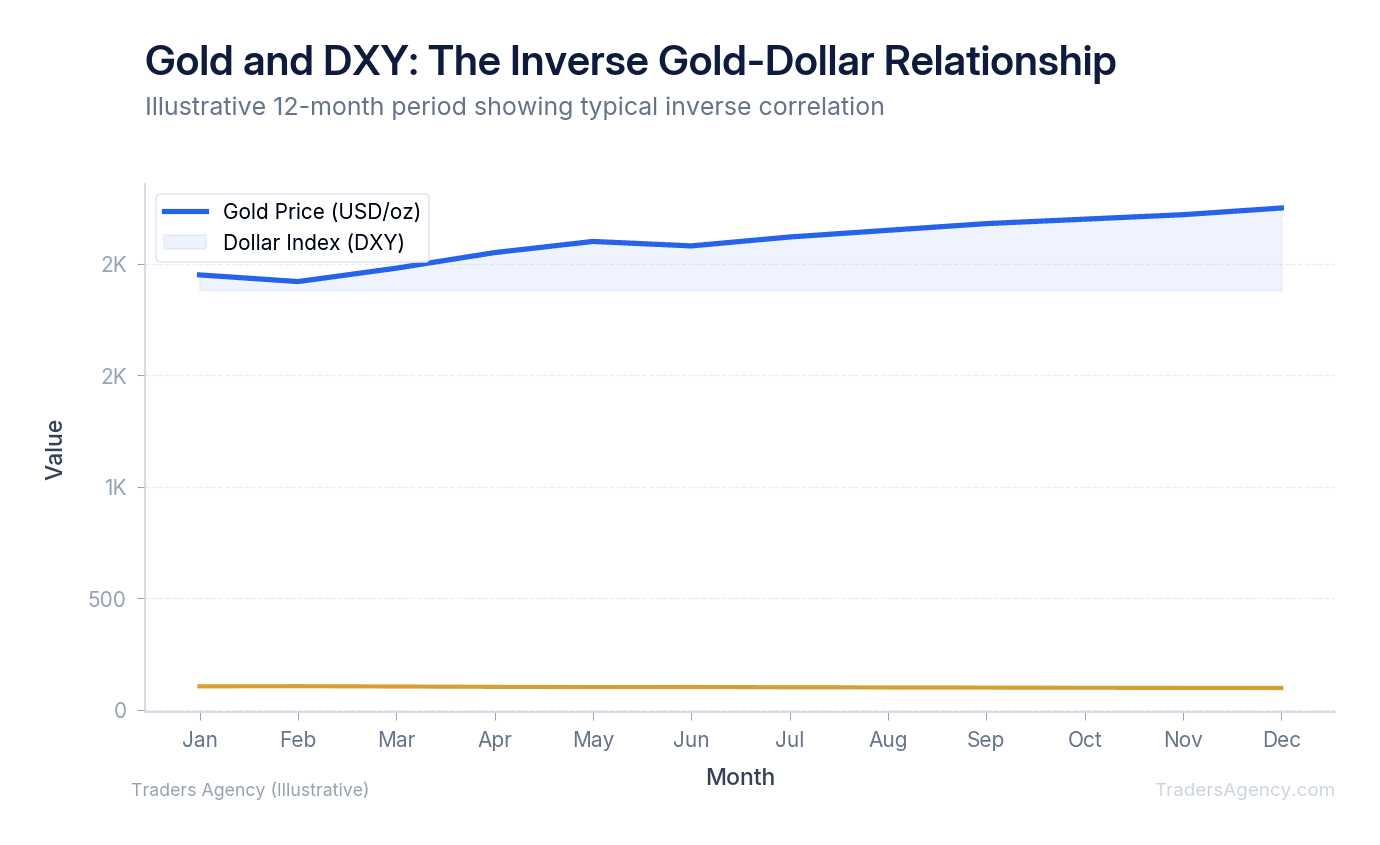
Key Concept: Gold is priced in U.S. dollars worldwide. When the dollar strengthens, gold becomes more expensive for international buyers, reducing demand and pushing prices lower. When the dollar weakens, the opposite occurs, and gold typically rallies.
This dynamic makes gold a popular hedge against currency debasement. When central banks expand the money supply aggressively, the dollar drops and gold historically catches a bid.
How Do You Use the DXY to Track the Gold-Dollar Relationship?
You can track the gold-dollar relationship in real time by monitoring the U.S. Dollar Index (DXY). The DXY measures the dollar against a basket of six major foreign currencies. Traders use it as a benchmark to anticipate gold price movements, often selling gold when the DXY breaks above key resistance levels.
The Euro makes up over 57% of the DXY weighting. This means weakness in the European economy often drives the DXY higher, which in turn pressures gold prices downward. Keep this in mind when European Central Bank announcements hit the wire.
We teach our members to keep a DXY chart open right next to their gold charts at all times. If the DXY is trending strongly above the 105.00 level, we generally avoid taking long positions in gold. The currency headwind is simply too strong.
Our research shows that a 1% move in the DXY often triggers a corresponding opposite reaction in gold futures. You don't need to trade currencies directly to benefit from this data. Simply using the DXY as a directional filter will improve your win rate on precious metals trades. The CME Group provides excellent data on how currency fluctuations impact commodity pricing if you want to study the historical correlations more deeply.
When Does the Gold-Dollar Inverse Correlation Break Down?
The inverse correlation breaks down during periods of severe geopolitical stress or extreme inflation. In these rare scenarios, investors buy both the U.S. dollar and gold simultaneously as safe-haven assets. This causes both to rise together, temporarily overriding their traditional inverse relationship.
You cannot rely blindly on the inverse rule 100% of the time. We prefer to look at real interest rates (nominal interest rates minus inflation) to confirm the trend.
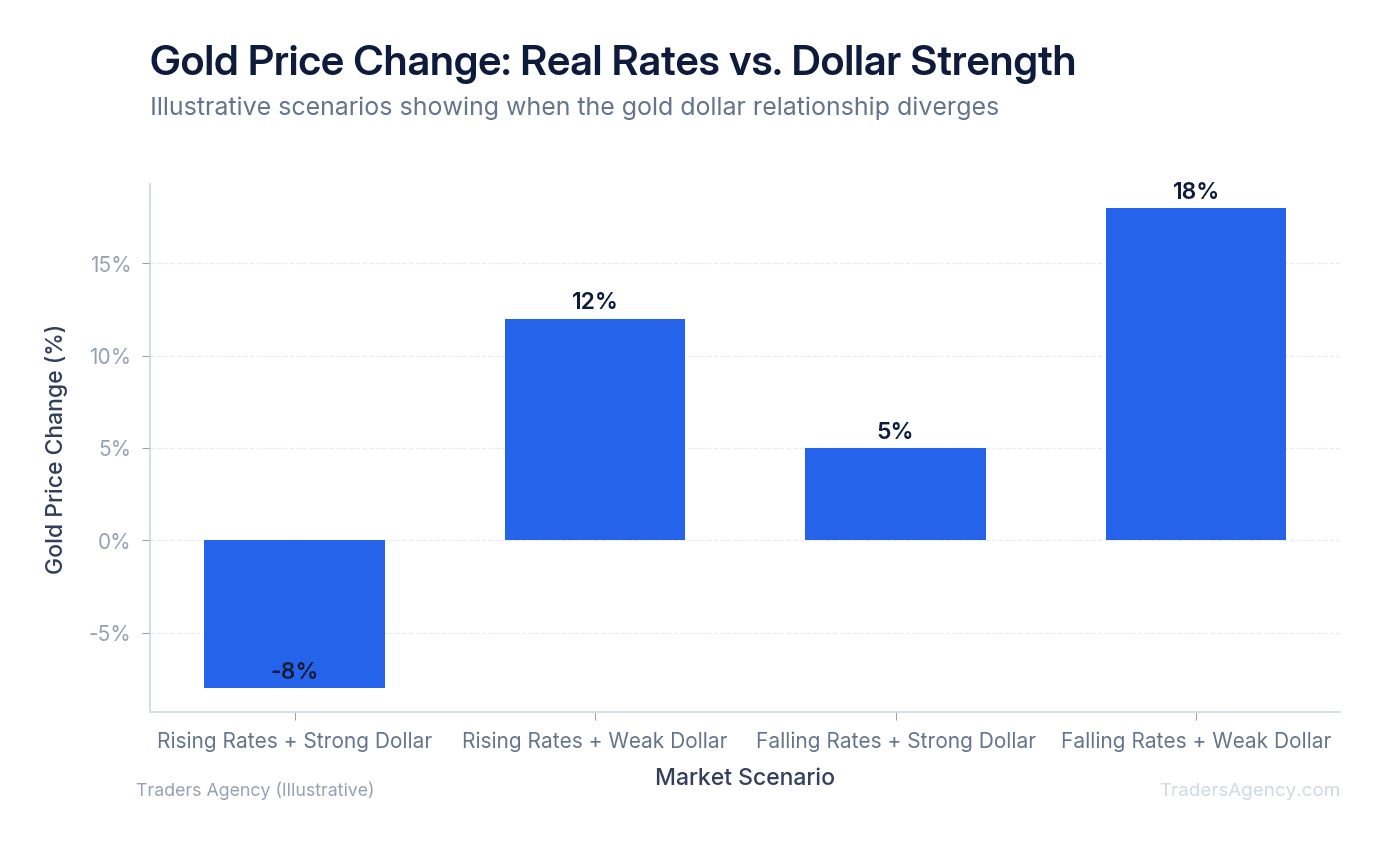
If inflation is running at 5% and interest rates are at 2%, the real yield is negative 3%. In a negative real yield environment, gold can rally even if the dollar remains relatively strong. The math favors hard assets when cash loses purchasing power faster than bonds can compensate.
We saw this exact scenario play out during recent global conflicts. Capital fled emerging markets into the safety of the U.S. dollar, while simultaneously pushing gold to all-time highs. Both assets rallied in tandem.
Watch Out: When the gold-dollar correlation breaks down, it usually signals extreme market stress. Don't fight both trends at once. Switch to monitoring real interest rates and pure price action on the gold chart to guide your entries and exits.
Recognizing these breakdowns is what separates intermediate traders from beginners. When the correlation fails, you must adjust your strategy and lean heavier on technical analysis rather than the currency relationship alone.
How Does Central Bank Gold Buying Affect the Gold-Dollar Relationship?
Another factor that disrupts the standard gold-dollar relationship is massive institutional buying. Over the past few years, global central banks have purchased record amounts of physical gold, fundamentally altering the supply-demand equation.
Nations in the BRICS economic bloc are actively working to reduce their reliance on the U.S. dollar. To achieve this, they are replacing their dollar reserves with thousands of tonnes of physical gold bullion. This is a long-term structural shift, not a short-term trade.
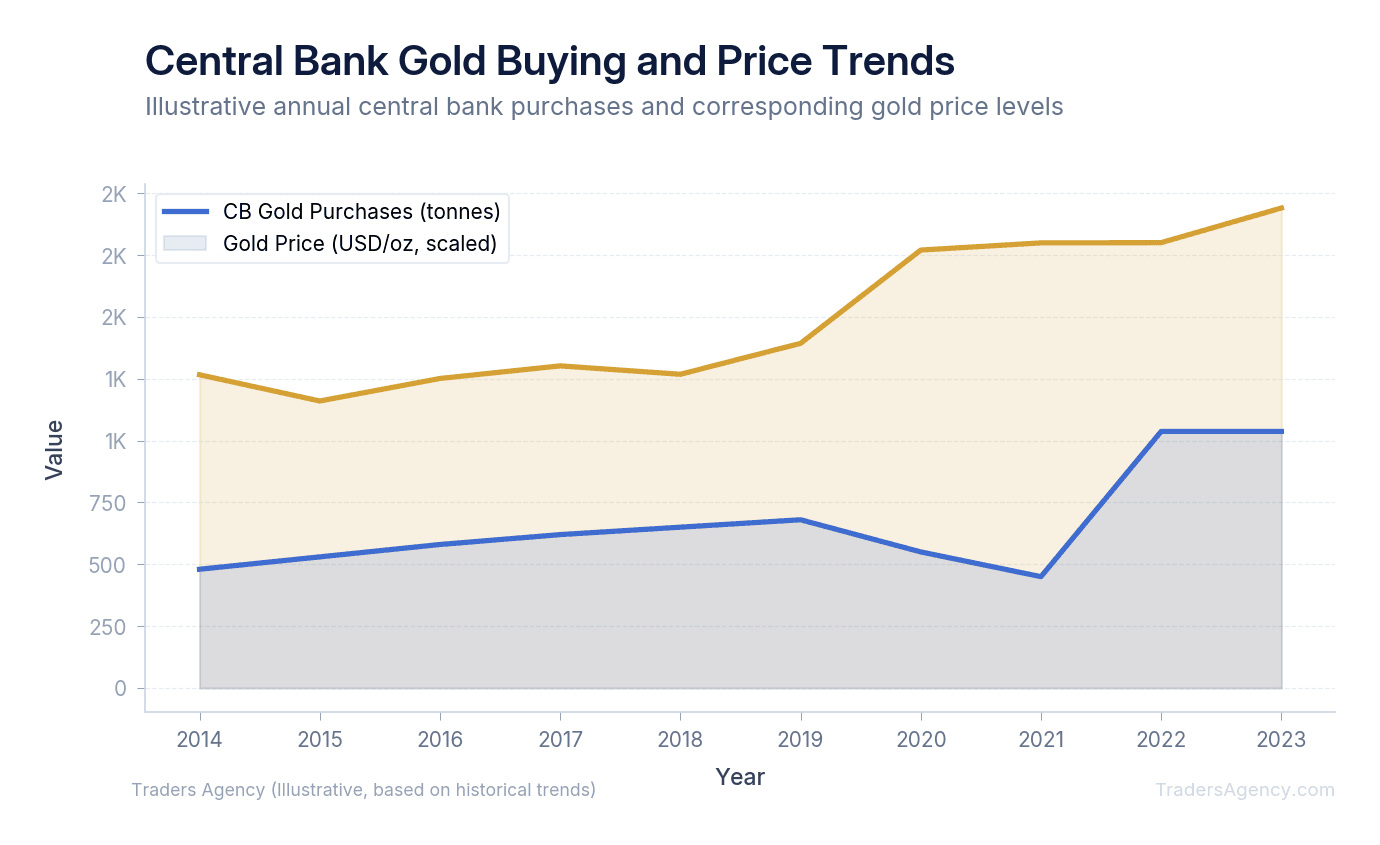
This central bank gold accumulation acts as a structural floor for gold prices. When sovereign nations buy gold regardless of the current price, it creates a massive supply deficit in the open market that supports prices even during dollar strength.
Even if the DXY is rallying, aggressive central bank buying can keep gold prices elevated. We always factor these macroeconomic trends into our longer-term swing trades.
Retail traders cannot fight sovereign wealth funds. If central banks are accumulating, we prefer to look for buying opportunities on dips rather than shorting the metal. Go with the flow of institutional capital, not against it.
Want expert trading insights delivered daily?
Join thousands of traders who rely on Traders Agency for market analysis and trade ideas.
Join Traders AgencyStep-by-Step: Trading the Gold-Dollar Relationship
Here's a specific, practical example of how we trade this setup. We'll use the SPDR Gold Trust (GLD) and options contracts to define our risk from the start.
- Step 1: Identify the Setup. Look for the DXY to hit a major resistance level and show signs of reversal. For example, the DXY reaches 107.00 and forms a bearish engulfing candle on the daily chart. This signals potential dollar weakness, which is our trigger to start looking for long gold setups.
- Step 2: Execute the Trade. With GLD trading at $190.00, we execute a bullish call debit spread. We buy the $190 strike call and sell the $195 strike call expiring in 45 days. This spread costs a net premium of $2.00 per contract (or $200 total risk). By using a spread, we reduce our capital outlay compared to buying straight calls or physical gold. The 45-day expiration gives the currency macro-trend enough time to play out.
- Step 3: Manage the Outcome. If the DXY drops to 104.00, GLD will likely rally. If GLD closes above $195.00 at expiration, our spread achieves its maximum value of $5.00. Subtracting our $2.00 entry cost, our max gain is $3.00 per contract (or $300 total). If the DXY breaks out higher instead and GLD drops, our maximum loss is strictly capped at the $200 we paid for the spread.
| Trade Parameter | Value |
|---|---|
| Underlying | GLD at $190.00 |
| Strategy | Bull Call Debit Spread |
| Long Leg | $190 strike call |
| Short Leg | $195 strike call |
| Expiration | 45 days |
| Net Debit (Cost) | $2.00 per contract ($200 total) |
| Max Profit | $3.00 per contract ($300 total) |
| Max Loss | $2.00 per contract ($200 total) |
| Breakeven at Expiration | $192.00 |
This defined-risk approach keeps you in the game even if the correlation temporarily breaks. You know your worst-case scenario before you ever click the buy button.
What Vehicles Should You Use to Trade Gold?
You can trade gold using physical bullion, exchange-traded funds (ETFs), or futures contracts. Each vehicle has distinct advantages depending on your account size, experience level, and trading timeframe.
Our team prefers ETFs for intermediate traders because they fit easily into existing brokerage accounts. You don't need special permissions or a separate futures account to trade them. GLD offers high liquidity and straightforward stock-market access.
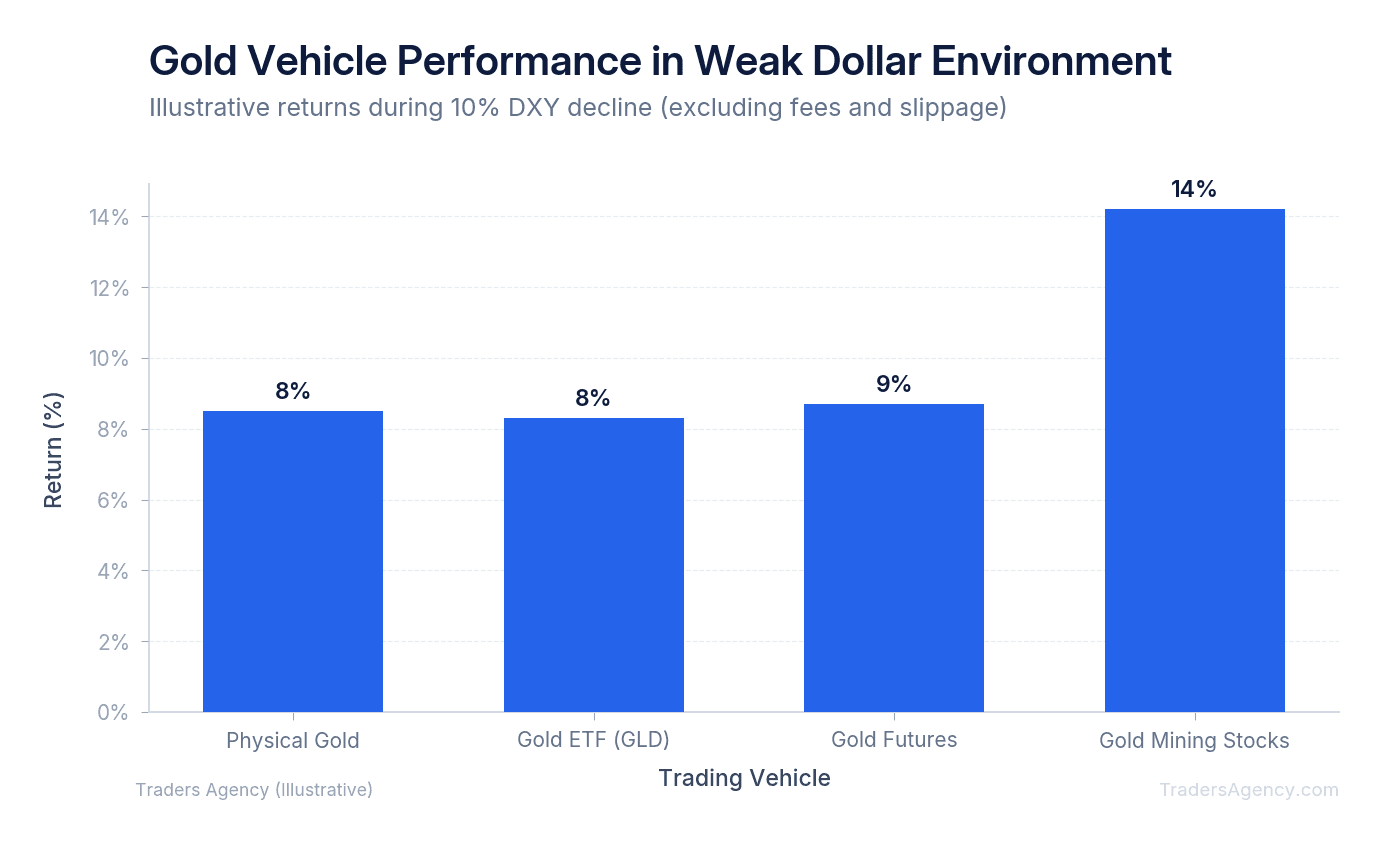
If you want to trade futures, look at the Micro Gold Futures (MGC) on the CME. These contracts represent 10 troy ounces, making them much more manageable for retail accounts than the standard 100-ounce contracts. A one-point move in the MGC contract equals just $10, allowing you to scale in and out of positions without taking on excessive risk.
| Vehicle | Best For | Key Advantage | Key Drawback |
|---|---|---|---|
| GLD ETF | Intermediate traders | High liquidity, easy brokerage access | Annual expense ratio |
| Micro Gold Futures (MGC) | Advanced traders | Capital efficiency, small contract size | Requires futures account |
| Physical Gold | Long-term wealth preservation | Direct ownership, no counterparty risk | Dealer premiums, storage costs |
Always check the expense ratio before holding an ETF long-term. Physical gold is great for long-term wealth preservation, but the dealer premiums make it a poor choice for short-term trading. Stick to paper assets when trading currency fluctuations.
Practical Application and Risk Management
You should use the gold-dollar relationship as a confirmation tool, not a standalone trading system. We combine dollar analysis with technical support and resistance levels on the gold chart itself. Never enter a trade just because the dollar ticked down for a single hour. You need alignment across multiple timeframes.
Here are the specific criteria we use to filter our gold trades:
- Confirm the DXY trend on the daily timeframe. A single intraday move isn't enough. We want to see a clear directional bias over multiple sessions.
- Check for upcoming Federal Reserve announcements that could spike currency volatility. Holding a short-term options position through a Fed rate decision is gambling, not trading.
- Identify clear support or resistance levels on the GLD or futures chart. The dollar signal and the technical level should align before you commit capital.
- Size the position to risk no more than 2% of total account equity. Position sizing is your ultimate defense against unexpected moves.
The Federal Reserve's monetary policy directly impacts both sides of this trade. When the Fed raises interest rates, the dollar typically strengthens because higher yields attract foreign capital. This forces gold prices down. Conversely, when the Fed signals rate cuts, the dollar weakens and gold becomes highly attractive.
Watch Out: A massive stock market selloff can trigger margin calls, forcing traders to liquidate their gold positions for cash. In these liquidity events, gold will drop even if the dollar is falling. Cash becomes the only asset that matters during a true market panic. Always use hard stop losses when trading futures or ETFs.
A common mistake is ignoring the broader equity markets. Sometimes a liquidity crunch overrides every correlation you've studied. If the dollar index breaks its technical trend against your position, exit your gold trade immediately rather than hoping the math corrects itself.
We always use hard stop losses when trading futures or ETFs. And we never risk more than 2% of account equity on a single gold trade. A sudden spike in the dollar can wipe out weeks of hard work if you're oversized. Discipline on position sizing protects your capital so you can keep trading through the inevitable rough patches.
Want expert trading insights delivered daily?
Join thousands of traders who rely on Traders Agency for market analysis and trade ideas.
Join Traders AgencyKey Takeaways
- Gold is priced in U.S. dollars on every major global exchange, so a stronger dollar directly reduces purchasing power for foreign buyers and pushes gold prices down.
- The U.S. Dollar Index (DXY) can be used as a leading indicator for gold entries and exits, not just a background reference.
- Defined-risk trades using GLD options contracts let you structure positions around the gold-dollar relationship without unlimited downside exposure.
- The inverse correlation between gold and the dollar breaks down during liquidity crunches, when both assets can move in the same direction regardless of fundamentals.
- Never risk more than 2% of account equity on a single gold trade, and always use hard stop losses when trading futures or ETFs to survive dollar spikes.
DISCLAIMER: Traders Agency does not offer financial advice. The information provided is for educational purposes only and should not be considered financial advice. Traders Agency is not responsible for any financial losses or consequences resulting from the use of the information provided. Trading carries inherent risks and may not be suitable for all individuals. You are advised to conduct your own research and seek personalized advice before making any investment decisions, recognizing the potential risks and rewards involved.
See more from Traders Agency on Google
Make us a preferred source and our market analysis will appear more prominently in your Google Search, Top Stories, and AI results.
Add to Preferred Sources