
Balance sheet analysis is the process of evaluating a company's financial health by examining its assets, liabilities, and shareholder equity at a specific point in time. You've probably seen this play out before: a company announces massive earnings growth, the stock spikes, and then suddenly plummets a week later when debt issues surface. Earnings reports only tell you how much money a company made over a quarter. They don't tell you if the company is drowning in short-term debt or sitting on a mountain of cash. We're going to walk you through exactly how to read these financial statements like a professional. By the end of this guide, you'll know how to calculate key liquidity metrics, spot hidden red flags, and determine if a stock actually deserves a place in your portfolio. We'll show you exactly what our team looks for before risking capital.
What Is a Balance Sheet and Why Does It Matter for Investors?
Bottom Line: Balance sheet analysis gives you a structural view of a company's financial health that earnings reports simply cannot provide. The key is knowing which ratios to calculate, which warning signs to look for, and how to use that information alongside technical levels and risk controls before committing capital.
A balance sheet is a financial statement that provides a snapshot of what a company owns and owes at a specific date. It matters for investors because it reveals the underlying financial stability of a business. This document shows whether a company can survive economic downturns or fund future growth.
Think of the income statement as a video showing a company's performance over a full year. The balance sheet is a photograph taken on the last day of that year. It freezes the company's financial position in place so you can inspect the foundation.
Our education team relies heavily on SEC EDGAR filings to verify these snapshots. We prefer to look at the raw data in a 10-Q quarterly report rather than relying on summarized press releases. Press releases are designed by marketing teams to highlight the positive. The raw financial statements force companies to disclose the mathematical truth.
Key Concept: A balance sheet is a point-in-time snapshot of a company's financial position, showing everything it owns (assets), everything it owes (liabilities), and the residual value belonging to shareholders (equity). Always read the raw SEC filings instead of relying on press release summaries.
What Is the Balance Sheet Equation and How Does It Work?
Every balance sheet analysis starts with one fundamental formula: Assets = Liabilities + Shareholder Equity. This equation must always balance perfectly.
Assets represent everything of value the company controls. This includes cash, inventory, property, and equipment. Liabilities represent everything the company owes to others, such as bank loans, accounts payable, and outstanding corporate bonds.
Shareholder equity is the theoretical amount of money left over if the company sold all its assets and paid off all its debt. It represents the true net worth belonging to the owners.
When we evaluate a company, we want to see equity growing over time. If assets are increasing but equity remains flat, the company is likely funding its growth entirely through new debt. That creates unnecessary risk for shareholders. A healthy business generates organic cash flow that directly increases the equity line item quarter after quarter.
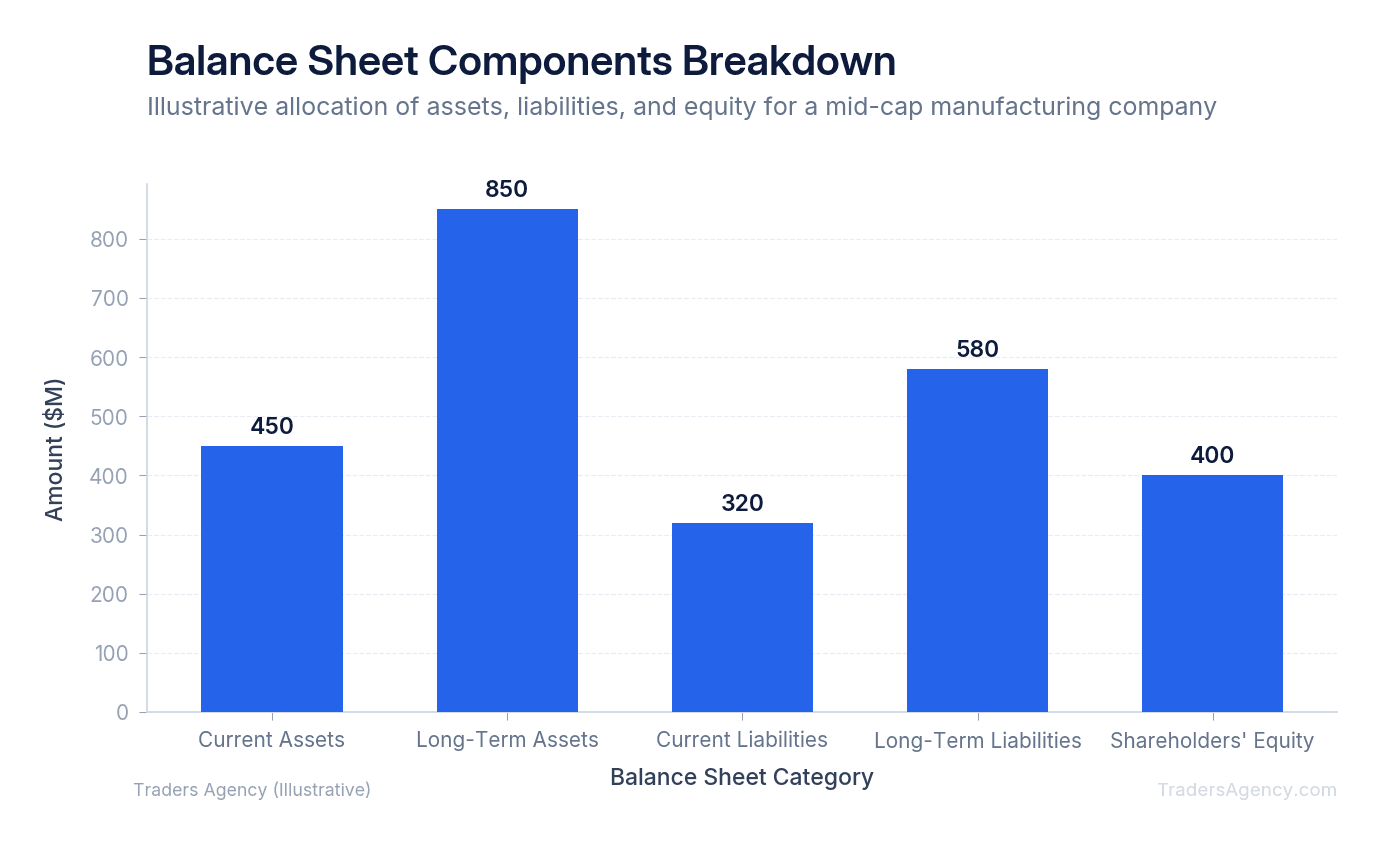
How to Analyze Current vs. Long-Term Assets
Not all assets are created equal. Financial statements divide assets into two distinct categories based on how quickly they can be converted into cash.
Current assets are highly liquid items the company expects to use or sell within one year. This category includes cash equivalents, marketable securities, and accounts receivable.
Long-term assets are investments the company plans to hold for more than a year. These include physical property, manufacturing equipment, and intangible assets like patents or goodwill.
We teach our members to focus heavily on the quality of current assets. If a company lists $50 million in current assets, but $40 million of that is aging inventory, their actual cash position is weak. You cannot pay employees or service debt with unsold warehouse stock.
Goodwill is another area where traders often make mistakes. Goodwill is an intangible asset created during corporate acquisitions. If a company overpays for an acquisition, they record the premium as goodwill. We regularly discount goodwill entirely when calculating a company's true tangible book value.
Watch Out: A large goodwill balance on the balance sheet can mask overpayment for acquisitions. If goodwill makes up a significant portion of total assets, the company's tangible net worth may be far lower than it appears. Our team always calculates tangible book value by stripping out goodwill and other intangible assets.
Key Liquidity Ratios: Current Ratio and Quick Ratio
Liquidity ratios measure a company's ability to pay its short-term bills. We use two primary calculations to test this financial flexibility.
The current ratio divides total current assets by total current liabilities. If a company has $100 million in current assets and $50 million in current liabilities, the current ratio is 2.0. A ratio above 1.0 generally means the company can cover its immediate obligations.
The quick ratio is a stricter test. It strips out inventory and prepaid expenses from the calculation, dividing only cash, cash equivalents, short-term investments, and accounts receivable by current liabilities.
| Ratio | Formula | What It Tells You |
|---|---|---|
| Current Ratio | Current Assets ÷ Current Liabilities | Can the company cover short-term obligations with all liquid assets? |
| Quick Ratio | (Cash + Receivables) ÷ Current Liabilities | Can the company cover short-term obligations without selling inventory? |
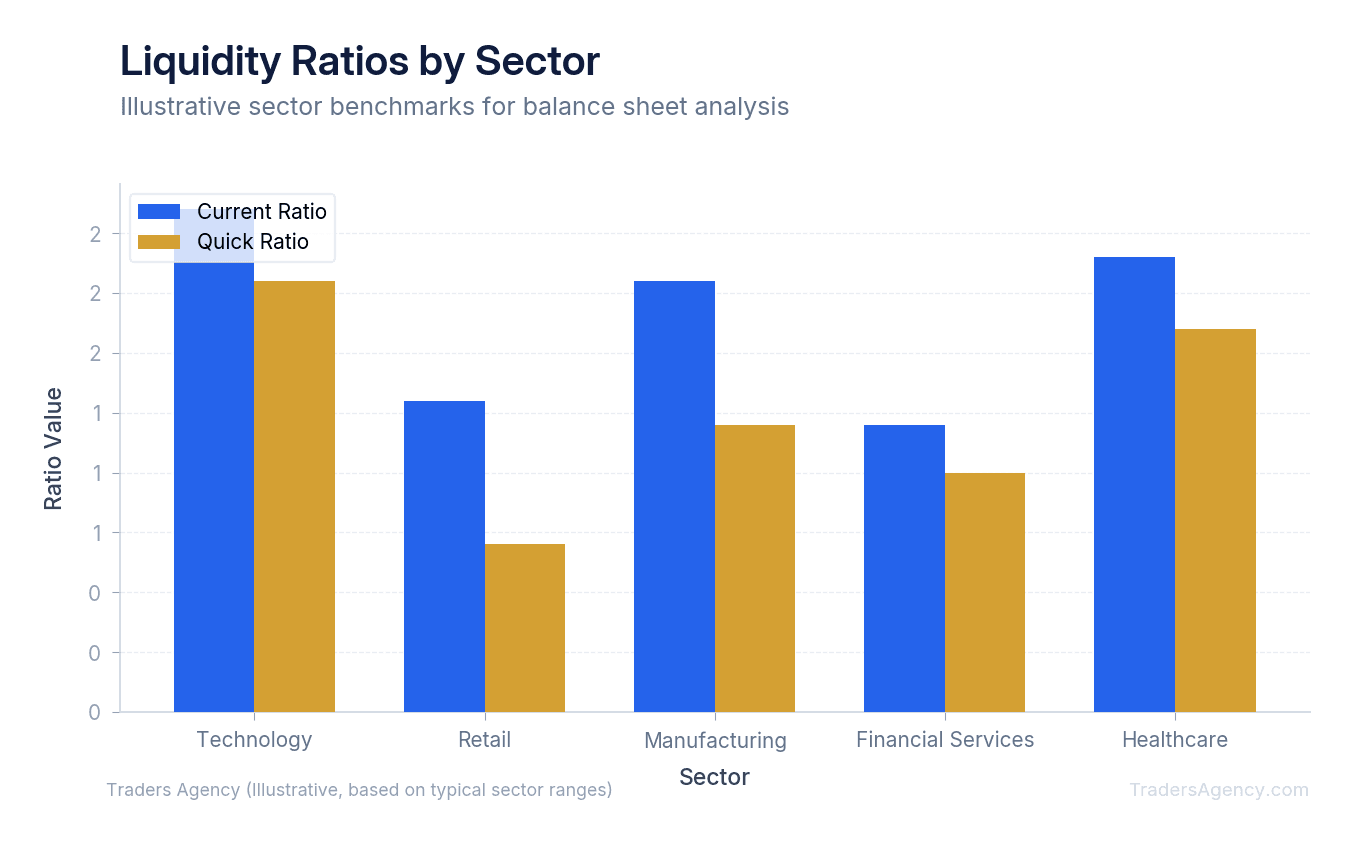
Different sectors have completely different baseline expectations for these metrics.
Technology Sector Benchmarks
Software companies typically carry very little physical inventory. A healthy tech company like Microsoft (MSFT) or Apple (AAPL) often maintains a quick ratio well above 1.5. They generate massive free cash flow and hold large reserves of marketable securities.
Retail Sector Benchmarks
Retailers operate differently. A company like Walmart (WMT) might have a current ratio of 0.8 and still be perfectly healthy. They turn over their inventory so fast that they generate cash before their bills to suppliers are actually due.
Manufacturing Sector Benchmarks
Industrial companies require heavy capital investments and maintain large raw material inventories. We typically look for a current ratio between 1.2 and 1.5 in this sector. This ensures they can manage supply chain disruptions without facing an immediate cash crunch.
Want expert trading insights delivered daily?
Join thousands of traders who rely on Traders Agency for market analysis and trade ideas.
Join Traders AgencyWhat Makes a Company Balance Sheet Strong or Weak?
You can tell a company has a good balance sheet if it maintains positive working capital, holds manageable debt levels compared to equity, and consistently grows its retained earnings. A strong balance sheet provides enough cash to cover short-term obligations without requiring the company to issue new shares.
Working capital is simply current assets minus current liabilities. It is the absolute dollar amount a company has available to fund its day-to-day operations.
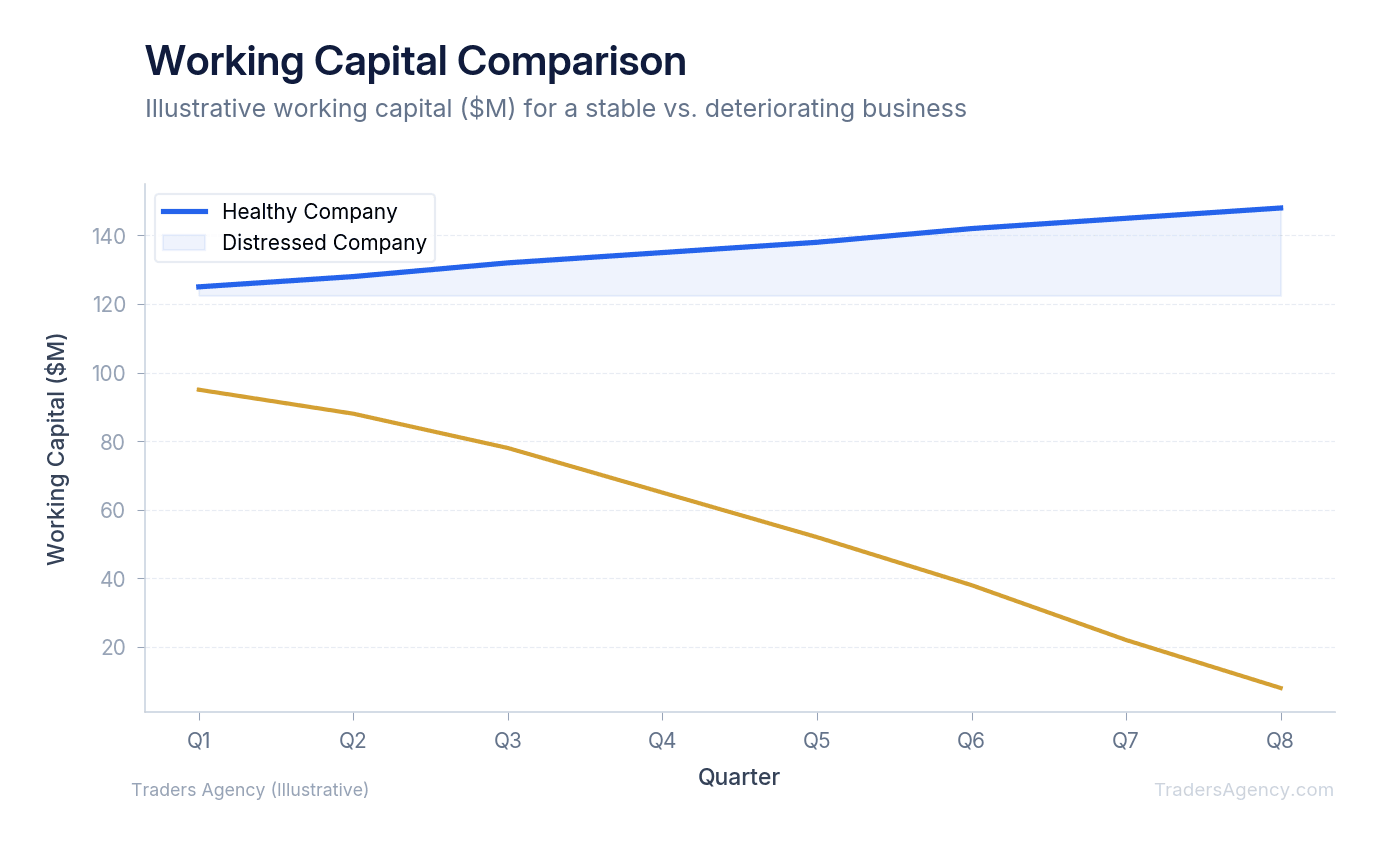
When evaluating a potential trade, we look for three specific signs of balance sheet strength:
- Cash and short-term investments should be growing year over year.
- Long-term debt should be stable or decreasing relative to total assets.
- The company should not rely heavily on short-term borrowing to fund long-term projects.
For example, if we look at a hypothetical stock trading at $50 per share, we want to see that the underlying business generates enough cash to service its debt comfortably. If interest expenses consume more than 30% of operating income, the balance sheet is too weak for a long-term hold.
What Are the Red Flags to Look for on a Company Balance Sheet?
You can spot red flags on a balance sheet by looking for rapidly increasing debt-to-equity ratios, ballooning accounts receivable, or large off-balance-sheet liabilities. These warning signs indicate that a company is struggling to collect cash from customers or hiding financial obligations from investors.
A rising debt-to-equity ratio is one of the clearest danger signals in fundamental analysis. This metric divides total liabilities by total shareholder equity.
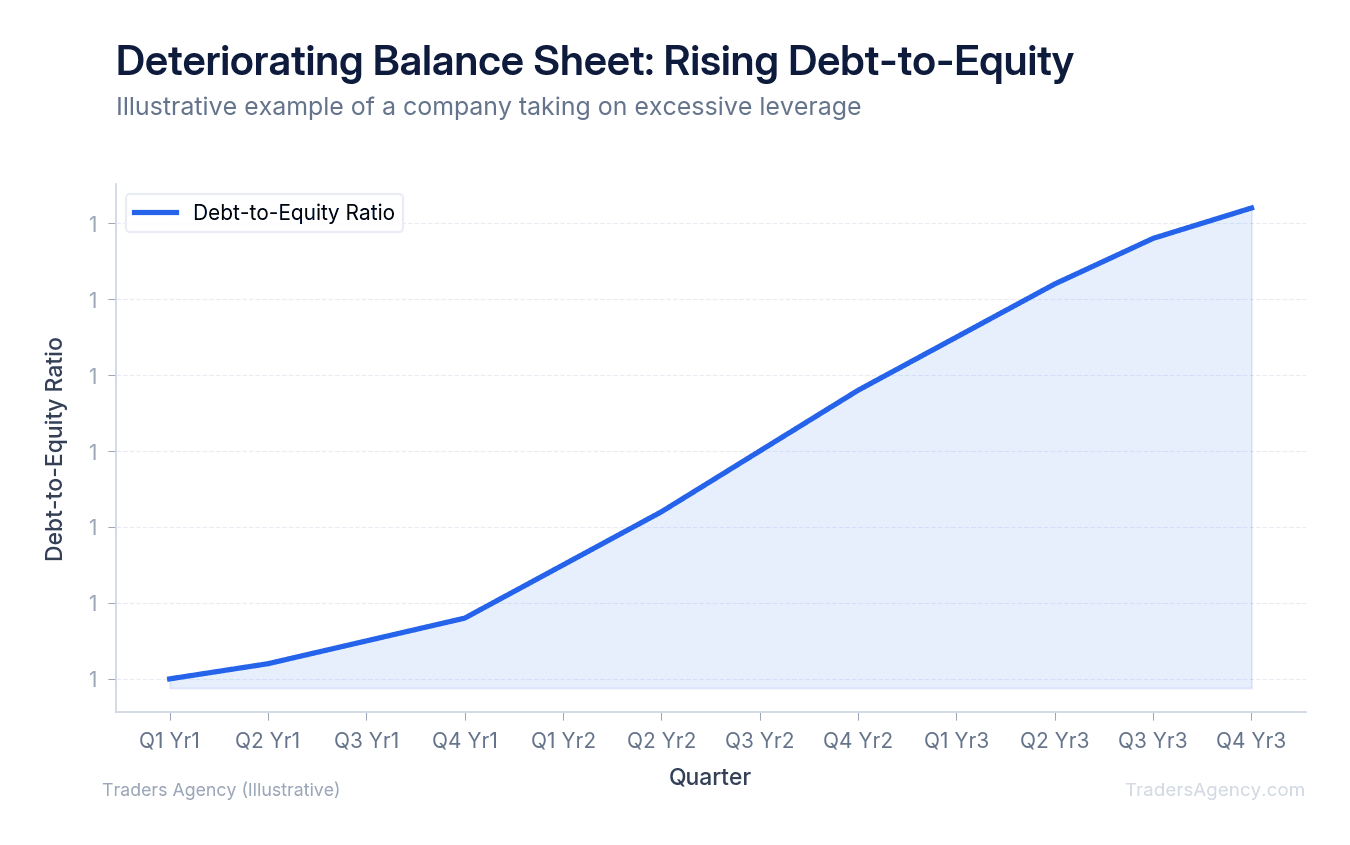
If a company has a debt-to-equity ratio that suddenly jumps from 0.5 to 1.5 over two quarters, management is taking on significant financial risk. This often happens right before a dividend cut or a massive share dilution.
Another major red flag is when accounts receivable grow much faster than revenue. If sales increase by 10% but accounts receivable jump by 40%, the company is booking sales but not actually collecting the cash. They are essentially extending loose credit to customers just to make their income statement look better.
Finally, watch out for contingent liabilities. These are potential future obligations, like pending lawsuits or massive operating leases, that might not appear directly in the main liability column. You must read the footnotes in the SEC filings to find them. If a pharmaceutical company is facing a massive class-action lawsuit, the potential settlement might not be recorded as a formal liability yet. We always search the document for the word "litigation" before taking a large position.
Watch Out: Contingent liabilities are often buried in the footnotes of SEC filings. Pending lawsuits, regulatory fines, and operating lease obligations can represent billions in hidden risk. Always read the footnotes before committing capital to any position.
Step-by-Step: Finding and Reading SEC Filings
To apply these concepts, you need to know where to find the raw data. We don't use simplified finance websites for serious balance sheet analysis. We go directly to the source.
- Locate the 10-K or 10-Q: Visit the SEC EDGAR database and search for your target company's ticker symbol. Look for the annual 10-K report or the quarterly 10-Q report. These are legally binding documents audited by professional accounting firms.
- Find the Consolidated Balance Sheet: Scroll to "Item 8: Financial Statements and Supplementary Data." The balance sheet is usually the first or second table presented. It will show data for the current period alongside the previous year for direct comparison.
- Calculate the Net Cash Position: Take the total cash and short-term investments, then subtract all current and long-term debt. For example, if a company has $5 billion in cash but $12 billion in total debt, their net cash position is negative $7 billion. This immediately tells you they are dependent on future cash flows to survive.
- Check the Retained Earnings: Retained earnings represent the accumulated profits a company has kept over its entire existence. We want to see this number consistently moving up and to the right. If retained earnings are negative, it means the company has lost more money than it has made since its inception.
| Metric | What to Look For | Red Flag |
|---|---|---|
| Net Cash Position | Positive and growing | Deeply negative, worsening each quarter |
| Retained Earnings | Consistently increasing | Negative or declining over multiple periods |
| Debt-to-Equity | Stable or declining | Rapid increase over 2+ quarters |
| Accounts Receivable | Growing in line with revenue | Growing significantly faster than revenue |
Practical Application and Risk Management
Balance sheet analysis is a defensive tool. It will rarely tell you exactly when to buy a stock, but it will absolutely tell you which stocks to avoid.
We use these metrics primarily for position sizing. If a company has a pristine balance sheet with zero debt and massive cash reserves, we might allocate a full 5% of our portfolio to the trade. If the company has great growth prospects but a highly indebted balance sheet, we might restrict our position size to just 1% or 2%.
| Balance Sheet Quality | Suggested Position Size | Reasoning |
|---|---|---|
| Strong (low debt, high cash) | Up to 5% of portfolio | Lower fundamental risk supports a larger allocation |
| Moderate (manageable debt, adequate liquidity) | 2-3% of portfolio | Some financial risk requires a more conservative size |
| Weak (high debt, low liquidity) | 1% or less | Elevated risk of adverse events demands strict limits |
Do not use this type of fundamental analysis for short-term day trading. Market sentiment and technical momentum drive minute-by-minute price action. Balance sheet strength only matters over periods of months or years. If you're trading a stock for a quick three-day swing, the current ratio is largely irrelevant to your immediate outcome.
Key Concept: Balance sheet analysis is best used as a filter and position-sizing tool. It helps you avoid fundamentally weak companies and gives you the confidence to size up on stocks with strong financial foundations. Always pair it with technical analysis and strict risk management for complete trade planning.
Always combine this analysis with proper risk management. Even a company with a perfect current ratio can experience a sudden stock drop due to macroeconomic factors. We strictly enforce stop losses on all positions, regardless of how safe the financial statements look. Never let a strong balance sheet convince you to hold onto a losing trade that has broken your technical support levels.
Want expert trading insights delivered daily?
Join thousands of traders who rely on Traders Agency for market analysis and trade ideas.
Join Traders AgencyKey Takeaways
- The balance sheet captures a company's financial position at a single point in time, making it a complement to the income statement rather than a replacement. One shows performance over time; the other shows what the company actually owns and owes on a specific date.
- Earnings growth alone can be misleading. A company can report strong quarterly profits while carrying dangerous levels of short-term debt that only appear on the balance sheet.
- The current ratio and quick ratio are the core liquidity metrics to calculate first. They tell you whether a company can meet its near-term obligations without selling long-term assets.
- Separating current assets from long-term assets matters because only current assets can be converted to cash quickly. A balance sheet heavy in long-term assets may look strong but offer little short-term flexibility.
- Even a clean balance sheet does not override technical analysis or risk management. Stop losses apply regardless of how healthy the financial statements look.
DISCLAIMER: Traders Agency does not offer financial advice. The information provided is for educational purposes only and should not be considered financial advice. Traders Agency is not responsible for any financial losses or consequences resulting from the use of the information provided. Trading carries inherent risks and may not be suitable for all individuals. You are advised to conduct your own research and seek personalized advice before making any investment decisions, recognizing the potential risks and rewards involved.
See more from Traders Agency on Google
Make us a preferred source and our market analysis will appear more prominently in your Google Search, Top Stories, and AI results.
Add to Preferred Sources