
Level 2 market data is a detailed trading feed that displays the order book, showing multiple levels of bids and asks alongside their sizes and market makers. This allows traders to anticipate price movements, identify potential opportunities, and see exactly where buying and selling pressure exists in the market. We'll walk you through how to read it, what to watch for, and how our team uses it every single day.
You've probably seen a stock hit a specific price and immediately bounce off it as if hitting a brick wall. We see this happen every day. Many beginners stare at standard line charts and wonder why the price reversed so violently. Our team relies on order book depth to understand exactly why these price reactions occur.
Standard candlestick charts only show you the past. They tell you where the price has already been. The order book shows you the present and hints at the immediate future. By the end of this guide, you'll know how to spot hidden liquidity, identify market maker activity, and improve your trade timing with Level 2 data. We'll show you exactly what to look for on your screen.
What Is Level 2 Market Data?
Bottom Line: Level 2 market data gives traders a live view of supply and demand that no chart pattern can replicate. The practical edge comes from combining order book depth with technical levels like VWAP, so that multiple signals confirm the same trade before you enter. If the order flow invalidates your thesis, the correct response is to exit, not wait.
Level 2 market data provides a real-time window into the pending orders for a specific stock. While basic quotes only show the highest buyer and lowest seller, this advanced data feed reveals the complete queue of resting limit orders waiting to be executed at various price levels.
Think of it like looking at a line outside a popular restaurant. A basic quote tells you someone is at the door ready to pay. The order book tells you exactly how many people are waiting in line, how much they're willing to spend, and who they are. This transparency is extremely useful for active traders.
Understanding market depth and order execution helps investors gauge stock liquidity and potential price volatility. When we trade, we use this feed to see the actual supply and demand mechanics before a price move happens. You're looking at the raw intentions of other market participants.
Key Concept: Level 2 data shows you the full queue of buyers and sellers waiting at every price level, not just the best bid and best ask. This gives you a real-time view of supply and demand before price moves happen.
Here's what you'll typically see on your screen when you open your data window:
- Market Maker ID (MPID): A four-letter code showing which exchange or participant is routing the order. Examples include NSDQ for Nasdaq or ARCA for NYSE Arca.
- Bid: The specific price buyers are willing to pay for the stock right now.
- Ask (or Offer): The specific price sellers are willing to accept to part with their shares.
- Size: The number of shares available at that specific price. This is often displayed in round lots of 100. A size of "5" means 500 shares.
What Is Level 1 Market Data and How Do You Read It?
To read Level 1 market data, you simply look at the National Best Bid and Offer (NBBO), which displays only the single highest price a buyer will pay and the lowest price a seller will accept. It provides a basic snapshot of the current spread without showing any underlying depth.
Level 1 vs. Level 2 data is a comparison of surface information versus deep structural information. If you only look at the basic quote, you might see a bid of $150.00 and an ask of $150.05. You know the current price, but you have no idea if there are 100 shares or 10,000 shares waiting just out of sight at $150.10.
Our team recommends upgrading to the full order book if you're actively day trading. Without it, you're trading blind to the actual supply and demand walls building up just outside the current spread. Level 1 is perfectly fine for long-term investors who just want to buy and hold a mutual fund. It's completely inadequate for a day trader trying to capture a quick fifty-cent move in a volatile tech stock.
| Feature | Level 1 Data | Level 2 Data |
|---|---|---|
| Best Bid/Ask | Yes | Yes |
| Multiple Price Levels | No | Yes |
| Order Sizes at Each Level | No | Yes |
| Market Maker IDs | No | Yes |
| Best For | Long-term investors | Active day traders |
| Typical Cost | Free | $0 to $30/month |
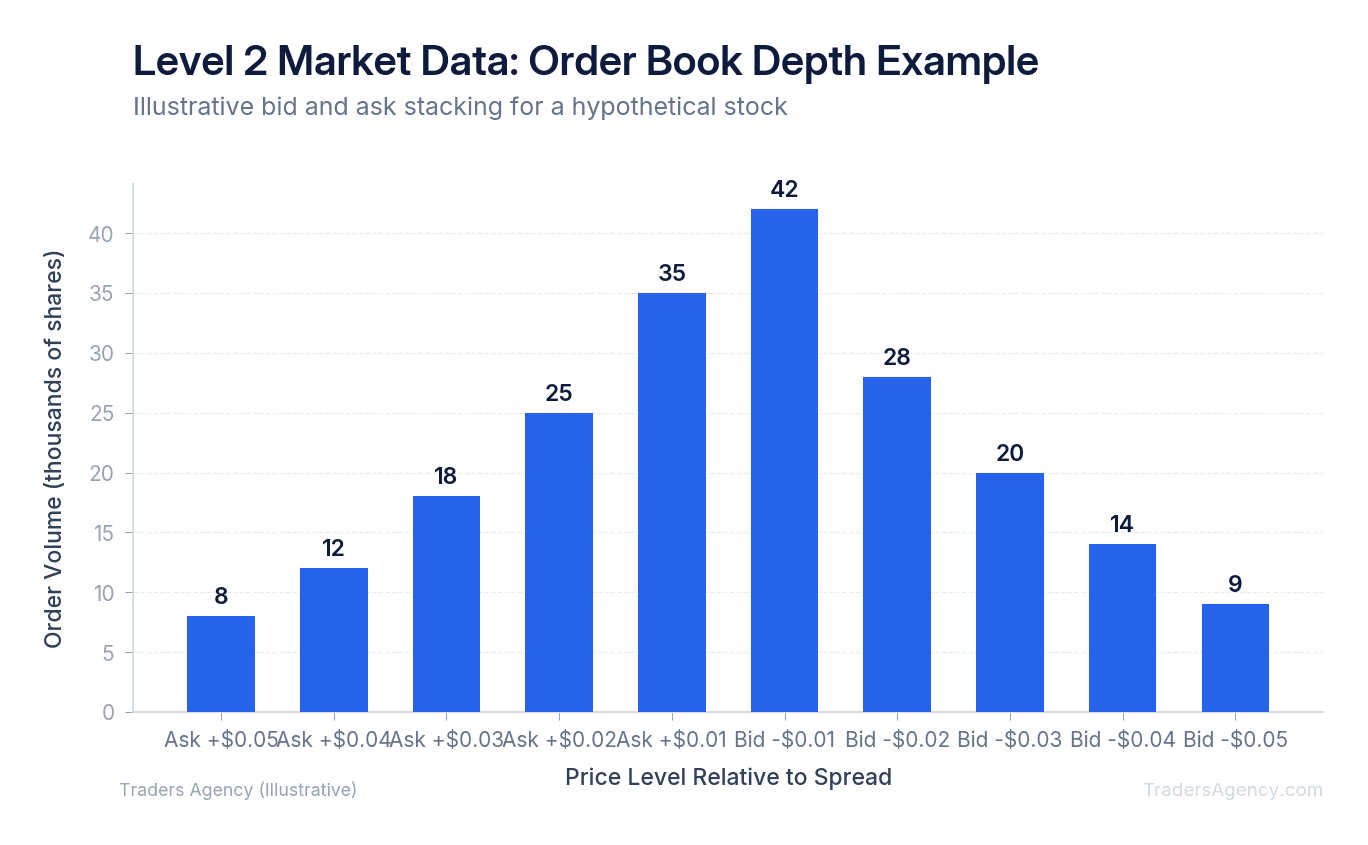
How Do You Read the Order Book for Buying and Selling Pressure?
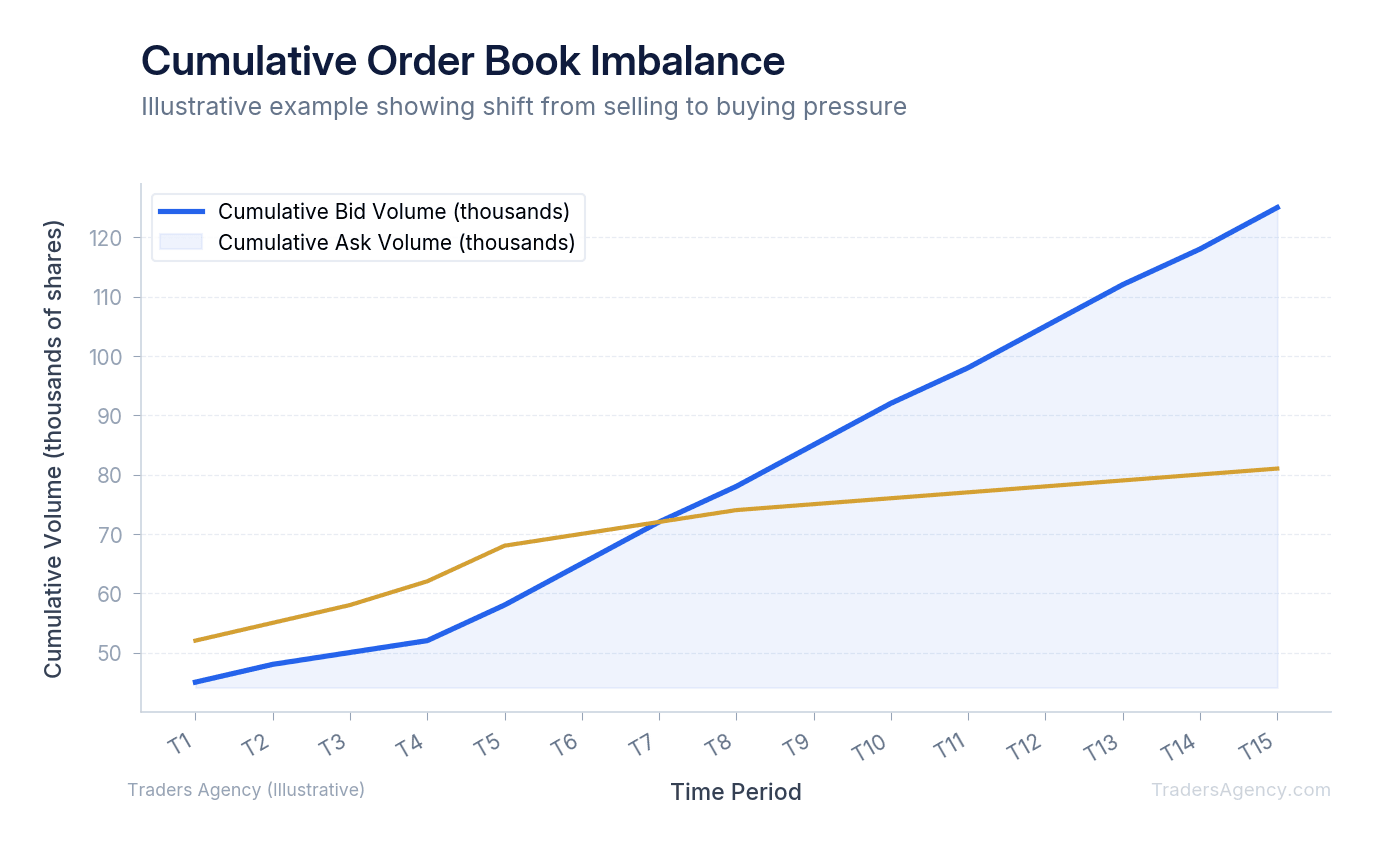
You read the order book for buying and selling pressure by comparing the cumulative size of bids against the cumulative size of asks. When bid sizes heavily outweigh ask sizes at nearby price levels, it indicates strong buying pressure that can push the stock price higher.
Let's walk through a concrete example using a hypothetical setup on Apple (AAPL). We'll look at exactly how bid-ask stacking works in a live market environment.
Imagine AAPL is currently trading at $150.00. You're looking for an entry point for a quick day trade. You open your Level 2 market data window and analyze the columns.
The Setup
| Side | Price Level | Size (Shares) |
|---|---|---|
| Bid | $150.00 | 500 |
| Bid | $149.95 | 2,000 |
| Bid (Large Wall) | $149.90 | 15,000 |
| Ask | $150.05 | 100 |
| Ask | $150.10 | 200 |
| Ask | $150.15 – $150.50 | 100–200 each |
Step-by-Step: Reading and Executing This Trade
- Identify the Bid Wall: We see a large wall of buyers sitting just below the current price at $149.90 with 15,000 shares. This acts as a short-term support level.
- Assess the Ask Side: Because the ask sizes are very thin (only 100 to 200 shares at each level), there is low resistance to the upside.
- Place Your Entry: We prefer to place our buy limit order slightly above the large bid wall, perhaps at $149.95. We do this to ensure we get filled before the price runs away.
- Set Your Stop Loss: Place a stop immediately below the bid wall at $149.85. If the wall disappears, our thesis is wrong and we exit.
- Monitor the Tape: Watch the time and sales window for execution speed. If orders are flying through quickly, that momentum can carry the price right through your target. If the tape is slow and sluggish, that large bid wall might be the only thing holding the price up.
| Scenario | What Happens | Outcome |
|---|---|---|
| Best Case | Sellers exhaust their small share sizes, aggressive buyers step up | Price pushes quickly through thin asks toward $150.50 |
| Most Likely | Temporary bounce off the $149.90 level | Tight window to capture a profit before the market rebalances |
| Worst Case | Large buyer at $149.90 cancels their order, support vanishes | Price drops rapidly, stop loss triggers at $149.85 |
Want expert trading insights delivered daily?
Join thousands of traders who rely on Traders Agency for market analysis and trade ideas.
Join Traders AgencyHow Do Market Makers and Hidden Orders Impact Level 2?
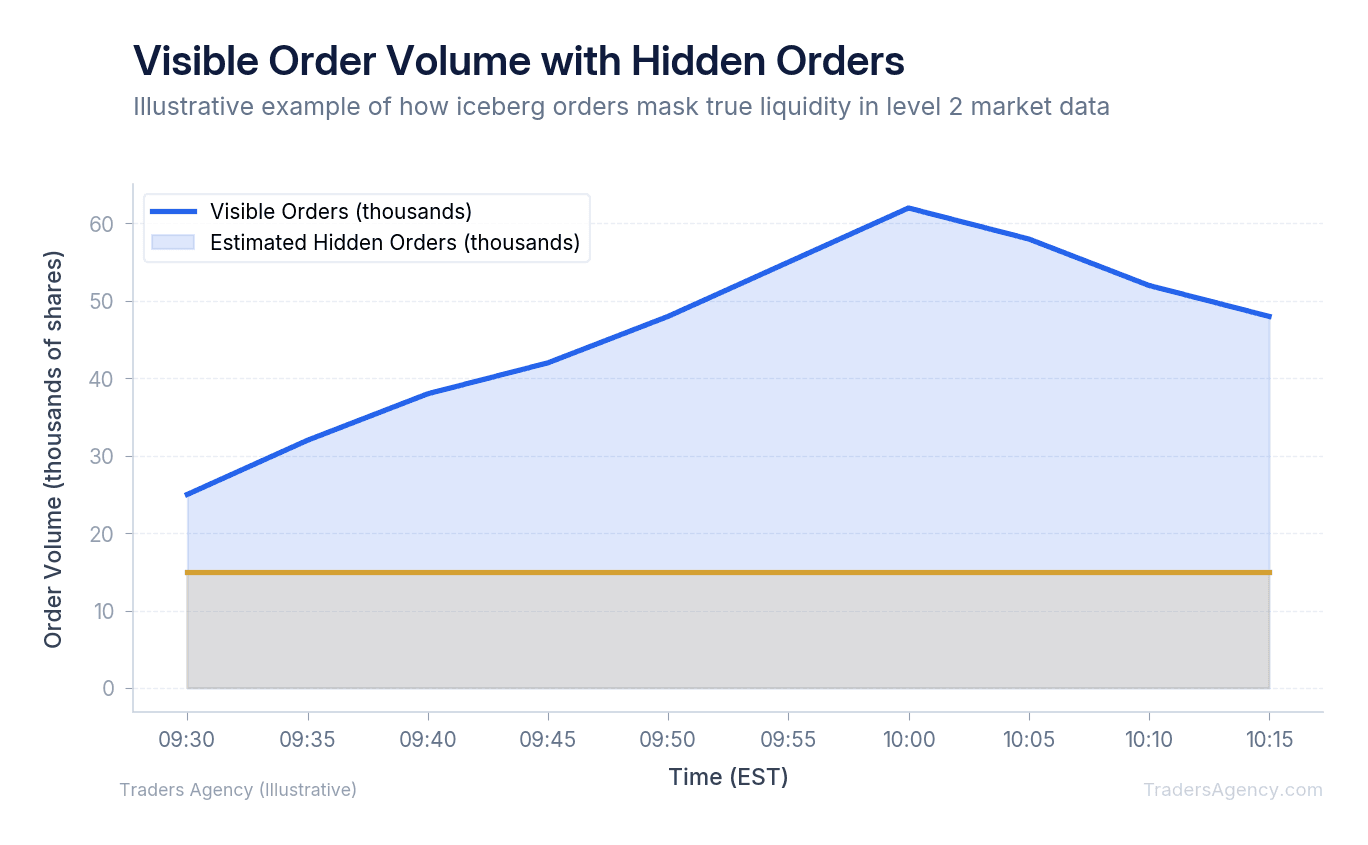
Market makers impact the order book by providing liquidity, but they often use hidden orders to conceal their true intentions. An iceberg order displays only a small fraction of the total shares available, masking the actual buying or selling pressure from retail traders reading the tape.
Market maker activity is a primary driver of short-term price action. These institutional participants use specific routing codes to manage their inventory. When we teach our members about reading the order book, we always warn them about deceptive practices like spoofing.
Watch Out: Spoofing happens when a large trader places a massive order with no intention of executing it. For example, they might place an order to sell 50,000 shares of Tesla (TSLA) at $200.50. Retail traders see this massive wall and panic sell. The price drops to $200.00, the large trader buys the cheap shares, and immediately cancels their fake sell order. This is illegal, but it still happens in fast-moving markets.
How to Spot an Iceberg Order
To spot an iceberg order, you have to watch the time and sales window alongside your depth chart. The time and sales window shows actual executed trades. Here's what to look for:
- Watch the Ask Size: You see an ask for 500 shares at $50.00 on the Level 2 screen.
- Compare to the Tape: The time and sales window shows 5,000 shares have already executed at $50.00, but the displayed ask size never drops below 500.
- Confirm the Hidden Seller: If shares keep executing at that price without the visible size decreasing, you've found a hidden seller. The visible liquidity is just the tip of the iceberg. The market maker is constantly reloading their sell order to offload a massive position without scaring away buyers.
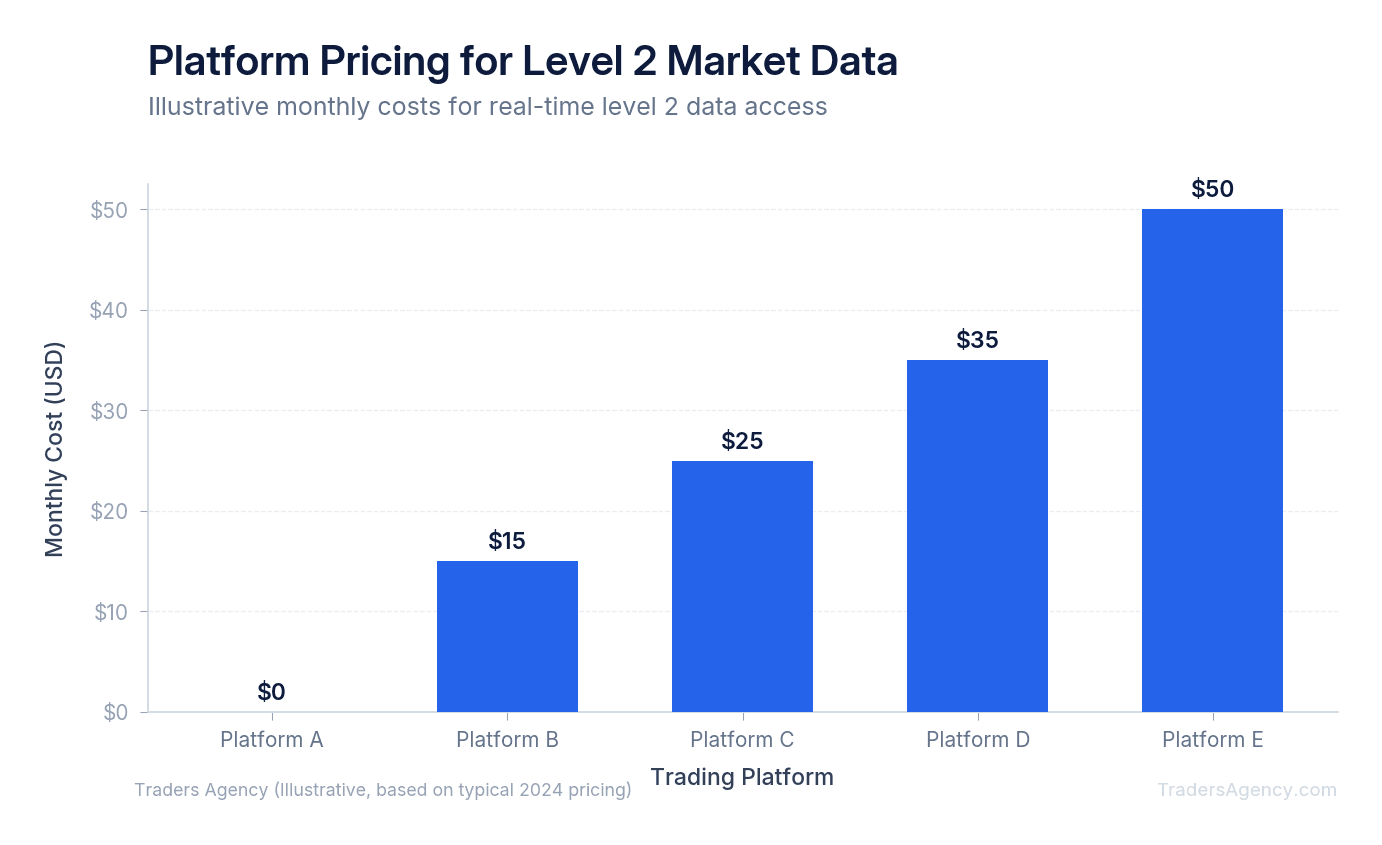
Which Platforms Offer Level 2 Market Data and What Do They Cost?
Most major brokerages offer level 2 market data, but access and pricing vary significantly. Professional day trading platforms usually charge a monthly data fee, while some retail brokers provide it for free if you maintain a minimum account balance or execute a certain number of trades.
Our team frequently reviews trading software to help members find the right tools. You need to know exactly what you're paying for when you subscribe to these feeds. Here's a breakdown of what you can expect:
- Direct Access Brokers: Platforms like CenterPoint Securities or LightSpeed are built specifically for active day traders. They offer unthrottled, tick-by-tick data. You'll typically pay between $15.00 and $30.00 per month for the Nasdaq TotalView and NYSE ArcaBook feeds.
- Retail Brokerages: Thinkorswim (Charles Schwab) and TradeStation often provide this data for free to funded accounts. However, the data might be slightly aggregated or delayed by milliseconds compared to direct access platforms.
- Charting Software: Tools like TradingView offer depth-of-market features, but you must purchase the specific exchange data packages separately. These usually cost around $2.00 to $5.00 per exchange on a monthly basis.
Our Recommendation: We prefer to pay for direct, unthrottled feeds when executing fast day trades. Milliseconds matter when you're trying to beat a high-frequency trading algorithm to a specific price level. If your data is lagging, you'll see a bid wall that has actually already disappeared.
When Should You Use Level 2 Data for Trade Timing?
You should use this strategy for trade timing when executing short-term day trades, scalping fast momentum stocks, or looking for precise entries near major support and resistance levels. It's highly effective for spotting immediate supply and demand imbalances during high-volume trading sessions.
We rely on trade timing with Level 2 during the first two hours of the market open. This is when liquidity is highest and the order book is most active. We look for large orders sitting at whole dollar amounts, like $100.00 or $50.00, because psychological levels attract the most volume.
When to Avoid Relying on Level 2 Alone
There are specific times you should avoid relying solely on this tool. Common mistakes happen when traders try to force this strategy in the wrong environment:
- Low Volume Stocks: If a stock trades less than 500,000 shares a day, the order book will be empty. The spread will be wide, and the data won't provide meaningful signals.
- Long-Term Investing: If you're buying a stock to hold for five years, agonizing over a five-cent spread on the depth chart is a waste of time. Focus on fundamentals instead.
- During Major News Events: When the Federal Reserve releases interest rate data, the order book empties out. Market makers pull their liquidity to protect themselves. The data becomes erratic and completely unreliable.
Risk Warning: Risk management is mandatory when trading based on order flow. We never allocate more than 1% to 2% of our total account capital to a single day trade. If we buy a stock because we see a massive bid wall at $100.00, our stop loss goes immediately below that wall at $99.90. If the wall disappears or gets executed, our thesis is wrong. We exit the trade immediately. We never hold and hope.
Combining Level 2 with Technical Indicators
Combining order book analysis with standard technical indicators gives you a much higher probability of success than using either tool in isolation. If a stock is trading above its Volume Weighted Average Price (VWAP) and we see a large bid wall forming right at the VWAP line, that's a very strong signal. The technical indicator and the order flow data are aligning perfectly. This is the exact type of setup we teach our members to look for every morning.
Want expert trading insights delivered daily?
Join thousands of traders who rely on Traders Agency for market analysis and trade ideas.
Join Traders AgencyKey Takeaways
- Level 2 data reveals the full order book, showing multiple bid and ask levels with sizes and market maker identities, not just the best available price.
- A large bid wall sitting at a key technical level like VWAP is a high-probability setup because order flow and technical analysis are confirming the same thing simultaneously.
- When a bid wall disappears or gets fully executed without price moving higher, that is a signal to exit immediately rather than hold and hope.
- Standard candlestick charts only show historical price action, while the order book reflects live buying and selling pressure in real time.
- Spotting hidden liquidity and market maker activity through Level 2 data helps traders understand why prices reverse sharply at specific levels, not just that they did.
DISCLAIMER: Traders Agency does not offer financial advice. The information provided is for educational purposes only and should not be considered financial advice. Traders Agency is not responsible for any financial losses or consequences resulting from the use of the information provided. Trading carries inherent risks and may not be suitable for all individuals. You are advised to conduct your own research and seek personalized advice before making any investment decisions, recognizing the potential risks and rewards involved.
See more from Traders Agency on Google
Make us a preferred source and our market analysis will appear more prominently in your Google Search, Top Stories, and AI results.
Add to Preferred Sources