
You have probably seen this happen before: you buy a stock, the chart looks perfect, and suddenly the price drops 3% in one minute for no obvious reason. Often, that sudden move is the result of a scheduled economic report you simply did not know was coming. An economic calendar is a scheduled list of significant financial events, government reports, and data releases that affect the financial markets. In this guide, our team will walk you through exactly how to use economic calendar tools to read these schedules and plan your trades around them. We will show you how to identify high-impact events, protect your account from surprise volatility, and build a consistent routine so you can make safer, more informed trading decisions.
What Is an Economic Calendar?
Bottom Line: An economic calendar is not just a reference tool; it is a risk management layer that tells you when the rules of normal price action temporarily change. The traders who use it consistently are not trying to predict the news, they are making sure a scheduled data release never catches them off guard. Knowing what is coming, and when, is the foundation of planning trades with an edge rather than placing them on hope.
An economic calendar is a digital tracking tool that displays the dates and times of upcoming national and global economic data releases. Traders use these calendars to see exactly when governments will announce inflation numbers, employment statistics, and interest rate decisions that drive market prices.
Think of this tool like a weather forecast for the stock market. You would not plan a long outdoor hike without checking for rain. Similarly, we prefer to check the schedule before placing a trade to ensure a major news event will not disrupt our setup. Institutional investors, hedge funds, and retail traders all watch the exact same schedule. When the data drops, millions of computer algorithms react instantly, creating massive price swings.
Key Concept: An economic calendar shows you when market-moving data will be released so you can plan your trades around it, not get blindsided by it. Checking the calendar before every trade session is one of the simplest habits that separates prepared traders from everyone else.
The Most Important Economic Indicators to Watch
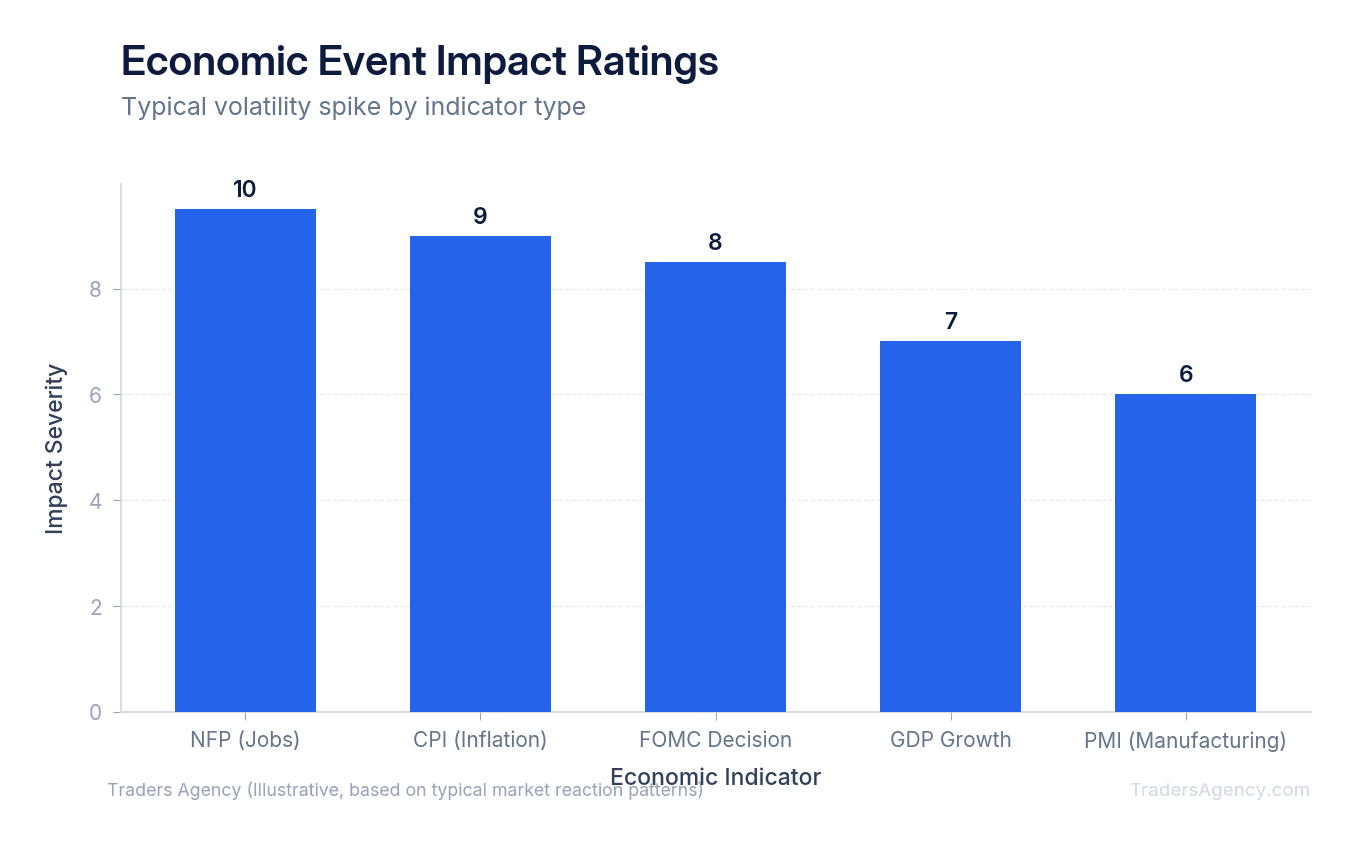
The most important economic indicators include the Non-Farm Payrolls (NFP) report, the Consumer Price Index (CPI), and Federal Open Market Committee (FOMC) interest rate decisions. Gross Domestic Product (GDP) and Purchasing Managers' Index (PMI) data also create significant market movement that requires careful trade planning.
We teach our members to focus on these specific "market-moving" events because they dictate the flow of institutional money. Here is a quick breakdown of what these reports mean for your portfolio:
| Indicator | Release Schedule | What It Measures | Impact Level |
|---|---|---|---|
| NFP (Non-Farm Payrolls) | First Friday of every month | Jobs added to the US economy | High |
| CPI (Consumer Price Index) | Monthly | Inflation rate; rising CPI often hurts stock prices | High |
| FOMC Rate Decision | 8 times per year | Interest rate changes from the Federal Reserve | High |
| GDP (Gross Domestic Product) | Quarterly | Overall economic growth; two consecutive negative quarters is commonly cited as a recession indicator | Medium-High |
| PMI (Purchasing Managers' Index) | Monthly | Health of manufacturing and services sectors | Medium |
How Do You Read an Economic Calendar: Forecasts vs. Actuals?
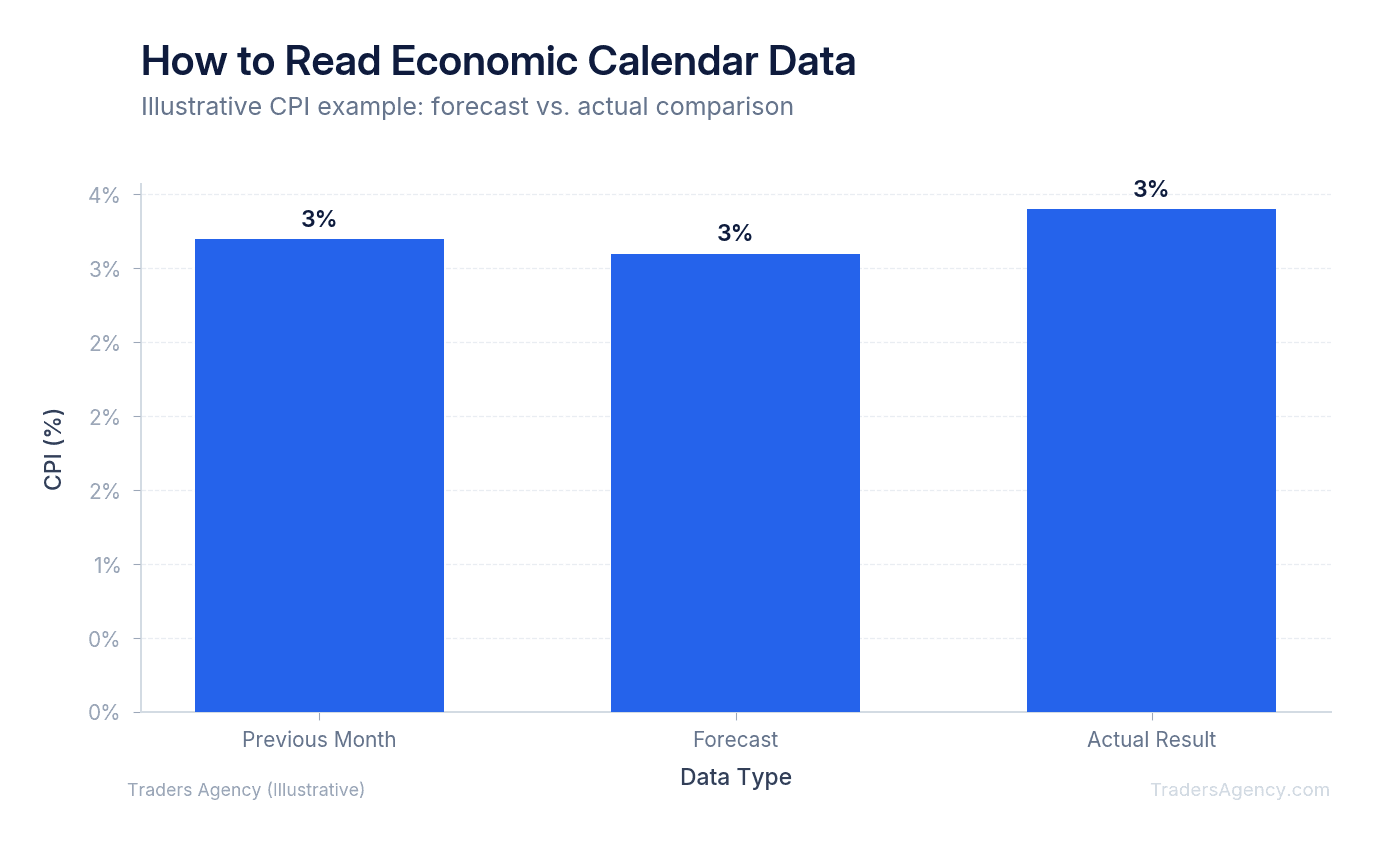
When you open an economic calendar platform, you will see a daily list of events. Each event has three specific numbers attached to it: the Previous number, the Forecast, and the Actual release. Understanding the relationship between these three columns is the secret to trading around the news.
The Forecast is what Wall Street analysts expect the number to be. The market usually prices this expectation into the stock before the event even happens. If the market expects inflation to drop, stock prices might slowly drift higher in the days leading up to the report.
The Actual number is the official data released at the exact scheduled time. The difference between the Forecast and the Actual is what causes massive price swings. If the actual data matches the forecast perfectly, the market often barely moves. If the actual data is a huge surprise, you will see aggressive buying or selling.
Key Concept: Markets do not move on the news itself. They move on the surprise. The gap between the Forecast and the Actual number is what triggers volatility. A "good" number that was already expected will barely move the needle.
How to Use an Economic Calendar for Trading: Step-by-Step Example
To use economic calendar data for trading, you must identify high-impact events, check the exact release time, and adjust your positions beforehand. Traders typically reduce their position sizes or tighten their stop losses right before the data drops to protect against sudden, unpredictable price spikes.
We will walk through a specific example using a CPI inflation report to show you exactly how this works in practice.
- Identify the Setup: Assume you are swing trading the SPY ETF (the S&P 500 index fund). The price is currently at $510.00. You check your economic calendar and see CPI data comes out at 8:30 AM EST tomorrow. The Forecast is 3.1%. You know that inflation data causes wild swings, so you need a plan.
- Execute Your Risk Management: Because you do not want to gamble on the outcome, you decide to manage your risk. You move your stop loss up to $505.00 to protect your capital. If you were trading options, you might notice that option premiums are very expensive right now. This happens because "implied volatility" rises before a big event. We usually avoid buying new options the day before a CPI report for this exact reason.
- Evaluate the Outcome: At exactly 8:30 AM EST, the Actual CPI comes in at 3.5%. This is much higher than expected. Because inflation is running hot, the market panics. The SPY ETF drops instantly from $510.00 to $502.00. Thanks to your preparation, your stop loss took you out safely at $505.00. You saved yourself from a much larger loss simply by checking the schedule.
| Parameter | Value |
|---|---|
| Instrument | SPY ETF |
| Entry Price | $510.00 |
| Stop Loss (Adjusted) | $505.00 |
| CPI Forecast | 3.1% |
| CPI Actual | 3.5% (hotter than expected) |
| SPY Drop After Release | $510.00 → $502.00 |
| Your Exit (Stop Loss Hit) | $505.00 |
| Loss Avoided by Planning | $3.00 per share saved vs. holding through the drop |
Want expert trading insights delivered daily?
Join thousands of traders who rely on Traders Agency for market analysis and trade ideas.
Join Traders AgencyHow Do Economic Events Affect Different Markets?
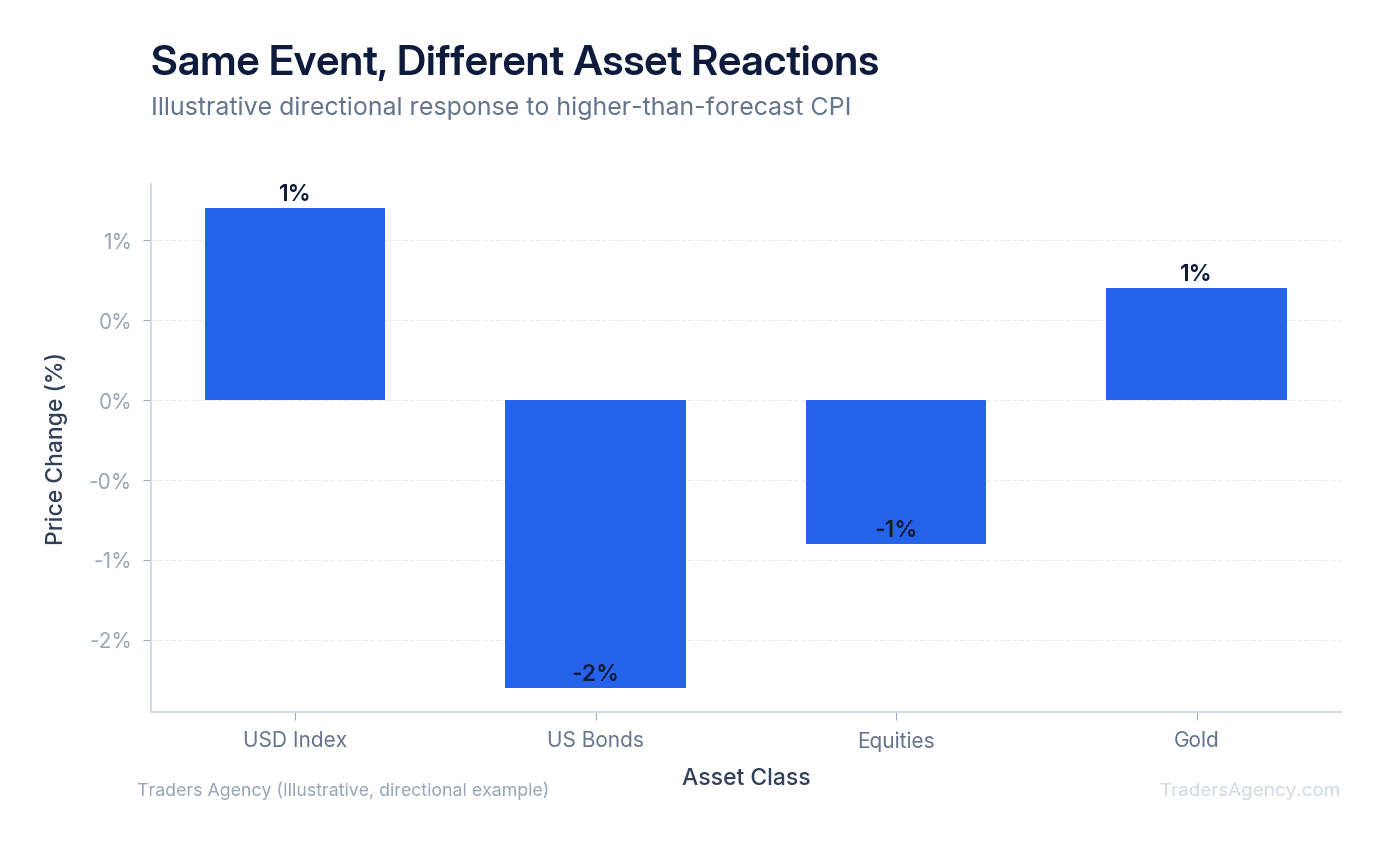
Economic events affect financial markets by changing the perceived value of currencies, stocks, and commodities based on new data. A single report can cause the US Dollar to strengthen, which simultaneously forces gold prices down and pushes stock market indexes into a rapid sell-off. The exact same event will impact different asset classes in unique ways. Everything in the financial system is connected.
If the FOMC announces they are raising interest rates to 5.5%, here is what typically happens across different markets:
| Asset Class | Typical Reaction to Rate Hike | Why It Happens |
|---|---|---|
| Forex (US Dollar) | Dollar goes up | Higher rates attract foreign investment, increasing demand for the dollar |
| Stocks | Market goes down | Borrowing becomes more expensive for companies, lowering future profit estimates |
| Commodities (Gold) | Gold often drops | A stronger dollar makes gold more expensive for foreign buyers, reducing demand |
We recommend studying how the Federal Reserve communicates its interest rate decisions. The language used in their official statements often moves markets just as much as the rate change itself.
What Mistakes Do Beginners Make When Trading Economic Events?
Trading directly during a major news release is highly risky. Our team recommends avoiding the temptation to guess the numbers before they come out. Many beginners treat news events like a casino, placing large bets right before the release. This is a fast way to lose your trading capital.
Here are the biggest mistakes to avoid when building your trade plan:
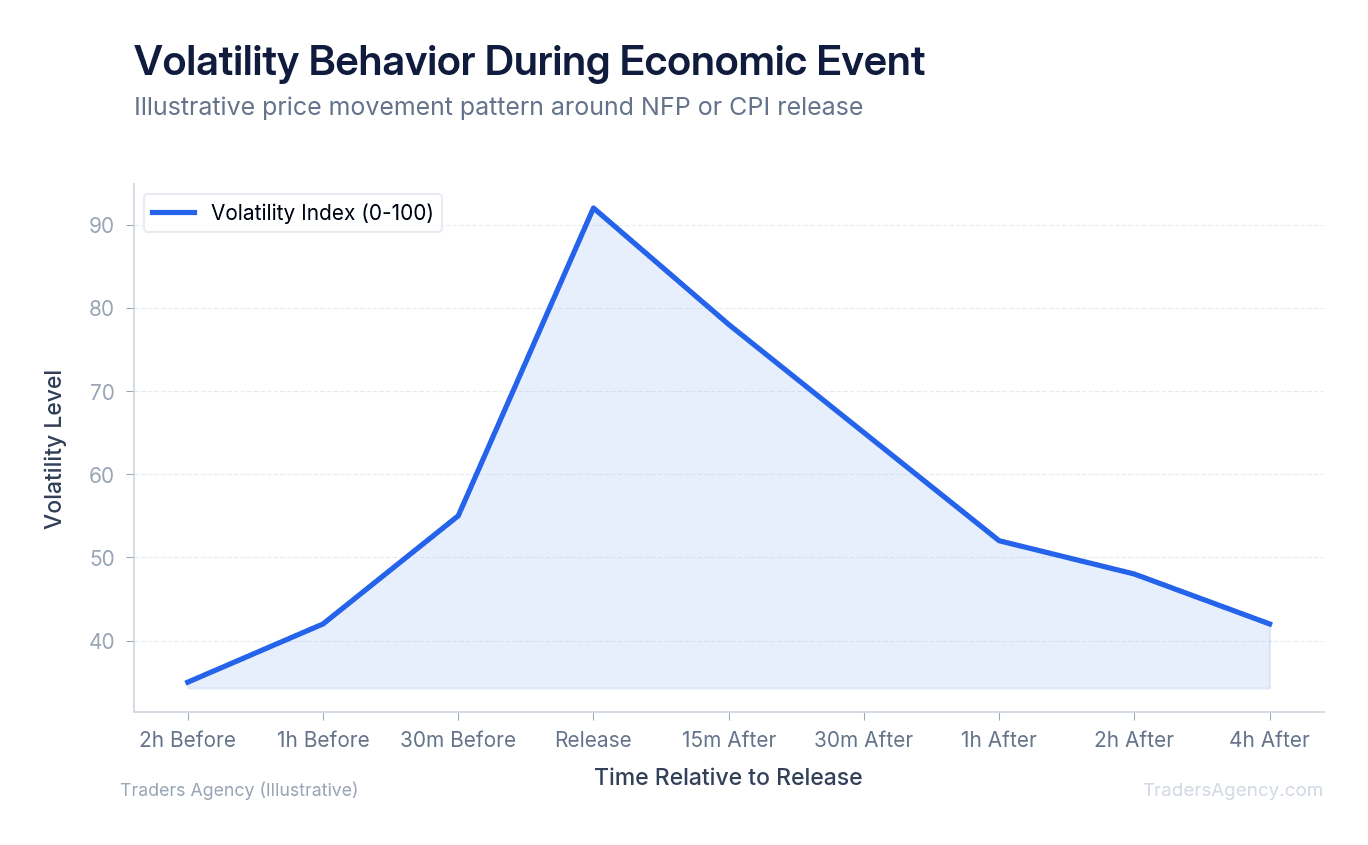
- Trading the initial spike: The first one-minute candle after a release is often a fake-out. The price might shoot up $2.00, trigger everyone's buy orders, and then immediately crash $5.00. We prefer to wait at least 15 minutes after a release for the market to choose a real direction.
- Ignoring data revisions: Sometimes the government revises the Previous month's data. If last month's job numbers are revised down by 50,000 jobs, the market might crash even if today's numbers look perfectly fine. Always check the revision column.
- Using standard stop losses during high-impact events: During a high-impact event, market liquidity completely dries up. The gap between the bid and ask price widens dramatically. Your stop loss at $150.00 might not fill until $148.00 due to slippage.
Watch Out: To protect yourself, always size your positions smaller than normal when news is pending. We recommend risking no more than 1% of total account equity around highly volatile economic events. The goal is to survive the surprise, not predict it.
Frequently Asked Questions
Which economic calendar is best for traders?
Many traders prefer free tools like ForexFactory, Investing.com, or TradingEconomics. These platforms offer clear color-coded impact ratings and historical data charts that are perfect for beginners trying to visualize market trends.
Should I buy stocks before an earnings report?
Earnings reports are like mini economic events for individual companies. We suggest avoiding holding short-term trades through earnings. The price can gap up or down significantly overnight, completely bypassing your stop loss.
What time of day do most economic reports come out?
In the United States, the most important data like CPI and NFP releases at 8:30 AM EST, exactly one hour before the stock market officially opens. FOMC interest rate decisions typically release at 2:00 PM EST.
What does a red icon mean on an economic calendar?
A red icon typically indicates a high-impact event. This means the release has a high probability of causing severe market volatility. Yellow or orange icons usually represent medium-impact events, while low-impact events are often shown in gray or green.
Can economic data affect crypto markets?
Yes. Bitcoin and other major cryptocurrencies often react sharply to US inflation data and interest rate decisions. Crypto trades very similarly to high-growth tech stocks during macroeconomic news events.
How long does volatility last after a news release?
The most extreme volatility usually lasts for the first 15 to 30 minutes after a major release. However, massive surprises can dictate the market trend for the entire week as institutional investors slowly adjust their portfolios.
The Traders Agency education team publishes new strategy guides and market analysis every week.
Want expert trading insights delivered daily?
Join thousands of traders who rely on Traders Agency for market analysis and trade ideas.
Join Traders AgencyKey Takeaways
- The most extreme post-release volatility lasts 15 to 30 minutes, but major surprises can shift the market trend for an entire week as institutions slowly reposition.
- Institutional investors, hedge funds, and retail traders all watch the same economic calendar, meaning algorithms react to the same data release simultaneously and can move prices 3% or more in under a minute.
- Comparing the forecast figure to the actual release is the core skill: a result that beats or misses expectations drives bigger price moves than the number itself.
- Crypto markets behave similarly to high-growth tech stocks during macroeconomic events, making the economic calendar relevant beyond traditional equities and forex.
- Building a consistent pre-trade routine around the calendar, checking for scheduled releases before entering a position, is the practical habit that separates prepared traders from reactive ones.
DISCLAIMER: Traders Agency does not offer financial advice. The information provided is for educational purposes only and should not be considered financial advice. Traders Agency is not responsible for any financial losses or consequences resulting from the use of the information provided. Trading carries inherent risks and may not be suitable for all individuals. You are advised to conduct your own research and seek personalized advice before making any investment decisions, recognizing the potential risks and rewards involved.
See more from Traders Agency on Google
Make us a preferred source and our market analysis will appear more prominently in your Google Search, Top Stories, and AI results.
Add to Preferred Sources



