
You've probably experienced this: you wake up, check your broker app, and see the major indices gapping up or down heavily at the open. Instead of guessing why this happens, we're going to walk you through exactly how to anticipate these moves using overnight futures data. By the end of this guide, you'll know how to calculate fair value, interpret pre-market volume, and apply specific rules to your morning routine.
What Are Futures Markets and Why Do They Signal Stock Direction?
Bottom Line: Reading overnight futures data, calculating fair value, and tracking pre-market volume can give traders a structured, rules-based framework for anticipating gap opens before the cash market begins. The core takeaway is that futures markets reflect global information in real time, and traders who learn to interpret that data may reduce reactive, emotion-driven decisions at the open. Risk controls, including hard stop orders, are treated in the article as essential to any futures-based morning routine.
Futures markets are financial exchanges where participants buy and sell contracts for future delivery of an asset. They signal stock direction because index futures trade nearly 24 hours a day, reflecting global news and overnight sentiment before the regular stock market opens at 9:30 AM Eastern.
While the stock market sleeps, the world keeps moving. Earnings reports are released, international markets open and close, and economic data is published. All of this information is immediately priced into index futures. When you learn to read these contracts, you gain a massive advantage over traders who only watch the cash market.
Key Concept: The relationship between futures and the underlying cash market is a primary driver of price discovery. Think of the futures market as a mood ring for the stock market. If futures are heavily bought overnight, it tells us institutional money is positioning for a strong open.
How Do ES, NQ, and YM Futures Work as Overnight Market Indicators?
To gauge the broader market, we focus on three specific index futures contracts. These are the most liquid instruments available for tracking overnight sentiment:
- ES (E-mini S&P 500): This is the benchmark. It tracks the S&P 500 index and represents the broader health of the US stock market.
- NQ (E-mini Nasdaq 100): This contract tracks the tech-heavy Nasdaq 100. We watch the NQ to see if technology stocks are leading or lagging the broader market.
- YM (E-mini Dow): This contract tracks the Dow Jones Industrial Average. It gives us insight into industrial and blue-chip stock performance.
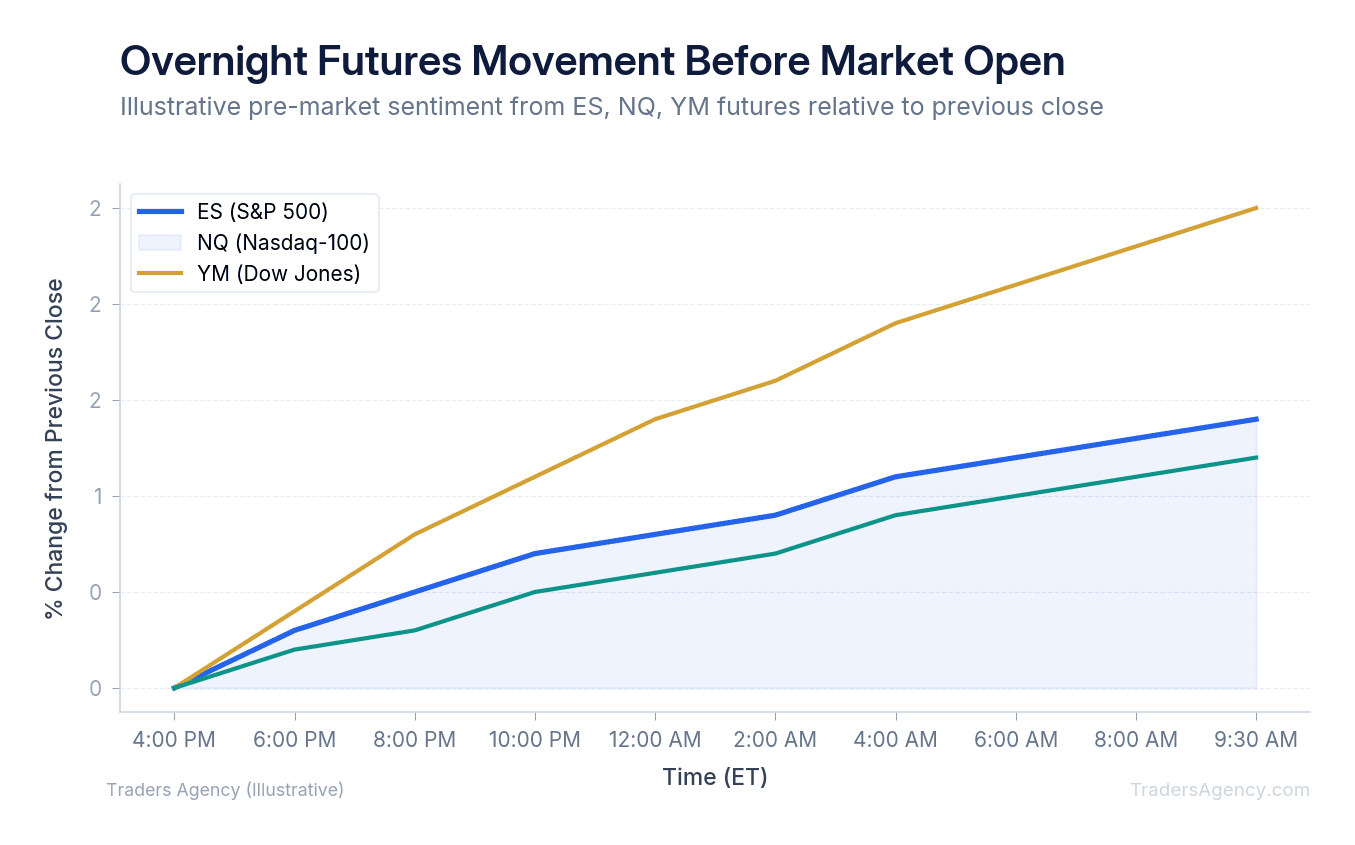
Our team teaches members to check these three tickers every morning at 8:00 AM Eastern. If the ES is up +0.50%, the NQ is up +0.80%, and the YM is flat, we know tech stocks are driving the morning optimism. This tells us exactly where to look for trading opportunities when the market opens.
How Do You Calculate Fair Value Before the Stock Market Opens?
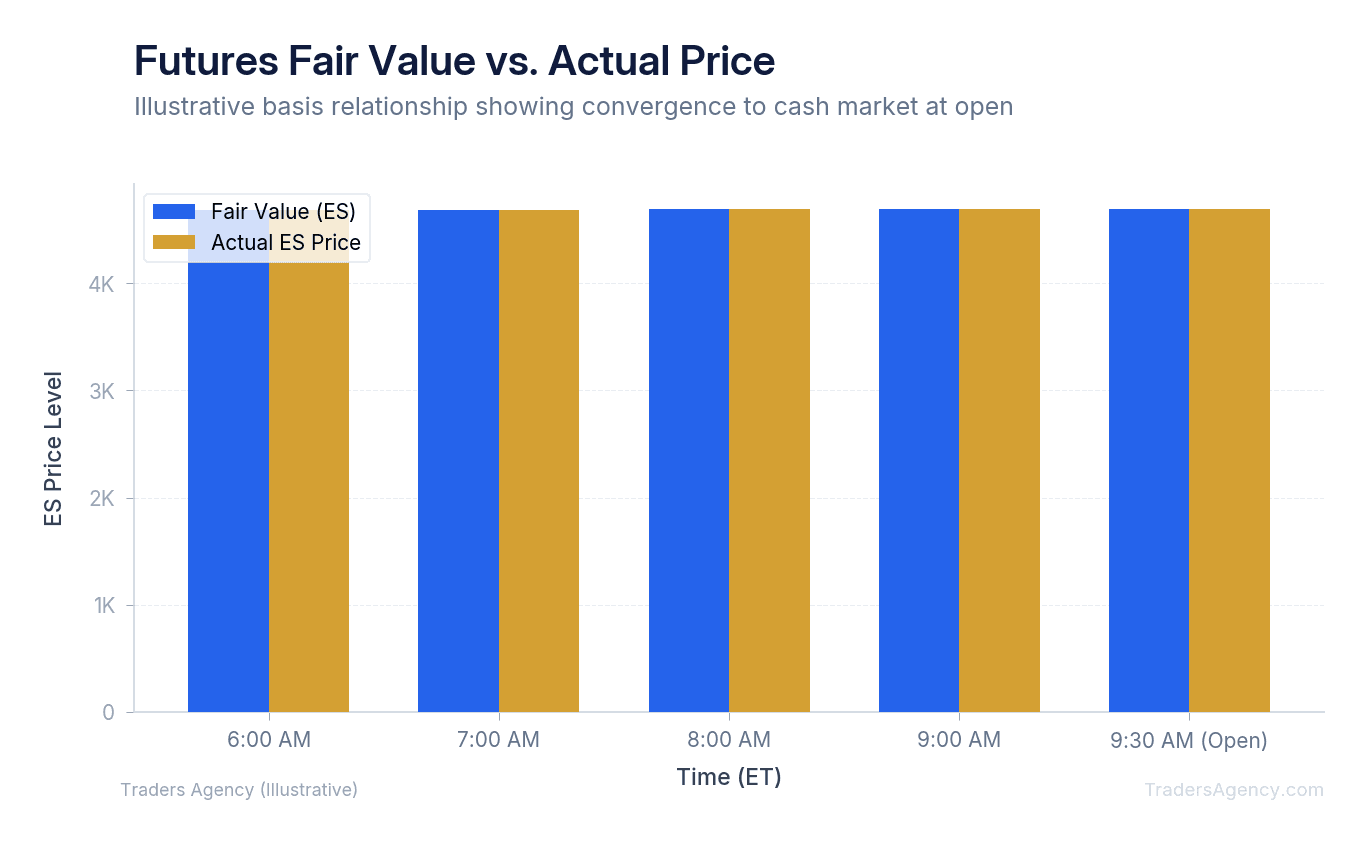
You calculate fair value by taking the cash index closing price, adding the cost of carry, and subtracting expected dividends. Comparing this fair value to the current futures price reveals the actual market sentiment, telling you if stocks are likely to open higher or lower.
Many traders simply look at the green or red percentage next to the futures ticker on their screen. This is a mistake. The raw futures price includes interest rates and dividends, which means it will naturally differ from the cash index price. You must calculate the premium or discount to fair value to get the true picture.
Here's a concrete example of how we do this. Say the S&P 500 cash index closed yesterday at 5,000.00:
- Check fair value data: Calculate the fair value for the ES contract at 5,010.00 (available from your broker or the CME Group website).
- Check the live ES price: At 8:30 AM Eastern, the ES is trading at 5,025.00.
- Subtract fair value from current price: 5,025.00 minus 5,010.00 equals a premium of +15.00 points.
- Interpret the result: Because the futures contract is trading 15 points above fair value, we expect the S&P 500 cash index to gap up at the open.
| Parameter | Value |
|---|---|
| S&P 500 Cash Close | 5,000.00 |
| ES Fair Value | 5,010.00 |
| Live ES Price (8:30 AM) | 5,025.00 |
| Premium to Fair Value | +15.00 points |
| Expected Open | Gap Up |
Reading Pre-Market Sentiment Using Futures Data
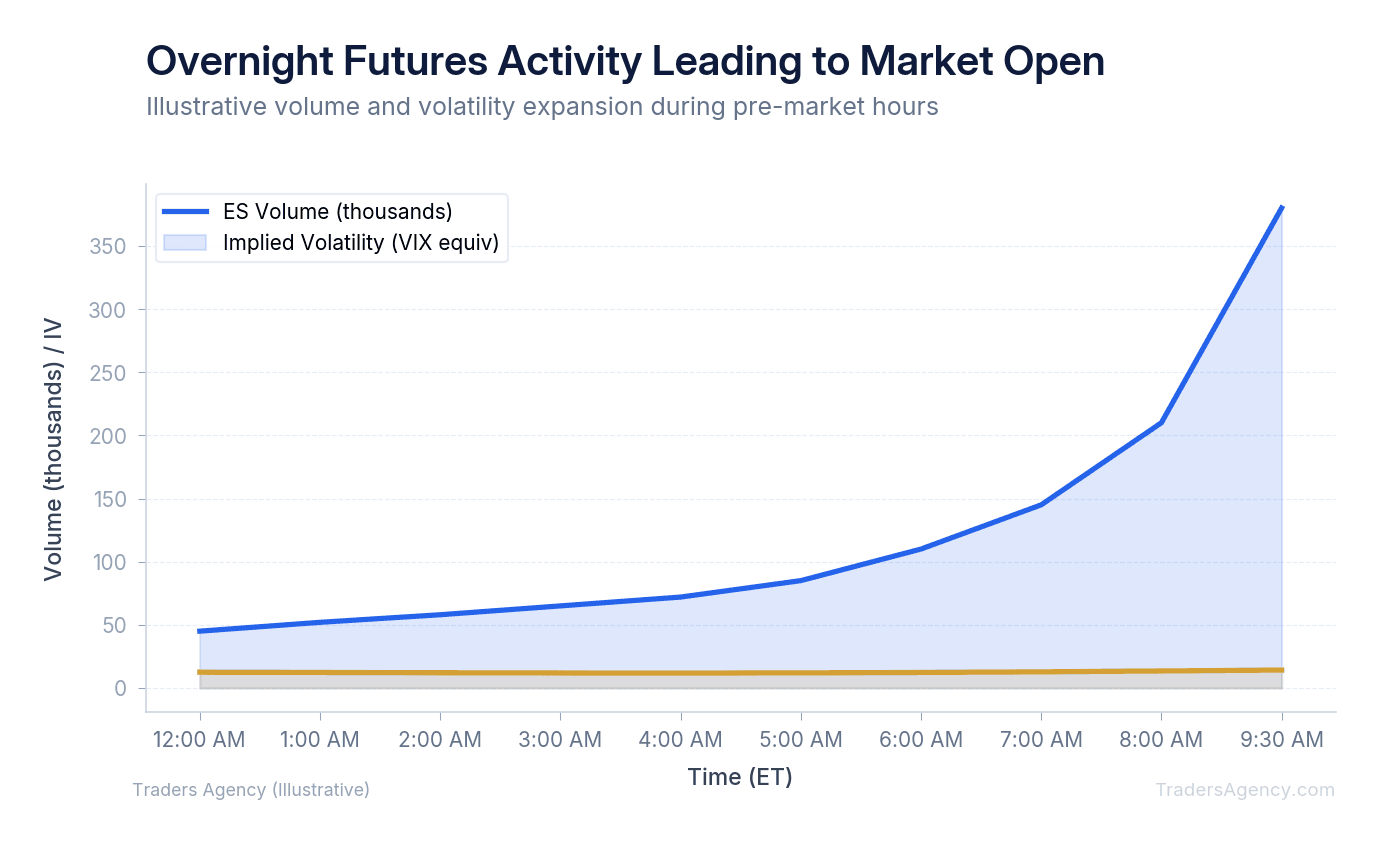
Price action alone is not enough. You must also read the volume and volatility in the pre-market session. Overnight trading is typically quiet, but volume spikes predictably around specific events.
The most common event is the 8:30 AM Eastern economic data release. Reports like the Consumer Price Index (CPI) or Non-Farm Payrolls (NFP) will cause massive volume spikes in the ES and NQ. We watch how the futures market reacts to this data. If a negative news event hits the wire and the ES drops 20 points but immediately recovers on high volume, we know buyers are aggressively stepping in.
Key Concept: Absorption of bad news is a highly bullish signal for the stock market open. When the market shrugs off negative data and recovers quickly on heavy volume, institutional buyers are telling you they want higher prices.
Want expert trading insights delivered daily?
Join thousands of traders who rely on Traders Agency for market analysis and trade ideas.
Join Traders AgencyWhat Is the 80% Rule in Futures Trading?
The 80% rule states that if the market opens outside the previous day's value area and then returns to trade within it for two consecutive 30-minute periods, there is an 80% probability it will fill the entire value area.
This is a statistical concept derived from Market Profile theory. The "value area" is the price range where 70% of the previous day's trading volume occurred. It represents the zone where buyers and sellers previously found fair pricing.
Here's how we teach our members to trade this setup:
- Identify yesterday's value area: Mark the value area high (VAH) at 4,150 and value area low (VAL) at 4,100.
- Observe the opening price: The market opens today at 4,160 (above the value area).
- Wait for re-entry confirmation: Watch the price drop back below 4,150 and stay there for two full 30-minute candles.
- Enter the trade: Open a short position near 4,145.
- Set your profit target: Target the value area low at 4,100.
- Place your stop loss: Set a hard stop just above the value area high at 4,155.
| Parameter | Value |
|---|---|
| Value Area High (VAH) | 4,150 |
| Value Area Low (VAL) | 4,100 |
| Entry Price | 4,145 |
| Stop Loss | 4,155 (10 points risk) |
| Profit Target | 4,100 (45 points reward) |
| Risk-to-Reward Ratio | 1:4.5 |
This provides an excellent risk-to-reward ratio. You're risking 10 points to potentially make 45 points. We often point to statistical models like the 80% rule because they rely on proven market mechanics rather than guesswork.
Building a Practical Futures Market Trading Strategy
Now we'll combine these concepts into a daily routine. The best futures trading strategies are repeatable and objective. Here is the exact process our team uses every morning:
Step 1: Check the Overnight Range
Open your charting platform at 8:00 AM Eastern. Mark the highest price and lowest price the ES traded at between 6:00 PM yesterday and 8:00 AM today. This overnight range acts as your initial support and resistance for the morning session.
Step 2: Calculate the Premium or Discount
Pull the fair value data from your broker or the CME Group website. Compare it to the live ES price. Determine if the market is trading at a premium (expecting a gap up) or a discount (expecting a gap down). Write this bias down on a physical notepad.
Step 3: Plan the Entry and Exit
If the market is gapping up heavily, do not buy blindly at the open. Wait for the first 15 minutes of trading to complete. We prefer to watch for a pullback to the overnight high. If the price tests that overnight high and holds, we enter a long position. We place our stop loss below the first 15-minute candle's low.
You can practice this routine using a paper trading account. Building your futures market trading strategy free of financial risk allows you to master the mechanics before committing real capital.
When Can You Actually Trust Futures Signals?
Not all futures signals are created equal. You must know when to trust the overnight action and when to ignore it entirely.
Mistake #1: Trusting low-volume overnight moves. If the ES drifts up 15 points on a Sunday night with almost zero volume, that move is highly suspect. Institutional algorithms can easily push the price around when liquidity is thin. We only trust overnight direction when it is backed by heavy volume, usually following a major news event or international market reaction.
Mistake #2: Ignoring the broader market context. If the daily chart of the S&P 500 is in a heavy downtrend, a +10 point gap up in the pre-market is likely a trap. Short sellers will use that morning pop to initiate new positions at better prices. Always align your pre-market futures bias with the higher timeframe trend.
Risk Warning: Never risk more than 1% to 2% of your total account equity on a single trade. If your account size is $10,000, your maximum loss on any setup should be strictly capped at $100 to $200. Futures contracts use heavy margin. A small move against you can result in significant losses if you do not use hard stop orders.
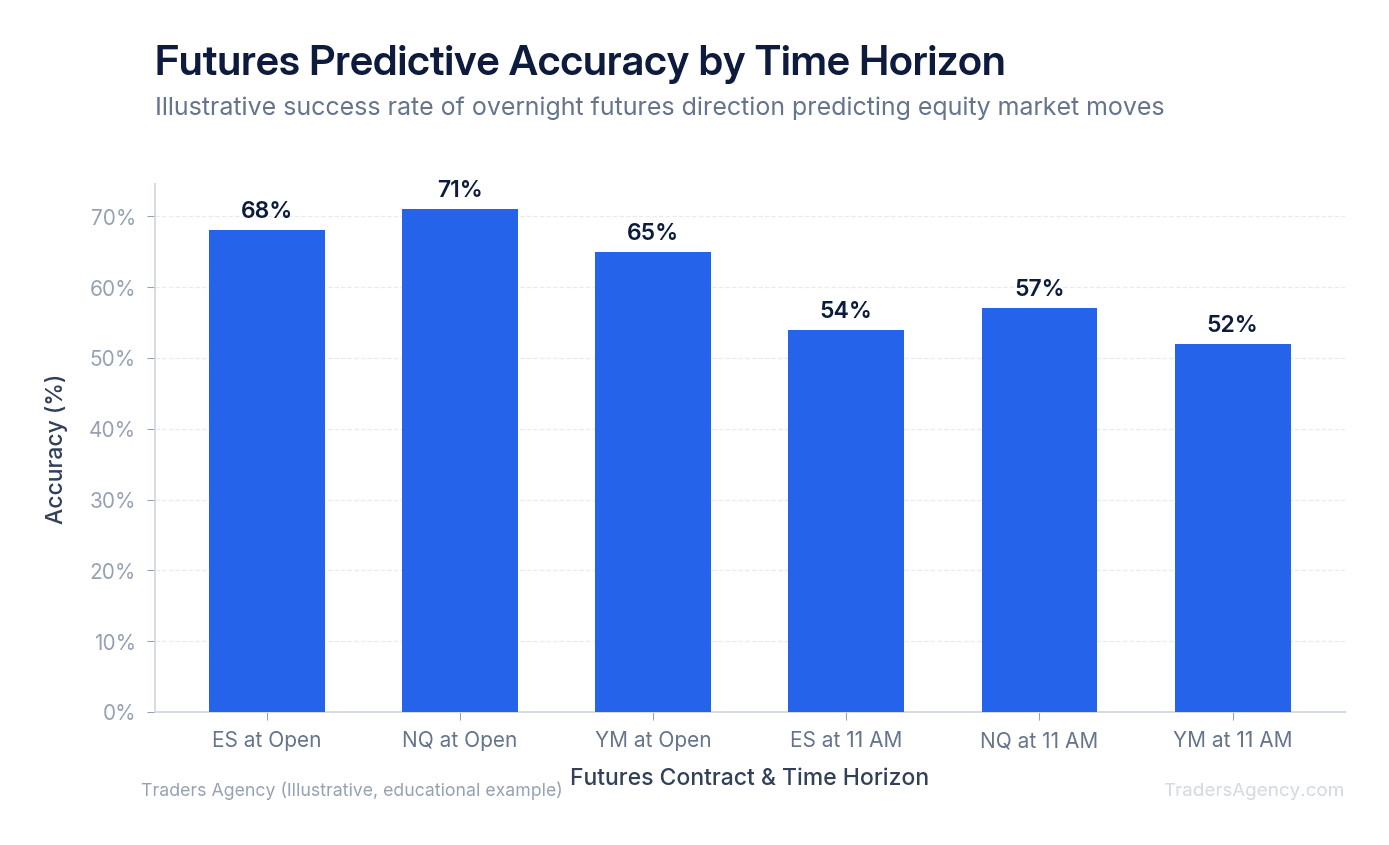
By tracking the ES, calculating fair value, and applying statistical models like the 80% rule, you can remove the emotion from your morning routine. The futures market tells you exactly what institutional money is doing. Your job is simply to listen, calculate the risk, and execute the plan.
Want expert trading insights delivered daily?
Join thousands of traders who rely on Traders Agency for market analysis and trade ideas.
Join Traders AgencyKey Takeaways
- Index futures like ES, NQ, and YM trade nearly 24 hours a day, pricing in overnight news before the stock market opens at 9:30 AM Eastern, giving futures readers an early read on institutional positioning.
- Calculating fair value before the open is a core step in this strategy. It tells you whether futures are trading at a premium or discount to the cash market, which helps filter out noise from genuine directional moves.
- The article references an '80% rule' applied to ES futures data as a statistical framework for removing emotion from the morning routine, though results are illustrative and educational rather than guaranteed.
- Pre-market volume in futures contracts matters as much as price level. Heavy overnight buying may suggest institutional positioning for a strong open, but the article qualifies this as a signal to interpret, not a certainty.
- Futures contracts use heavy margin, meaning a small adverse move can produce significant losses. The article specifically flags hard stop orders as a required risk control, not an optional one.
DISCLAIMER: Traders Agency does not offer financial advice. The information provided is for educational purposes only and should not be considered financial advice. Traders Agency is not responsible for any financial losses or consequences resulting from the use of the information provided. Trading carries inherent risks and may not be suitable for all individuals. You are advised to conduct your own research and seek personalized advice before making any investment decisions, recognizing the potential risks and rewards involved.
See more from Traders Agency on Google
Make us a preferred source and our market analysis will appear more prominently in your Google Search, Top Stories, and AI results.
Add to Preferred Sources



