Crypto technical analysis is the practice of studying price charts, trading volume, and momentum indicators to estimate where a cryptocurrency's price might move next. It runs on the same core principles as stock chart analysis, but crypto markets trade 24 hours a day, swing harder, and respond to forces like halving cycles that stocks never experience. By the end of this guide, you'll understand how crypto technical analysis works, why it behaves differently than equity analysis, and how to start applying it with real indicator settings.
You've probably seen this happen: Bitcoin drops 8% overnight while you're asleep, and by the time you check your phone at 7 a.m., the chart pattern you were watching the night before doesn't even look the same. That's the first lesson every new crypto trader learns the hard way. The tools might feel familiar if you've ever looked at a stock chart, but the market underneath them plays by a different set of rules.
We built this guide for traders who understand the basics of buying and selling but are new to reading crypto charts. We'll walk you through what crypto technical analysis actually is, how it differs from analyzing stocks, and how to use the most common indicators without getting overwhelmed.
Does Technical Analysis Work in Crypto?
Bottom Line: Crypto technical analysis relies on the same core tools as stock analysis, but traders need to account for 24/7 trading, sharper price swings, and halving cycles that don't exist in equity markets. The core lesson: indicators still capture real behavior, but their reliability is lower in crypto, so charts and signals should inform decisions rather than dictate them.
Yes, technical analysis works in crypto, but with meaningfully lower reliability than in traditional stock markets. Price patterns and indicators like RSI and moving averages still capture real trading behavior. Crypto's thinner liquidity, round-the-clock trading, and sentiment-driven swings simply mean signals fire more often and produce more false positives.
This is one of the most searched questions in the space, and for good reason. Traders coming from stocks expect the same indicator settings and chart patterns to behave identically. They often don't.
Crypto markets are younger, less regulated, and dominated by a mix of retail traders, algorithmic bots, and a smaller pool of large holders (often called "whales") who can move price with a single large order. That combination creates real technical patterns, but it also creates more noise. A head and shoulders pattern on a stock chart might play out cleanly over weeks. The same pattern on a mid-cap altcoin can invalidate in hours because one wallet decided to sell.
Here's our position: crypto technical analysis works well enough to be genuinely useful, especially for identifying trend direction and general entry zones, but it should never be your only tool. Pair it with basic fundamentals like network activity, exchange volume, and awareness of upcoming events such as a token unlock, a regulatory decision, or an exchange listing.
Key Concept: Technical analysis in crypto is a probability tool, not a prediction tool. It tells you where the odds tilt when several signals agree, not what price will do next.
Why Some Traders Say It Doesn't Work
- Lower liquidity on smaller coins makes charts easier to manipulate with large orders.
- News-driven volatility can override any pattern in minutes.
- Younger price history means fewer complete market cycles to test patterns against, compared to a stock like an S&P 500 component with decades of data.
Why Other Traders Say It Does
- Bitcoin and Ethereum now have over a decade of price history, enough for meaningful pattern recognition.
- High trading volume on major pairs (BTC/USD, ETH/USD) means indicators reflect genuine supply and demand rather than pure noise.
- Repeated behavioral patterns, like the tendency for retail traders to buy tops and panic-sell bottoms, show up reliably in the data.
How Does Crypto Technical Analysis Work?
Crypto technical analysis works by applying the same core tools used in stock trading (chart patterns, moving averages, volume, and momentum indicators) to cryptocurrency price data. The goal is to identify trends, spot reversals, and time entries and exits based on historical price behavior rather than a coin's underlying fundamentals.
At its core, technical analysis rests on three assumptions: price reflects all available information, price moves in trends, and history tends to repeat because human behavior repeats. Those assumptions were built for stock markets, but they translate reasonably well to crypto because the same emotional drivers (fear, greed, momentum chasing) show up in both.
Here's a simple analogy we use with newer traders. Think of a technical chart like a weather pattern. You can't predict the exact weather with certainty, but if you see dark clouds building and the barometric pressure dropping, you can reasonably expect rain. Technical analysis behaves the same way: it doesn't guarantee an outcome, but it stacks probability in your favor when multiple signals line up.
Core Building Blocks
Most crypto technical analysis strategies rely on five pieces:
- Price charts – usually candlestick charts showing the open, high, low, and close for a given time period.
- Support and resistance levels – price zones where buying or selling pressure has historically shown up.
- Trend lines – drawn along swing highs or lows to visualize direction.
- Volume – how much of the asset traded during a given period, confirming or contradicting a price move.
- Indicators – mathematical formulas applied to price and volume, like RSI or MACD.
If you're just getting started, a free crypto technical analysis tool like TradingView's basic charting package or an exchange's built-in chart is enough to practice all five of these concepts without spending anything.
Want expert trading insights delivered daily?
Join thousands of traders who rely on Traders Agency for market analysis and trade ideas.
Join Traders AgencyWhy Is Crypto Technical Analysis Different From Stocks?
Crypto technical analysis differs from stock analysis mainly because crypto markets trade continuously with no closing bell, experience sharper volatility swings, and respond to sentiment and on-chain data in ways equities rarely do. That changes how you read gaps, set indicator thresholds, and interpret volume.
1. No Market Close Means No Gaps
Stock traders are used to overnight gaps: a stock closes at $50, bad earnings news drops overnight, and it opens the next morning at $44. That $6 gap becomes its own technical signal, often called a "gap fill" setup.
Crypto doesn't really have this. Bitcoin trades every hour of every day, every day of the year. Instead of a gap, a big overnight move just shows up as a steep candle on your chart. Gap-fill strategies common in stock trading mostly don't apply here, so traders lean more on trendlines and volume spikes to catch these moves in real time rather than waiting for a market open.
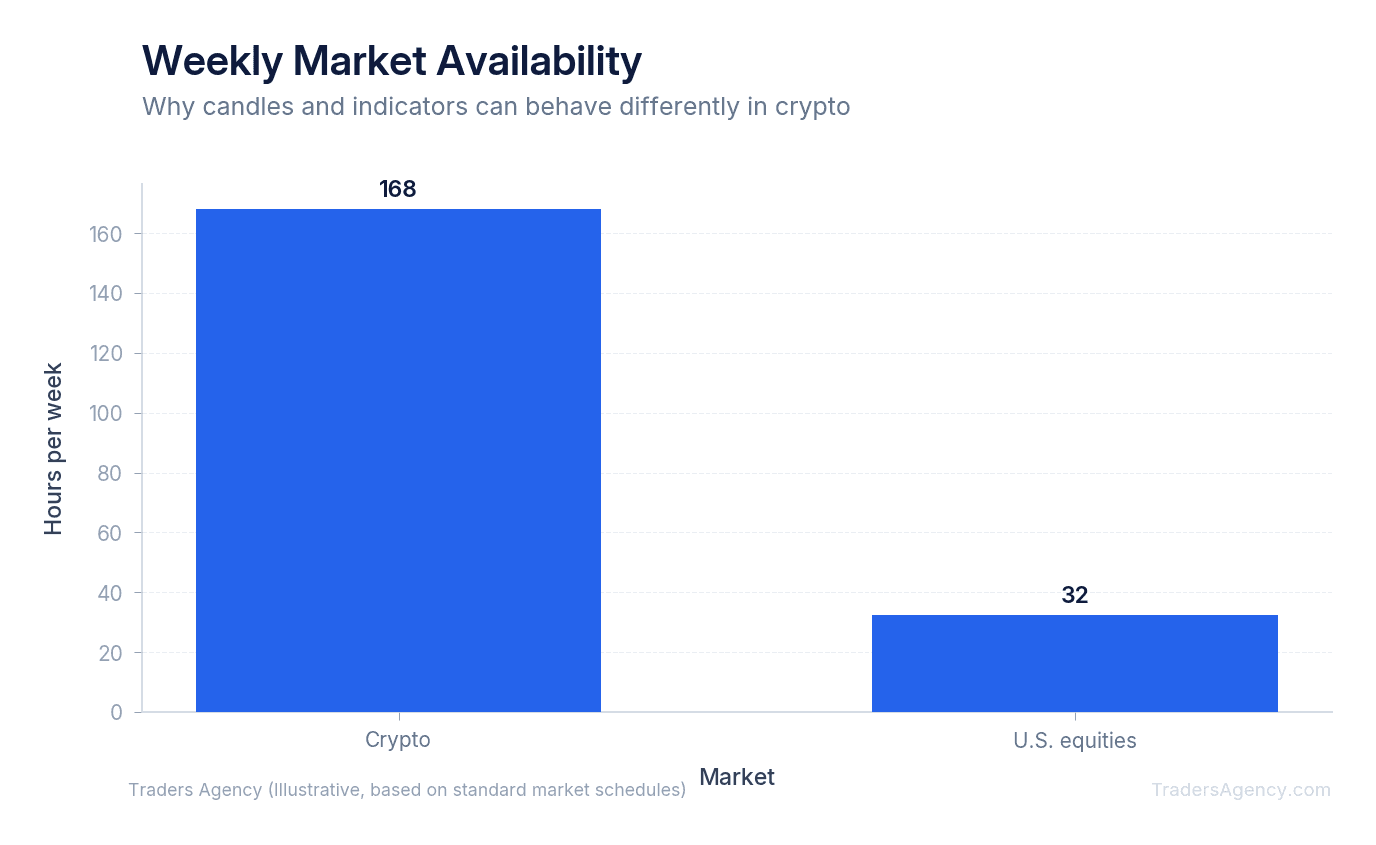
The chart above shows why this matters. U.S. equities trade roughly 32.5 hours a week during regular sessions, while crypto trades close to 168 hours a week. That's more than five times the trading activity to monitor, and it's a big reason many crypto traders rely on price alerts and automated tools instead of watching charts manually all day.
2. Volatility Changes Your Indicator Settings
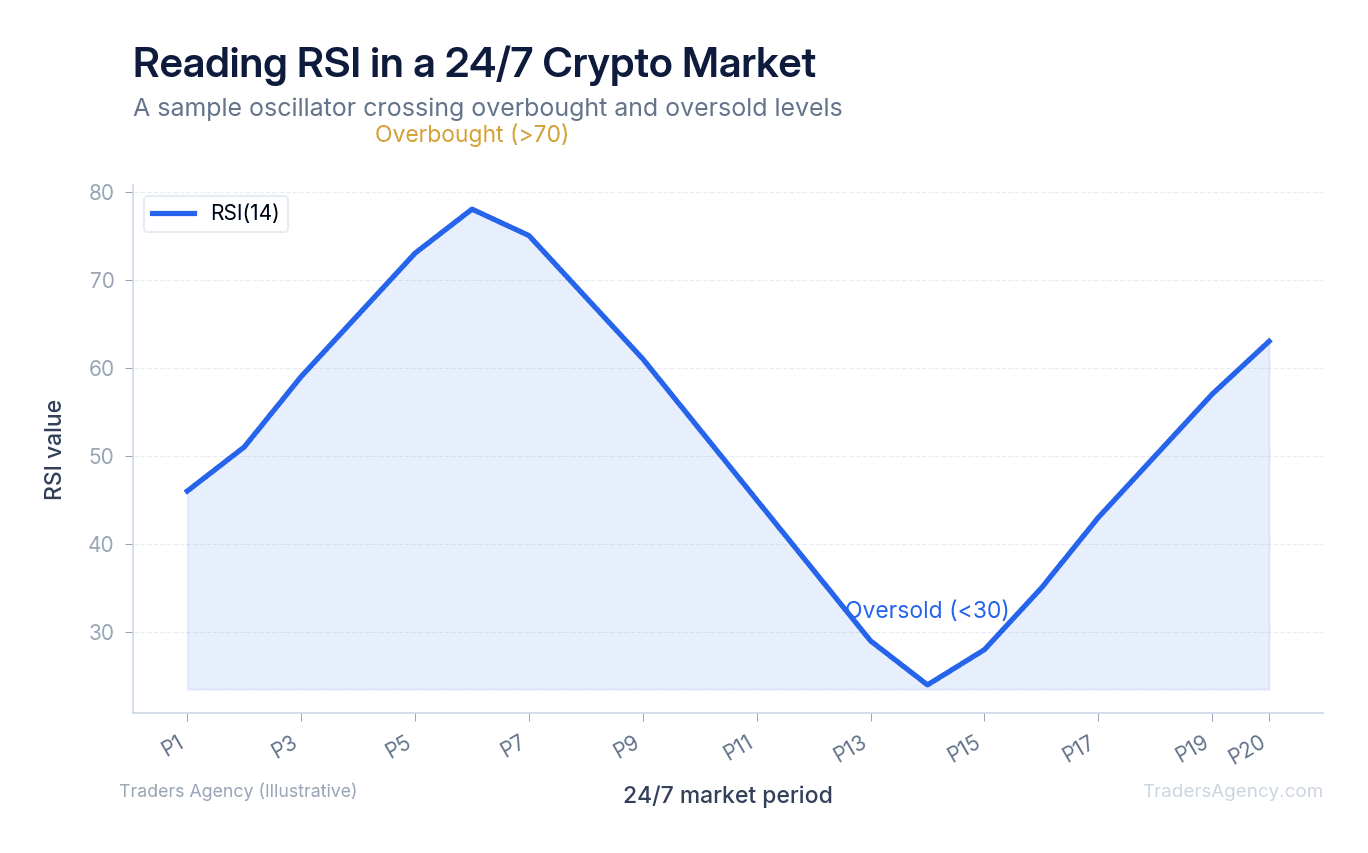
A 14-period RSI (Relative Strength Index, an indicator measuring the speed and size of recent price changes on a scale of 0 to 100) is standard for stocks. In crypto, that same 14-period setting can generate far more false signals because daily price swings of 5% to 10% are common, compared to 1% to 2% for a typical large-cap stock.
Many crypto traders widen their RSI thresholds from the traditional 30 (oversold) and 70 (overbought) to bands like 20 and 80, simply because crypto spends more time at extremes.
3. Sentiment Carries More Weight
In stock markets, technical analysis is often paired with fundamentals like earnings and revenue. In crypto, there are no earnings reports. Instead, social sentiment (Twitter/X mentions, Reddit activity, Google search trends) acts almost like a technical indicator itself, because retail sentiment moves crypto prices faster and more directly than it moves most stocks.
How Do Halving Cycles Affect Bitcoin Price Patterns?
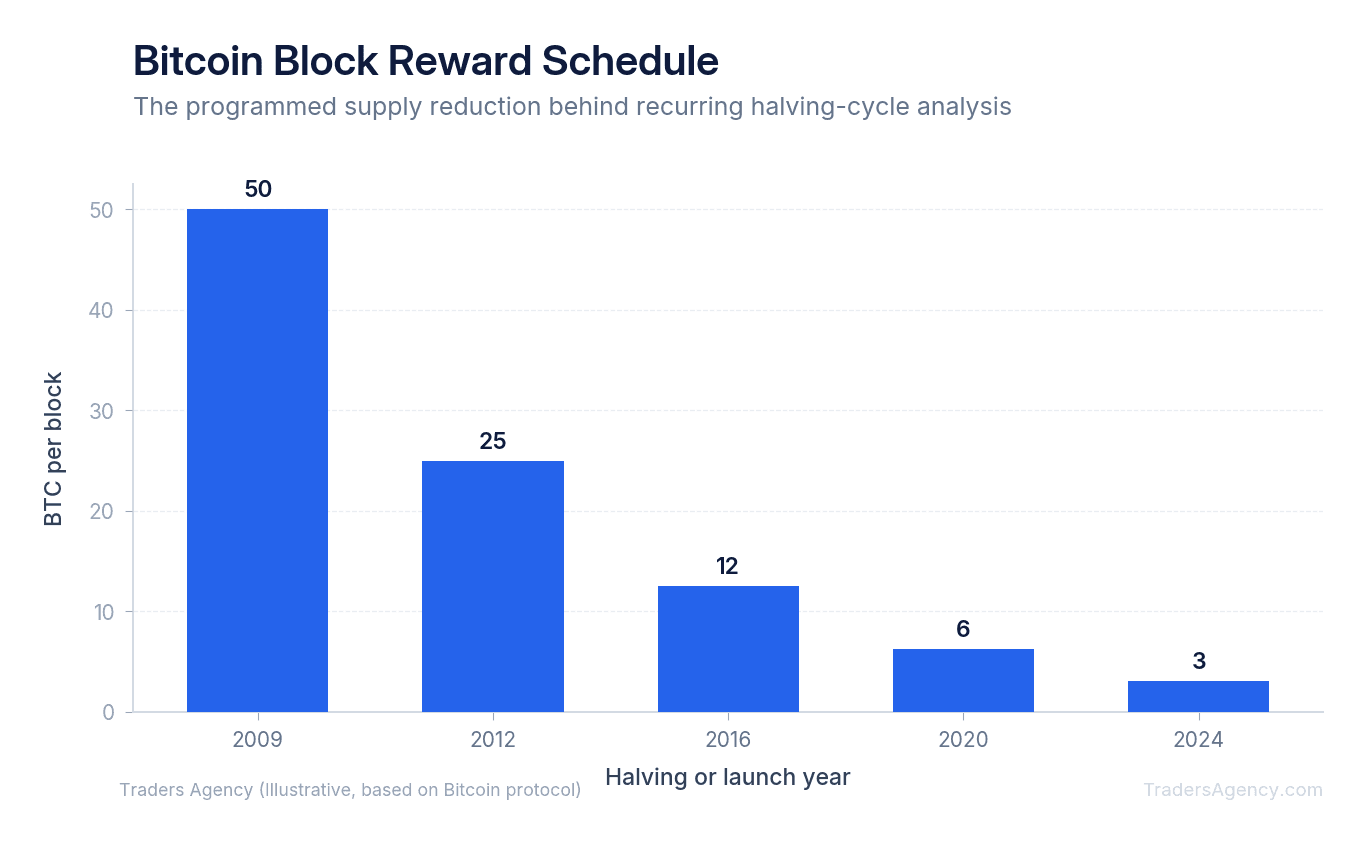
Bitcoin has a built-in supply mechanism that stock traders never deal with: the halving. Roughly every four years, the reward miners receive for confirming transactions is cut in half, reducing the rate at which new Bitcoin enters circulation.
This matters for crypto technical analysis because halvings have historically preceded major bull market cycles, even though the relationship between halvings and price is not guaranteed to repeat. In 2009, the block reward was 50 BTC per block. After the most recent halving in 2024, it dropped to 3.125 BTC.
Why Traders Watch This
Halving cycles are one of the clearest examples of a crypto-specific pattern with no direct equivalent in stock trading. Here's what our team watches around each cycle:
- Hash rate trends – the total computing power securing the network tends to dip briefly after a halving as less efficient miners drop off, then recover as the network adjusts.
- Historical post-halving price action – strength has shown up in the 12 to 18 months following each event, though past cycles are a small sample size and shouldn't be treated as a guarantee.
- On-chain supply metrics – how much Bitcoin is held on exchanges versus in long-term wallets often shifts alongside halving cycles.
Watch Out: Four halvings to date is not a large enough dataset to call this a reliable predictive pattern. Treat it as useful context layered onto your technical analysis, never as a standalone trading signal.
How Can You Use Crypto Trading Indicators?
You use crypto trading indicators by applying them to a specific timeframe and asset, then waiting for multiple indicators to agree before acting. No single indicator should trigger a trade on its own, especially in a market as volatile as crypto.
Step-by-Step: RSI and Moving Average Combo
Here's a simple, beginner-friendly setup using two of the most common indicators.
- Step 1: Build the Setup – Pull up BTC/USD on a 4-hour chart (each candle represents four hours of trading). Add a 14-period RSI and a 50-period Simple Moving Average (SMA).
- Step 2: Wait for Confirmation – Look for RSI to drop below 30, suggesting the asset may be oversold, while price trades near or just above the 50-period SMA, suggesting the broader trend hasn't broken down.
- Step 3: Define Your Risk Before Entering – Identify the recent swing low and place your stop below it. Write down your entry, stop, and target before you click buy, not after.
- Step 4: Manage the Position – Let the trade work toward the prior resistance zone. If price closes decisively below the SMA, your thesis is invalidated and the stop does its job.
Hypothetical Example
Say BTC is trading at $61,000. RSI drops to 27, and price is sitting just above the 50-period SMA at $60,200. A trader following this setup might enter a long position at $61,000, place a stop loss at $58,500 (roughly 4% below entry, under the recent swing low), and set a target near $65,000, where the asset previously found resistance.
| Parameter | Value |
|---|---|
| Asset | BTC/USD on the 4-hour chart |
| Signal | RSI at 27, price above 50-SMA at $60,200 |
| Entry | $61,000 |
| Stop Loss | $58,500 (max risk roughly 4%) |
| Target | $65,000 (potential reward roughly 6.5%) |
| Risk-to-Reward | approximately 1:1.6 |
| Scenario | What Happens | Result |
|---|---|---|
| Best Case | BTC reverses off the oversold RSI reading and holds the SMA as support | Climbs to the $65,000 target |
| Worst Case | BTC breaks below the SMA and momentum keeps sliding | Stop triggers, loss capped near 4% |
| Most Likely | BTC chops sideways before resolving in either direction | Patience and a clear invalidation point matter more than being right immediately |
This example is illustrative only and not a specific trade recommendation. Actual entries, exits, and outcomes depend on real-time conditions.
What Different Types of Indicators Are There?
There are four broad categories of indicators used in crypto technical analysis: trend, momentum, volume, and volatility. Each answers a different question about price behavior.
1. Trend Indicators
These help you identify the overall direction of price.
- Simple Moving Average (SMA): the average closing price over a set number of periods
- Exponential Moving Average (EMA): similar to SMA, but weights recent prices more heavily
- MACD (Moving Average Convergence Divergence): compares two EMAs to signal trend shifts
2. Momentum Indicators
These measure the speed of price movement, helping identify overbought or oversold conditions.
- RSI (Relative Strength Index): a 0 to 100 scale, with readings above 70 often considered overbought and below 30 considered oversold
- Stochastic Oscillator: compares closing price to the price range over a set period
3. Volume Indicators
These confirm whether a price move has real conviction behind it.
- On-Balance Volume (OBV): a running total that adds volume on up days and subtracts it on down days
- Volume Weighted Average Price (VWAP): average price weighted by volume, often used by intraday traders
4. Volatility Indicators
These measure how much price is moving, regardless of direction.
- Bollinger Bands: bands set a certain number of standard deviations above and below a moving average
- Average True Range (ATR): measures the average price range over a set period, useful for sizing stop losses
Key Concept: Start with one indicator from each of the four categories. Stacking ten indicators usually just repeats the same information and creates false confidence.
If you're building your own approach, a solid crypto technical analysis book or a foundational crypto technical analysis PDF covering these four categories will give you more depth than trying to learn every indicator at once.
When Should You Use Crypto Technical Analysis?
Crypto technical analysis works best in markets with reasonable liquidity, like BTC, ETH, and other large-cap coins, and during periods of clear trending price action rather than choppy, low-volume conditions. It's far less reliable on small-cap tokens with thin order books, where a handful of large trades can distort every indicator on your screen.
When It Fits Well
- Trading major pairs with high daily volume
- Identifying general trend direction across multiple timeframes
- Setting stop losses and targets based on support, resistance, and ATR
- Confirming or questioning a fundamental thesis, since technical weakness can be a warning sign even if you believe in a project long-term
Common Mistakes to Avoid
- Over-optimizing indicator settings on past data until they "work perfectly," then watching them fail going forward (a trap called curve-fitting)
- Ignoring volume and trading purely off price patterns
- Using stock-market gap strategies on a market that rarely gaps
- Treating every dip as a buying opportunity without confirming trend direction first
Fitting It Into a Broader Portfolio
Crypto technical analysis should be one tool among several if you're treating digital assets as part of a diversified portfolio alongside stocks, bonds, or precious metals. Crypto has shown periods of both high and low correlation with equity markets, meaning it doesn't always deliver the diversification benefit some investors expect.
For exposure, traders generally choose between three vehicles:
| Vehicle | What It Is | Consideration |
|---|---|---|
| Direct ownership | Buying and holding BTC, ETH, or other coins on an exchange or in a personal wallet | Full custody responsibility |
| Crypto ETFs | Exchange-traded funds tracking crypto prices without direct custody | Trades on regular equity hours |
| Futures contracts | Agreements to buy or sell crypto at a future date, used for hedging or leveraged exposure | Requires tighter risk management (see CME Group for contract specs) |
Each vehicle carries a different risk profile, and technical analysis can be applied to all three. Futures and highly leveraged positions demand the tightest risk controls given how quickly crypto can move.
Risk Management Basics
- Never risk more than a small percentage of your total account. Many traders use 1% to 2% per trade as a starting guideline.
- Always define your stop loss before entering, not after.
- Size positions based on volatility: a more volatile coin warrants a smaller position than a stable one for the same dollar risk.
- Don't let daily crypto analysis today headlines replace your own chart review.
Watch Out: Crypto's 24/7 schedule means your position can move sharply while you sleep. If you can't monitor a trade, define the stop loss on the exchange itself rather than keeping it in your head.
Frequently Asked Questions
Does technical analysis work in crypto?
Yes, though less reliably than in stocks due to lower liquidity on smaller coins and heavier sentiment-driven swings. It works best on major pairs like BTC/USD and ETH/USD.
Why is crypto crashing today?
Sharp price drops typically stem from a mix of factors: broad risk-off sentiment in financial markets, large sell orders from major holders, regulatory news, or exchange-specific issues. Checking volume and news alongside your chart helps clarify the likely cause.
What does Warren Buffett say about technical analysis?
Buffett has publicly favored fundamental, value-based investing over chart-based trading and has been skeptical of cryptocurrency as an investment in general, preferring businesses with intrinsic value he can analyze.
Who is the richest BTC owner?
Bitcoin's pseudonymous creator, known as Satoshi Nakamoto, is widely believed to hold the largest known amount of BTC, though that wallet has remained largely untouched since Bitcoin's early years.
What's the best crypto technical analysis website for beginners?
Platforms like TradingView offer free charting tools with all the major indicators covered in this guide, making them a solid starting point before considering paid tools or a crypto technical analysis AI assistant.
Should I use a crypto technical analysis AI tool?
AI-assisted charting tools can flag patterns faster than scanning manually, but they should support your decision-making, not replace your understanding of the indicators behind their signals.
Is there a reliable free crypto technical analysis option?
Yes. Most major exchanges provide built-in charting with standard indicators like RSI, MACD, and moving averages at no added cost.
Our education team publishes new strategy guides and market analysis every week.
Want expert trading insights delivered daily?
Join thousands of traders who rely on Traders Agency for market analysis and trade ideas.
Join Traders AgencyKey Takeaways
- Technical analysis works in crypto, but with meaningfully lower reliability than in traditional stock markets, even though indicators like RSI and moving averages still capture real trading behavior.
- Crypto markets trade 24 hours a day and swing harder than stocks, which means chart patterns can look completely different by the time you check them again, unlike equities that pause overnight.
- Halving cycles create price-moving forces in crypto that stocks never experience, making them a factor unique to crypto technical analysis.
- Most major exchanges offer free built-in charting with standard indicators like RSI, MACD, and moving averages, so reliable crypto technical analysis doesn't require paid tools.
- AI-assisted charting tools can flag patterns faster than manual scanning, but they should support a trader's decision-making rather than replace an understanding of the indicators behind their signals.
DISCLAIMER: Traders Agency does not offer financial advice. The information provided is for educational purposes only and should not be considered financial advice. Traders Agency is not responsible for any financial losses or consequences resulting from the use of the information provided. Trading carries inherent risks and may not be suitable for all individuals. You are advised to conduct your own research and seek personalized advice before making any investment decisions, recognizing the potential risks and rewards involved.
See more from Traders Agency on Google
Make us a preferred source and our market analysis will appear more prominently in your Google Search, Top Stories, and AI results.
Add to Preferred Sources