You have probably watched a company report record earnings, only to see its stock price plummet the next day. We see traders get burned by this constantly. They buy based on a shiny net income number, completely unaware that the company is actually bleeding cash behind the scenes. Our team recommends looking past the headline earnings to find the real truth about a company's financial health. Earnings can be manipulated through accounting tricks, but cash in the bank is a hard fact. When you learn to track the cash, you gain a massive advantage over the average retail trader.
In this guide, we will show you exactly how to apply free cash flow (FCF) analysis to your own portfolio. We will teach you how to calculate the metric, how to screen for high-quality setups, and how to protect your capital from common value traps. By the end of this article, you will have a practical framework for evaluating any stock based on its true cash-generating power.
What Is Free Cash Flow and Why Does It Matter?
Bottom Line: Free cash flow cuts through the noise of reported earnings by showing you the actual money a business generates after operations and capital expenditures. The practical edge here is combining FCF analysis with disciplined position sizing: finding high-quality cash flow setups means nothing if you blow up your account holding a losing trade because the fundamentals looked cheap. Master the metric, set your stops, and let the math do the work.
Free cash flow (FCF) is the money a company has left over after paying for its day-to-day operations and maintaining its capital assets. Unlike reported earnings, which can be manipulated through accounting rules, free cash flow represents actual, spendable money in the bank.
Think of net income as your gross salary. It looks great on paper, but it does not reflect your actual spending power. Free cash flow is the money left in your checking account after paying your mortgage, buying groceries, and fixing your car. It is the discretionary cash you can actually use to build wealth.
For a publicly traded company, this discretionary cash is essential. A business uses free cash flow to pay dividends, buy back shares, acquire competitors, or pay down debt. Without it, a company must issue new shares or borrow money just to survive.
Key Concept: The free cash flow formula is simple: Operating Cash Flow minus Capital Expenditures. You can find both numbers on a company's Statement of Cash Flows, which is publicly available in their SEC filings.
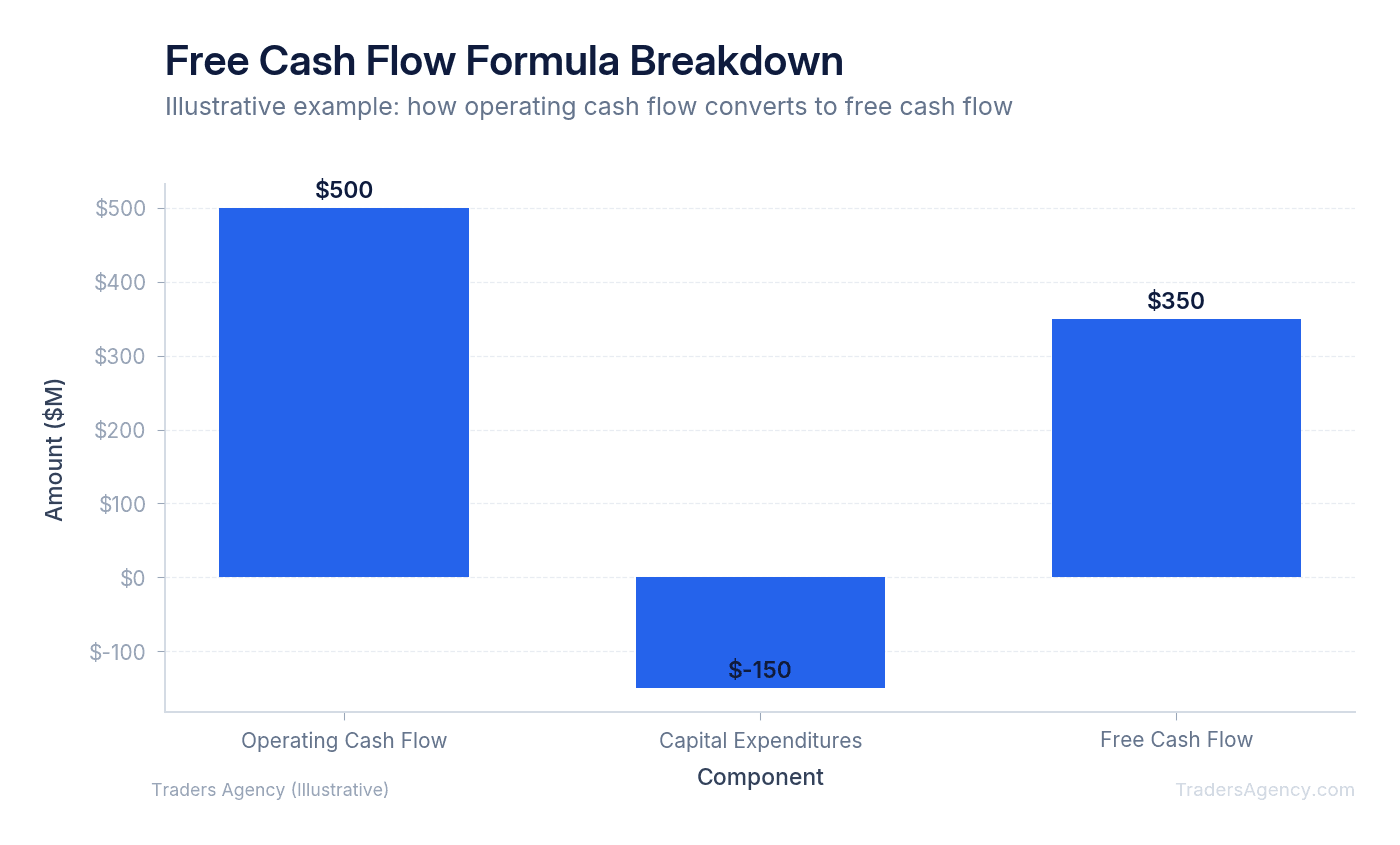
Here is a concrete example. Imagine Company A reports $500 million in operating cash flow. During that same year, they spend $150 million on new equipment and facility upgrades, which are their capital expenditures. Their free cash flow is $350 million. This is the actual cash they generated that can be returned to shareholders.
| Component | Amount |
|---|---|
| Operating Cash Flow | $500 million |
| Capital Expenditures (CapEx) | -$150 million |
| Free Cash Flow | $350 million |
Why Is Free Cash Flow Harder to Fake Than Earnings?
Free cash flow is harder to fake than earnings because it tracks actual cash entering and leaving a bank account. Earnings rely on accrual accounting, allowing companies to recognize revenue before receiving cash or delay expenses, which can artificially inflate profits on paper.
Under Generally Accepted Accounting Principles (GAAP), a company can book a sale as revenue the moment a contract is signed. They might not receive the actual cash for six months. On the income statement, earnings look fantastic. On the cash flow statement, the reality is clear: the money has not arrived yet.
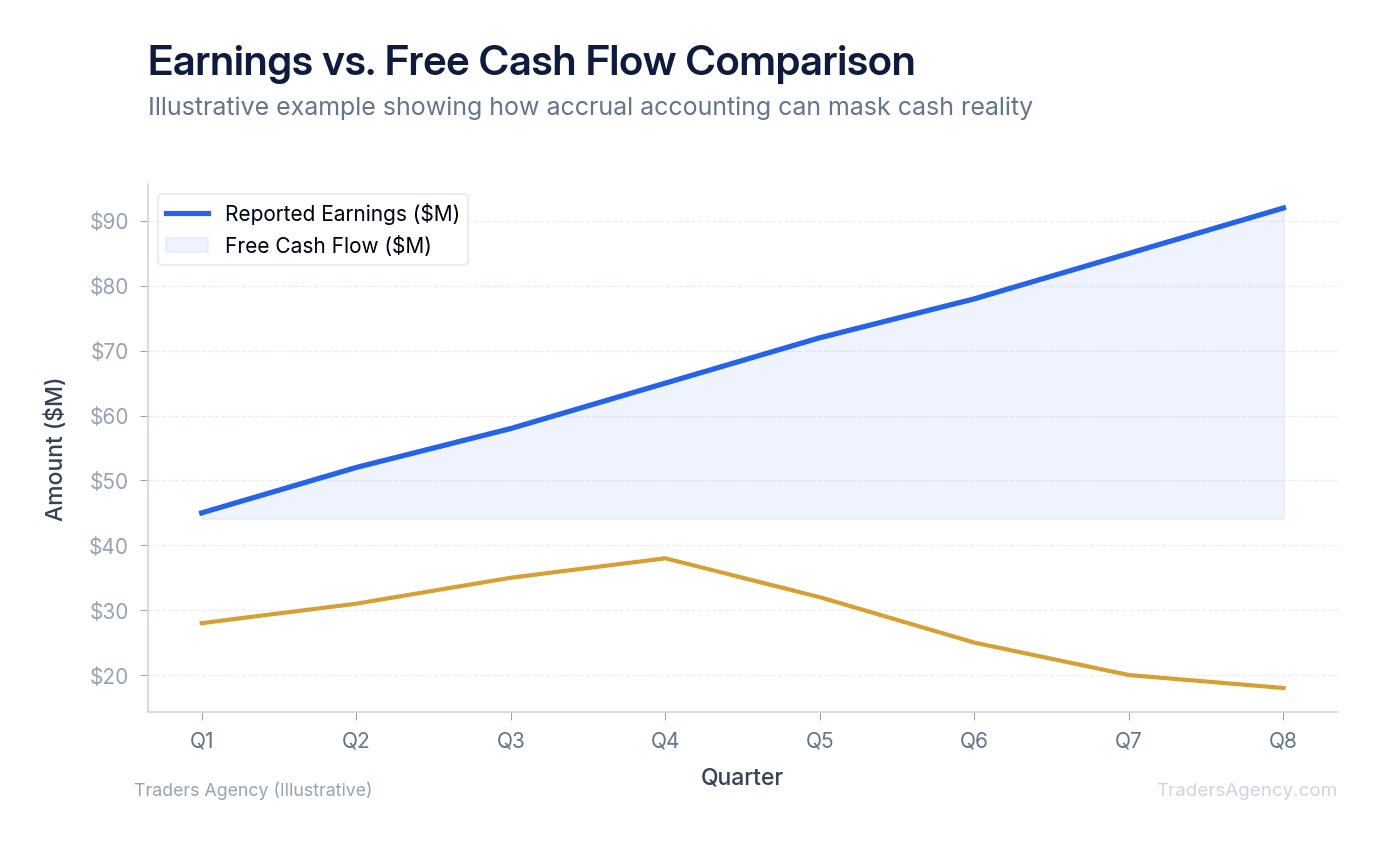
We teach our members to watch for a specific red flag: a growing gap between net income and free cash flow. If a company reports $2 billion in net income but only $200 million in free cash flow, something is wrong. They might be aggressively recognizing revenue, or they might be sinking massive amounts of cash into unsustainable capital projects.
Watch Out: When net income is climbing but free cash flow is flat or declining, treat it as a warning sign. The earnings may look healthy on paper, but the actual cash tells a very different story. Always compare both numbers side by side before entering a position.
When you base your trades on cash flow, you bypass the creative accounting. You are looking at the raw, unfiltered financial engine of the business.
What Is a Good Free Cash Flow Percentage?
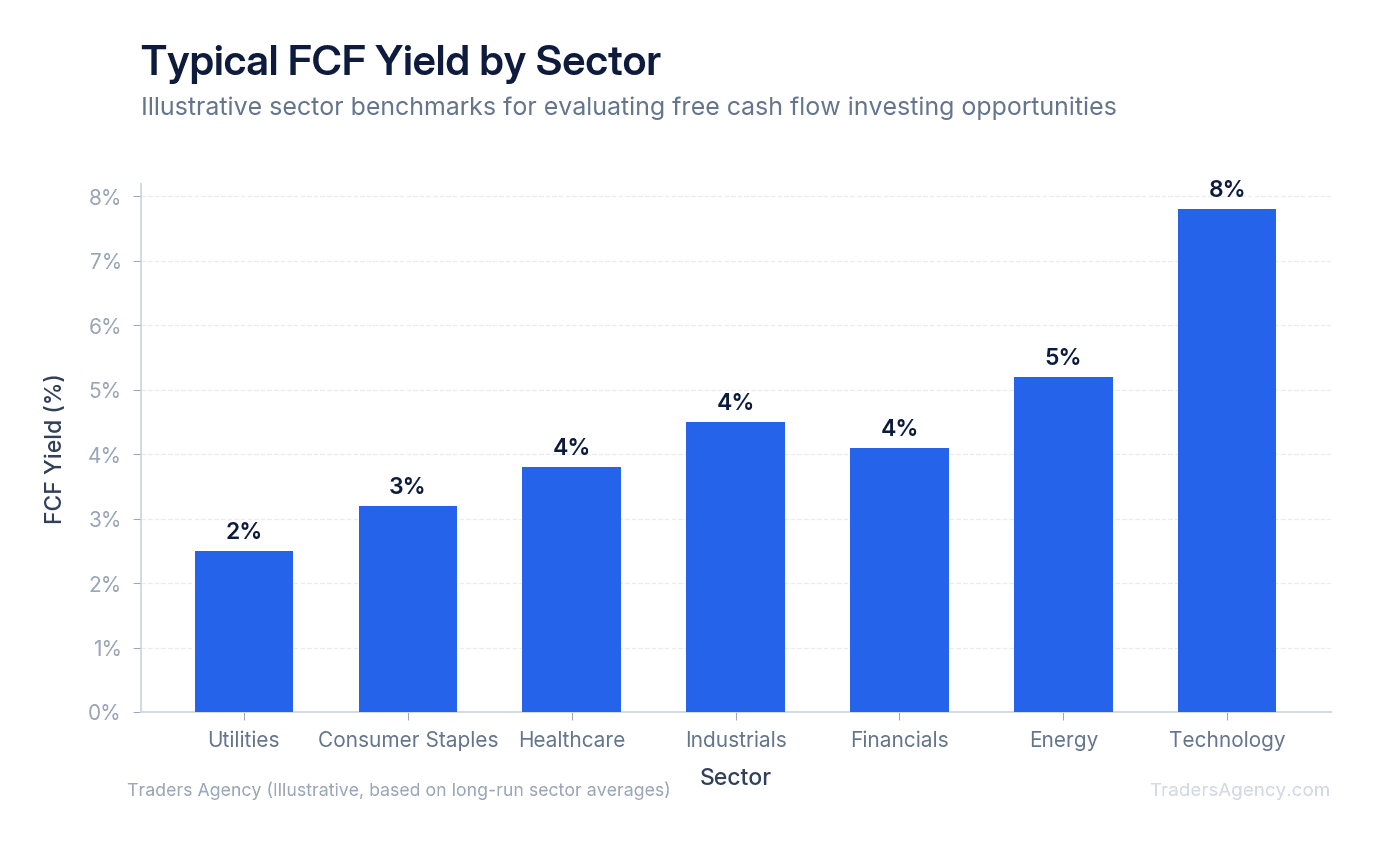
A good free cash flow percentage, or FCF yield, typically ranges from 4% to 8%, but this varies heavily by industry. Capital-intensive sectors like utilities might consider 2% to 4% excellent, while asset-light technology companies often target yields between 6% and 8%.
To calculate the FCF yield, you divide the free cash flow per share by the current share price. Alternatively, you can divide the total free cash flow by the company's total market capitalization. This percentage tells you how much cash the company generates relative to its valuation.
If a stock trades at $100 per share and generates $5 per share in free cash flow, the FCF yield is 5%. We prefer to view this yield as the theoretical return you would get if the company paid out 100% of its cash as a dividend.
You cannot compare the yield of a software company to a railroad company. Railroads must spend billions constantly laying new track and maintaining locomotives. Software companies build a product once and sell it infinitely with minimal physical costs.
Here are the general benchmarks our team uses:
| Sector | Strong FCF Yield Range |
|---|---|
| Technology and Software | 5% to 8% |
| Consumer Staples | 4% to 6% |
| Industrials and Manufacturing | 3% to 5% |
| Utilities and Telecom | 2% to 4% |
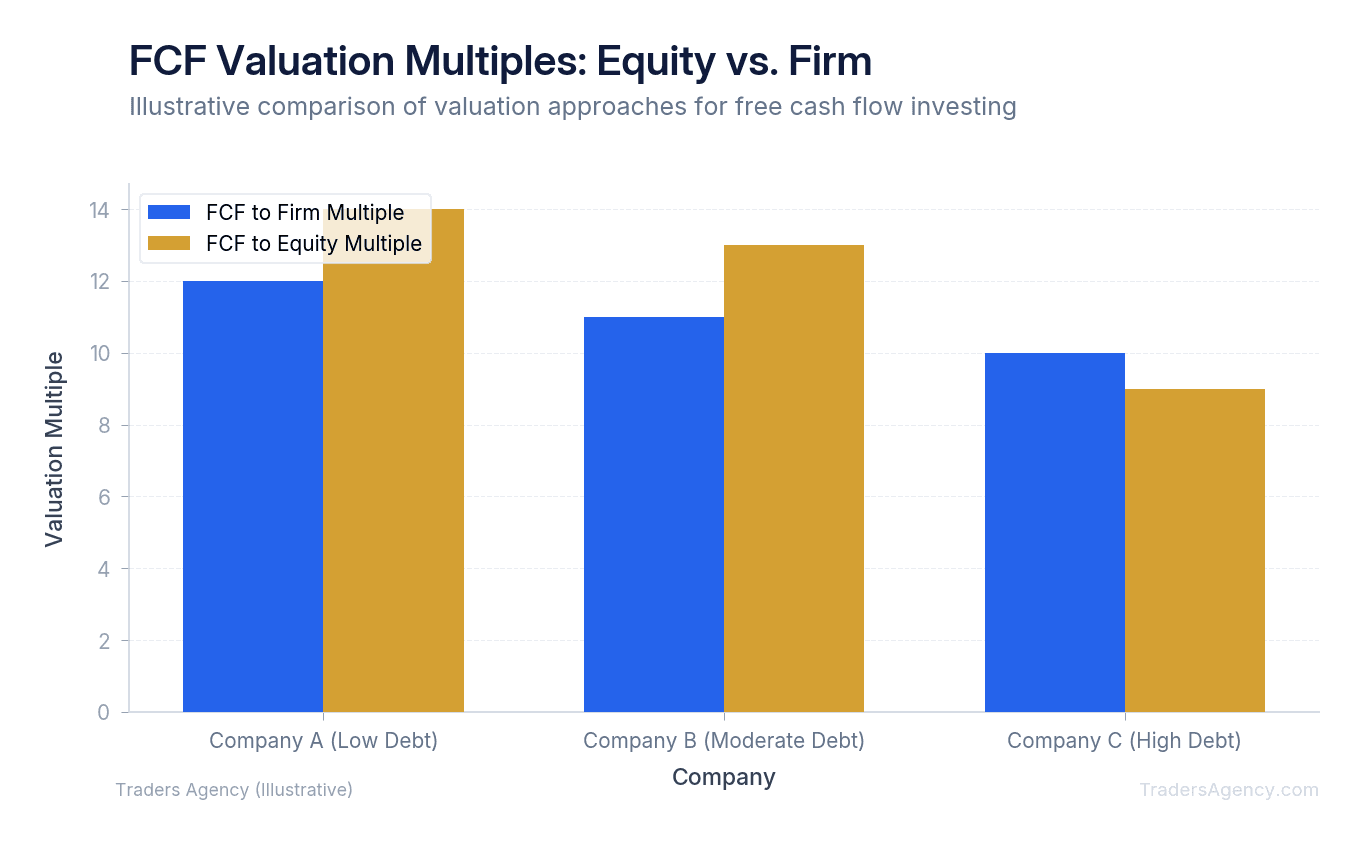
What Is the Difference Between FCF to Firm and FCF to Equity?
Free Cash Flow to Firm (FCFF) measures the cash available to all investors, including debt holders, before debt payments are made. Free Cash Flow to Equity (FCFE) measures the cash available strictly to shareholders after all debt obligations and interest have been paid.
Understanding this distinction is a core part of free cash flow investing. If you are evaluating a company with zero debt, FCFF and FCFE are essentially the same number. However, most publicly traded companies carry significant debt loads.
FCFF gives you a picture of the entire business operation. It tells you how much cash the core business generates regardless of how management chose to finance it. We use FCFF when comparing two companies in the same sector that have vastly different debt structures.
FCFE is the number that matters most to retail stock traders. This is the cash left over specifically for you, the equity shareholder. If a company generates massive FCFF but has to use 90% of it to pay interest on high-yield bonds, the FCFE will be tiny. As a stock investor, you only benefit from the FCFE.
Key Concept: Use FCFF when comparing companies with different debt levels. Use FCFE when deciding whether a stock is worth buying for your portfolio. FCFE is the cash that actually belongs to you as a shareholder.
Want expert trading insights delivered daily?
Join thousands of traders who rely on Traders Agency for market analysis and trade ideas.
Join Traders AgencyHow Do You Use Free Cash Flow to Make an Investment Decision?
When we evaluate a new trade setup, we use free cash flow to verify the safety of a company's dividend and to identify potential undervaluation. A high dividend yield is useless if the company does not generate enough cash to pay it.
Here is a practical scenario. You find a stock paying a massive 8% dividend yield. The financial media is hyping it up as a great income play. Before buying, you check the cash flow statement.
The company pays out $400 million annually in dividends, but their free cash flow is only $200 million. This means they are borrowing money or selling assets just to pay the dividend. We call this a dividend trap. A cut is almost certainly coming, and the stock price will crash when it happens.
Conversely, if a company pays out $100 million in dividends but generates $500 million in free cash flow, that dividend is incredibly safe. They have plenty of room to increase the payout, buy back shares, or weather an economic downturn. This is the exact type of setup we look for.
| Scenario | Annual Dividends Paid | Free Cash Flow | Verdict |
|---|---|---|---|
| Dividend Trap | $400 million | $200 million | Avoid. Payout exceeds cash generation. |
| Safe Dividend | $100 million | $500 million | Strong. Ample cash cushion for growth. |
How Do You Screen for High FCF Yield Stocks?
You do not need an expensive terminal to find these setups. We teach our members to use free tools like Finviz or Macrotrends to filter the entire stock market in minutes. Here is our exact process for finding cash-rich companies.
- Set Your Market Cap Floor: Open your preferred stock screener and start by filtering out micro-cap stocks that carry too much volatility and liquidity risk. Set the Market Capitalization filter to over $2 billion. This ensures you are only looking at established mid-cap and large-cap companies.
- Require a Dividend: Next, ensure the company is actually returning some of that cash to shareholders. Set the Dividend Yield filter to over 2%. This immediately removes companies that hoard cash without rewarding investors.
- Apply Cash Flow Filters: Look for the metric called Price to Free Cash Flow (P/FCF). This is simply the inverse of the FCF yield. A P/FCF of 20 equals a 5% yield. A P/FCF of 10 equals a 10% yield. Set the Price to Free Cash Flow filter to under 15. This ensures you are demanding a minimum FCF yield of roughly 6.7%. Finally, add a filter for positive earnings growth over the past year to ensure the underlying business is not shrinking.
- Narrow the List Manually: This screen will typically reduce a universe of 8,000 stocks down to a manageable list of 30 to 50 candidates. From here, you must do the manual work. You cannot just blindly buy the list.
- Find Your Technical Entry: Open the charts for the remaining stocks and look for technical entry points. We want to buy these cash-rich companies when they are pulling back to major support levels, such as the 200-day moving average. Combining strong fundamental cash flow with precise technical entries is how you build a winning system.
| Screening Filter | Setting | Purpose |
|---|---|---|
| Market Capitalization | Over $2 billion | Eliminates volatile micro-caps |
| Dividend Yield | Over 2% | Ensures cash is returned to shareholders |
| Price to Free Cash Flow | Under 15 | Targets a minimum ~6.7% FCF yield |
| Earnings Growth (1 Year) | Positive | Confirms the business is not shrinking |
Is High Free Cash Flow Always a Good Sign?
High free cash flow is generally good because it indicates a company has excess cash to pay dividends, buy back stock, or reduce debt. However, exceptionally high FCF can sometimes be a red flag if a company is severely underinvesting in its future growth to artificially boost short-term cash.
This is a common trap that catches novice traders. Remember the formula: Operating Cash Flow minus CapEx. If a management team wants to make their free cash flow look amazing this year, they can simply slash their CapEx to zero.
They stop upgrading their software. They stop maintaining their factories. They fire their research and development teams. In the short term, free cash flow skyrockets because expenses plummeted. The stock might even rally.
However, this is a slow death sentence for the business. Within a few years, their products will be obsolete, their factories will break down, and competitors will crush them. We always check the CapEx trend over the last five years. If CapEx is dropping rapidly while FCF is rising, we stay away. We want companies that generate massive cash while still heavily investing in their own future.
Watch Out: A sudden spike in free cash flow paired with a sharp decline in capital expenditures is a warning sign, not a buying signal. Always verify that FCF growth is coming from a stronger business, not from slashing the investments that keep the company competitive.
Risk Management and Position Sizing
Even the best free cash flow investing strategy requires strict risk management. A company with a fantastic cash flow profile can still suffer a massive stock price decline due to macroeconomic factors, sector rotation, or unexpected lawsuits. Fundamentals tell you what to buy, but risk management keeps you in the game.
Our team enforces strict position sizing rules. We never allocate more than 5% of our total account equity to a single stock, regardless of how attractive the FCF yield appears. If you have a $100,000 portfolio, your maximum position on any single cash-flow play should be $5,000.
We also always use hard stop losses. A strong balance sheet does not prevent a stock from entering a technical downtrend. If we buy a stock at $50 because we love its 7% FCF yield, we will still place a stop loss at $42 if that breaks a major technical support level.
| Risk Rule | Our Guideline |
|---|---|
| Max Position Size | 5% of total account equity |
| Stop Loss Placement | Below the nearest major technical support level |
| Example: $100K Account | Max $5,000 per position |
| Example: Entry at $50 | Stop loss at $42 (16% risk per share) |
Do not hold onto a losing trade just because the fundamentals look cheap. The market can remain irrational longer than you can remain solvent. Take the small loss, preserve your capital, and look for the next high-quality cash flow setup.
By combining the hard truth of free cash flow with disciplined technical execution, you remove the guesswork from your trading. You stop relying on manipulated earnings reports and start trading based on the actual money flowing through the business. Keep your position sizes small, verify the cash flow trends, and let the math work in your favor.
Want expert trading insights delivered daily?
Join thousands of traders who rely on Traders Agency for market analysis and trade ideas.
Join Traders AgencyKey Takeaways
- Net income can be manipulated through accounting rules, but free cash flow reflects actual spendable money, making it a more reliable measure of a company's financial health.
- FCF to Firm measures cash available to all capital providers (debt and equity holders), while FCF to Equity isolates what belongs specifically to shareholders after debt obligations are met.
- A high FCF yield stock screener filters out companies that look cheap on earnings but are quietly burning through cash, helping you avoid classic value traps.
- Position sizing discipline matters as much as stock selection: the article recommends capping risk per share (referenced at 6%) to protect capital when a trade moves against you even on a fundamentally strong name.
- The market can stay irrational longer than you can stay solvent, so a losing FCF-backed trade still requires a hard stop loss rather than a 'hold and hope' approach.
DISCLAIMER: Traders Agency does not offer financial advice. The information provided is for educational purposes only and should not be considered financial advice. Traders Agency is not responsible for any financial losses or consequences resulting from the use of the information provided. Trading carries inherent risks and may not be suitable for all individuals. You are advised to conduct your own research and seek personalized advice before making any investment decisions, recognizing the potential risks and rewards involved.
See more from Traders Agency on Google
Make us a preferred source and our market analysis will appear more prominently in your Google Search, Top Stories, and AI results.
Add to Preferred Sources