
The debt-to-equity ratio is a fundamental financial metric that compares a company's total liabilities to its shareholder equity. It shows exactly how much a business relies on borrowed money versus owned funds to finance its operations. You have probably seen a stock look like a great value, only to watch the company struggle with loan payments months later. This metric helps you spot those hidden dangers before you risk your capital.
Many new traders focus entirely on stock prices and completely ignore the corporate balance sheet. That is a dangerous habit. If a company relies entirely on borrowed money, a single bad quarter can push them toward bankruptcy.
We will walk you through how to read this metric so you can identify financially healthy companies and avoid dangerous debt traps. By the end of this guide, you will know how to calculate this ratio, find the data, and apply it to your own stock analysis.
What Is the Debt-to-Equity Ratio?
Bottom Line: The debt-to-equity ratio is one of the clearest early warning signs of financial stress that most retail traders overlook entirely. Knowing how to read it, benchmark it against the right sector, and size your positions accordingly gives you a real edge before a company's debt load shows up in the stock price. Use it as one layer of a broader analysis, not a standalone buy or sell signal.
The debt-to-equity ratio is a financial health indicator that measures the degree to which a company finances its operations through debt versus wholly owned funds. It tells investors if a business is taking on too much risk to grow. A higher ratio means more creditor financing and higher risk.
Think of this concept like buying a house. If you put down $20,000 in cash and take out an $80,000 mortgage, you are using a lot of debt to fund that asset. Companies do the exact same thing to build factories, hire workers, or buy inventory. They can either use their own cash, or they can borrow it from a bank.
Key Concept: The debt-to-equity ratio measures how much of a company's funding comes from borrowed money compared to money the owners have invested. A higher number means more debt relative to equity, which means more financial risk.
Our team recommends looking at this metric before buying any long-term stock. It reveals the hidden risks on a corporate balance sheet. When a business uses too much debt, they are obligated to make massive interest payments regardless of how well their sales are doing.
If sales drop, those fixed loan payments do not disappear. This creates a dangerous scenario where a company might have to sell off assets or issue new shares just to survive.
How Do You Calculate the Debt-to-Equity Ratio?
You calculate the debt-to-equity ratio by dividing a company's total liabilities by its total shareholder equity. Both of these numbers are located on the company's official balance sheet. The resulting number shows the proportion of debt used for every dollar of equity.
The formula looks like this: Debt-to-Equity Ratio = Total Liabilities / Shareholder Equity.
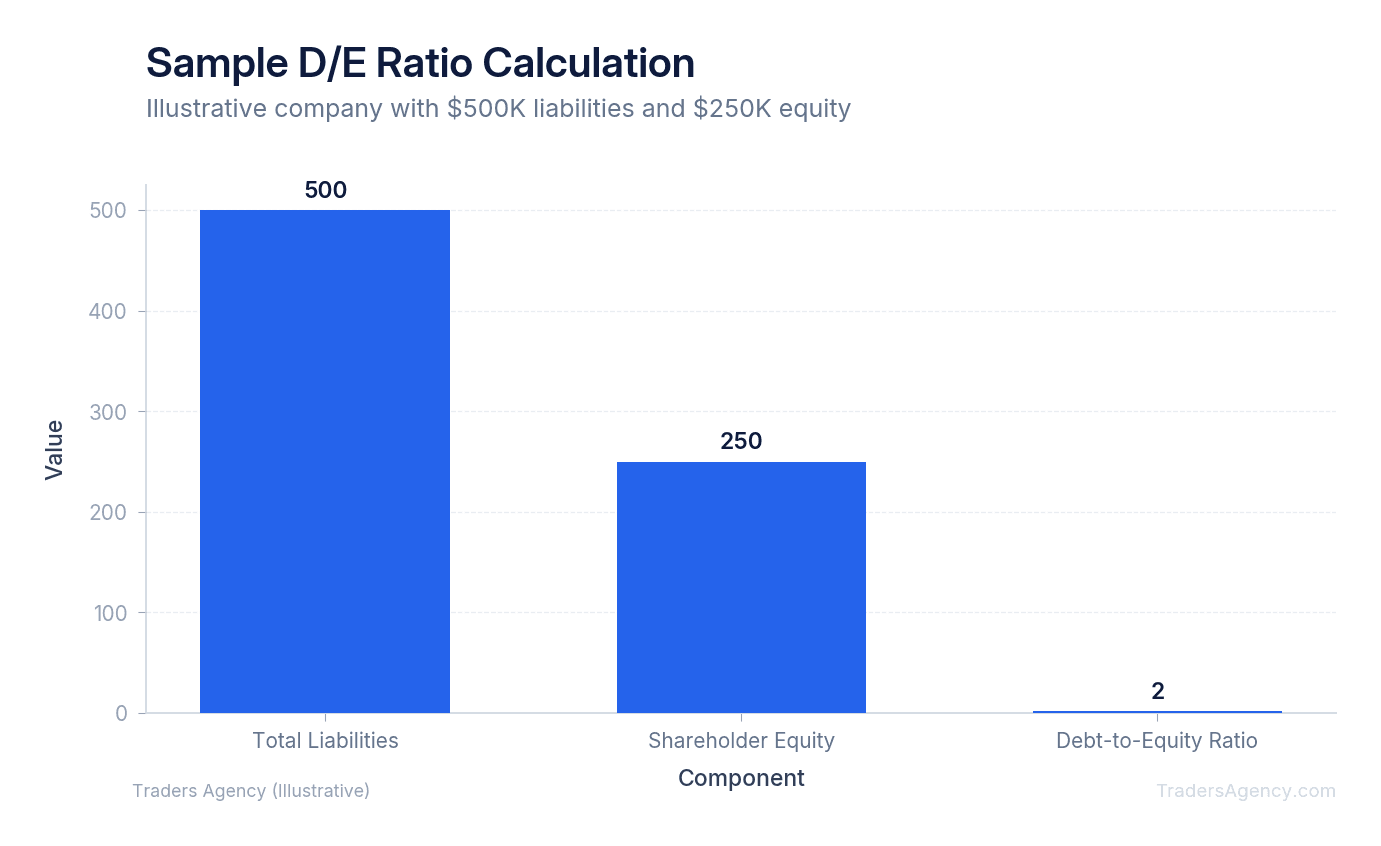
Here is a concrete example. Imagine you are analyzing a fictional manufacturing company called BuildCorp. You pull up their latest balance sheet and find the following numbers.
- Locate total liabilities: BuildCorp has $500,000 in total debt, including short-term loans and long-term bonds.
- Locate shareholder equity: BuildCorp has $250,000 in total equity, which is the net worth of the company belonging to the owners.
- Divide the liabilities by the equity: $500,000 / $250,000 = 2.0.
| Parameter | Value |
|---|---|
| Total Liabilities | $500,000 |
| Shareholder Equity | $250,000 |
| Debt-to-Equity Ratio | 2.0 |
| Interpretation | For every $1 of equity, the company has $2 of debt |
Now, imagine BuildCorp has a great year and pays off $250,000 of their loans. Their liabilities drop to $250,000. If their equity stays at $250,000, their new ratio is 1.0. The company has significantly reduced its financial risk.
What Is a Good Debt-to-Equity Ratio?
A good debt-to-equity ratio typically falls between 1.0 and 1.5 for most standard industries. A ratio of 1.0 means the company uses equal parts debt and equity to fund its business. Ratios above 2.0 generally indicate higher risk, while ratios below 1.0 suggest conservative financial management.
However, "good" is highly relative to the specific business model. We prefer to evaluate this metric based on how the company actually operates. A capital-intensive business requires heavy machinery and massive factories, so they naturally carry more debt.
If you see a ratio of 0.5, the company is playing it safe. They have half as much debt as they do equity. This provides a massive cushion if revenues suddenly drop.
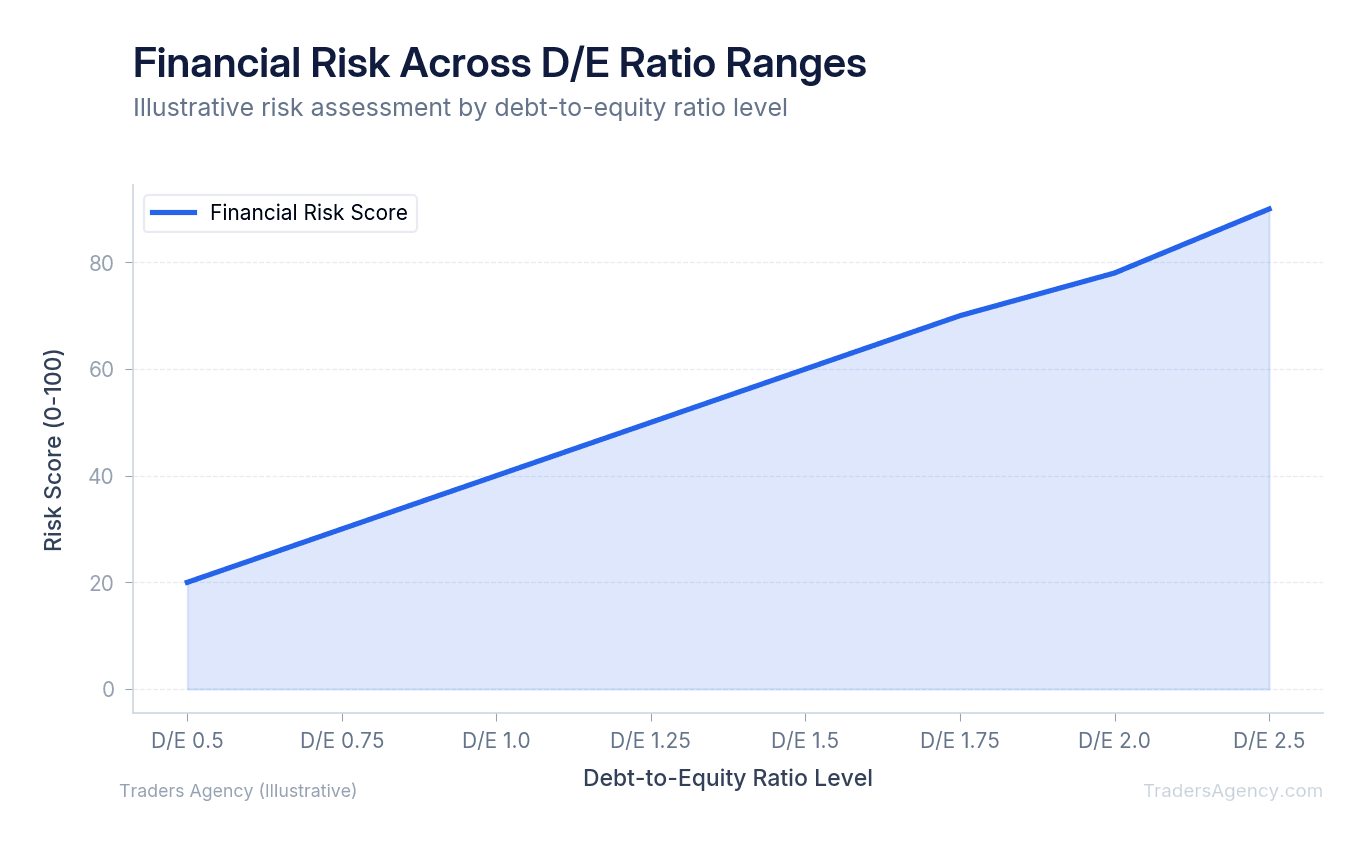
Conversely, aggressive management teams might push their ratio up to 2.5 to fund rapid expansion. This can lead to massive stock gains during economic booms. But when a recession hits, those aggressive companies are usually the first to face bankruptcy rumors.
Watch Out: A low debt-to-equity ratio does not automatically mean a stock is a good buy. It simply means the company carries less financial risk from debt. You still need to evaluate revenue growth, profitability, and technical chart patterns before committing capital.
How Does the D/E Ratio Benchmark Differ by Sector?
You cannot compare an internet software company to a national bank. Different industries have entirely different capital requirements. Comparing a debt-to-equity ratio by sector is the only way to get an accurate picture of financial health.
Here is what we teach our members about typical sector benchmarks:
| Sector | Typical D/E Range | Why |
|---|---|---|
| Technology | 0.1 – 0.5 | Software companies do not need physical factories to scale their products |
| Industrials | 1.5 – 2.0 | Buying airplanes and building assembly lines requires massive upfront loans |
| Utilities | 1.5 – 2.5 | Highly predictable revenue streams make banks willing to lend more safely |
| Financials | 2.5 – 3.0+ | Banks borrow money from depositors to lend it out to others |
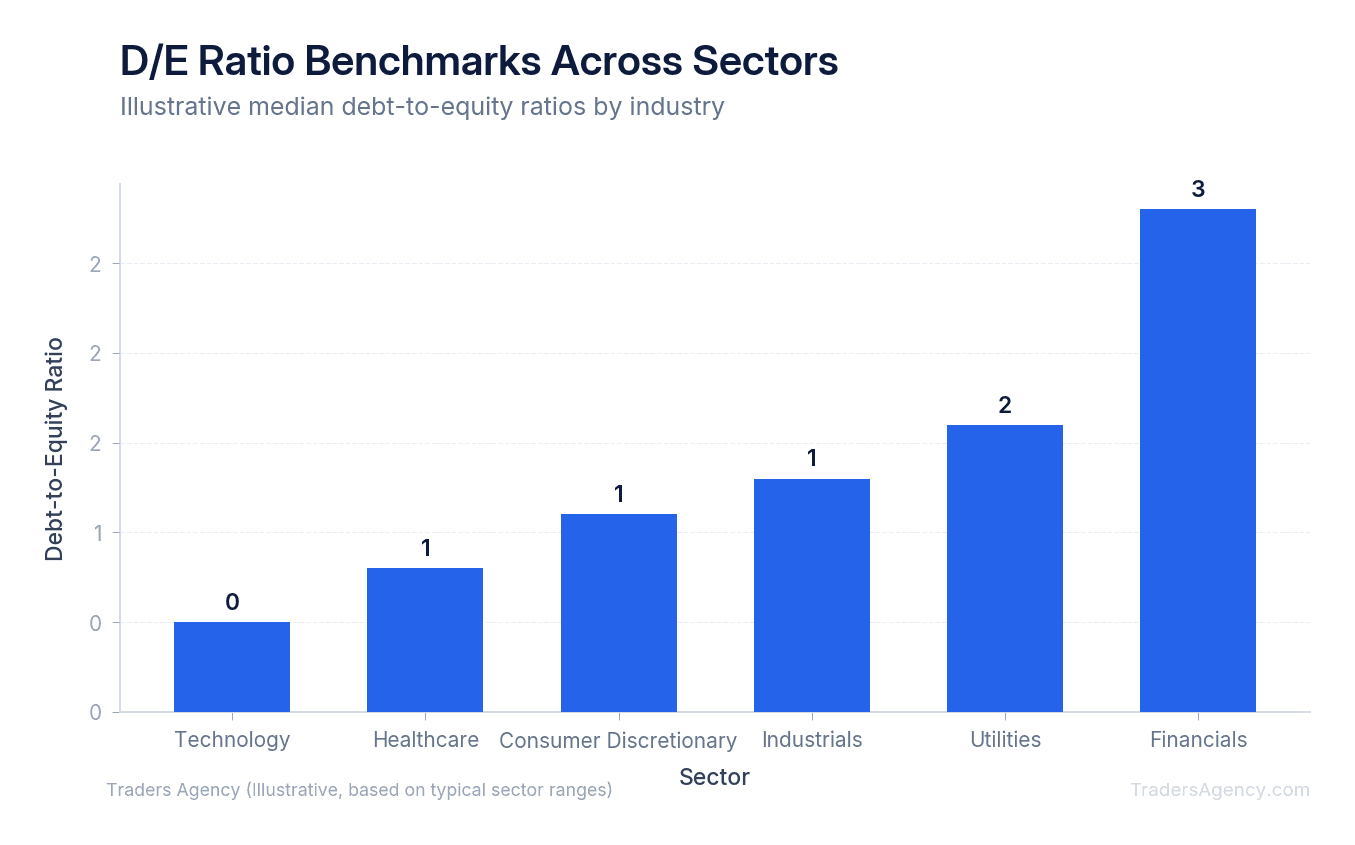
If you find a tech stock with a ratio of 2.5, that is a massive warning sign. But if you find a major utility company with a ratio of 2.5, that is completely normal business operations. Always compare a stock to its direct competitors within the same sector.
Want expert trading insights delivered daily?
Join thousands of traders who rely on Traders Agency for market analysis and trade ideas.
Join Traders AgencyWhere Can You Find Debt-to-Equity Ratio Data?
You do not have to calculate this metric by hand every time you trade. Most modern financial platforms provide this data instantly. We prefer to use free stock screeners to filter out companies with dangerous debt levels before we even look at a stock chart.
If you want the raw data, you should look at official SEC filings. The U.S. Securities and Exchange Commission requires public companies to release quarterly 10-Q reports and annual 10-K reports. You can find these documents on the SEC's EDGAR database. The balance sheet is the exact place to find total liabilities and shareholder equity figures. You will usually find liabilities listed first, followed by the equity section at the bottom of the page.
For faster research, open your brokerage platform or a free financial data tool. Go to the "Statistics" or "Key Data" tab for your chosen stock ticker. You will usually find the metric listed under the "Balance Sheet" section, already calculated for you.
What Does a High D/E Ratio Mean in a Rising Rate Environment?
A high debt-to-equity ratio indicates severe financial danger when interest rates are rising. As central banks increase rates, the cost of borrowing goes up. Companies with massive debt loads will see their profit margins crushed by higher monthly interest payments.
This is where we introduce a companion metric called the interest coverage ratio. This ratio measures how easily a company can pay interest on its outstanding debt. You calculate it by dividing a company's earnings before interest and taxes (EBIT) by its interest expense.
Key Concept: The interest coverage ratio tells you whether a company earns enough to comfortably pay its debt interest. A ratio below 1.5 is a red flag, meaning the company barely generates enough income to cover its interest obligations.
Imagine a company with a debt-to-equity ratio of 2.5. When interest rates are at 1%, their loan payments are cheap. They can easily cover the interest with their current cash flow.
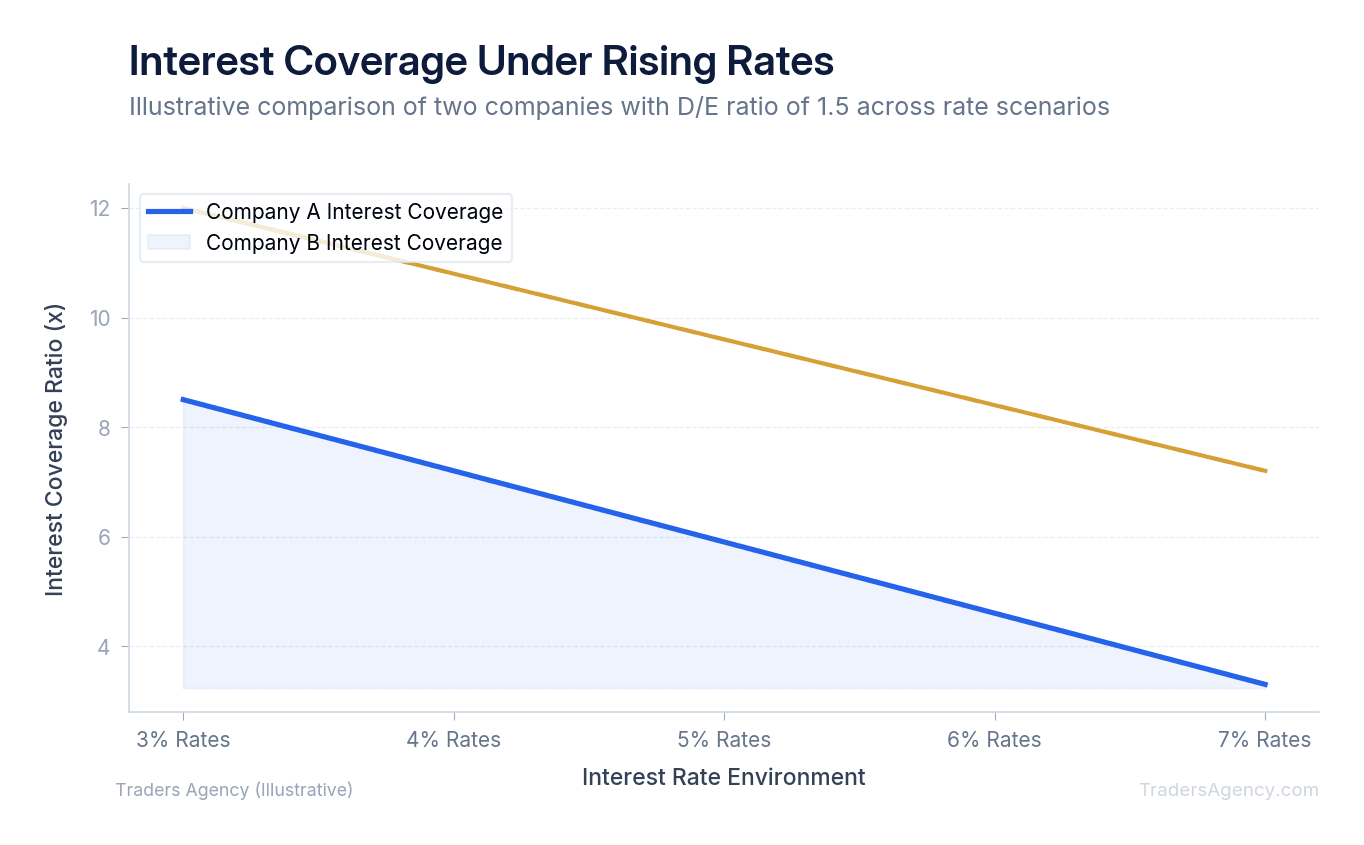
If interest rates jump to 5%, their debt payments skyrocket. This is especially true if the company relies on variable-rate loans. Even if their revenue stays exactly the same, their profits vanish. We always check the interest coverage ratio alongside the debt metrics during inflationary periods. You can monitor rate decisions and economic data through the Federal Reserve's official website.
How Do You Use the D/E Ratio When Making an Investment Decision?
Our team uses this metric as a primary risk management filter. We do not buy a stock just because it has a low debt load. Instead, we use high debt as a warning sign to avoid potential disasters.
Here is our exact step-by-step process for evaluating a new stock:
- Check the sector average: We find the standard ratio for the specific industry using a stock screener.
- Compare the target stock: We check if our target company is above or below that sector average.
- Review the historical trend: We look at the company's ratio over the past five years. We want to see if debt is growing faster than equity.
- Evaluate the interest coverage: We ensure the company generates enough cash flow to comfortably pay its loan obligations.
Here is a practical example. Say you are looking at a retail stock. If the retail sector averages a 1.2 ratio, and your target stock sits at 1.1, the debt is well-managed. If your target stock suddenly jumps to 2.8, we would halt our investment and investigate why they are borrowing so much money.
Watch Out: Never use this metric in isolation. A company might take on debt for a very good reason, like funding a highly profitable acquisition. Always combine fundamental balance sheet checks with strict technical entry points. If you decide to trade a company with a high debt-to-equity ratio, keep your allocation small and use hard stop losses to protect your account.
Finally, adjust your position sizing based on the risk. The higher the debt burden, the smaller your position should be. This way, if the debt eventually drags the stock price down, your overall portfolio absorbs the hit without serious damage.
Want expert trading insights delivered daily?
Join thousands of traders who rely on Traders Agency for market analysis and trade ideas.
Join Traders AgencyKey Takeaways
- The debt-to-equity ratio compares total liabilities to shareholder equity, revealing how much a company depends on borrowed money versus its own funds to operate.
- A higher ratio signals greater reliance on creditor financing, which means a single bad quarter can push a heavily leveraged company toward serious financial trouble.
- Sector benchmarks matter: a ratio that looks dangerous in one industry may be completely normal in another, so always compare a company against its direct peers.
- When trading a high debt-to-equity stock, reduce your position size proportionally to the debt burden so a price decline does not cause serious damage to your overall portfolio.
- Never use this metric alone. Pair balance sheet analysis with technical entry points and hard stop losses before committing capital.
DISCLAIMER: Traders Agency does not offer financial advice. The information provided is for educational purposes only and should not be considered financial advice. Traders Agency is not responsible for any financial losses or consequences resulting from the use of the information provided. Trading carries inherent risks and may not be suitable for all individuals. You are advised to conduct your own research and seek personalized advice before making any investment decisions, recognizing the potential risks and rewards involved.
See more from Traders Agency on Google
Make us a preferred source and our market analysis will appear more prominently in your Google Search, Top Stories, and AI results.
Add to Preferred Sources



