
Analyzing revenue growth vs profit margins is how we determine whether a company is actually making money or just burning through cash. Revenue shows the total sales flowing in, while profit margins reveal how efficiently those sales convert into real economic value. You've probably watched a stock report massive sales numbers, only to see its share price tank the next day. We're going to walk you through exactly why that happens and how to make sure you're reading the full picture.
Our team frequently sees traders misinterpret earnings reports because they focus on the top line without understanding the underlying business efficiency. By the end of this guide, you'll know how to evaluate the growth vs. profitability tradeoff like a professional. We'll show you exactly how to calculate these metrics, where to find the data, and how to apply these concepts to your own trading decisions.
What Is the Difference Between Revenue Growth vs Profit Margins?
The difference between revenue growth and profit margin comes down to volume versus efficiency. Revenue growth measures the percentage increase in total sales over a specific period. Profit margin measures the percentage of those sales that actually remain as profit after subtracting operating costs and taxes.
Think of a retail store selling televisions. If the store sells 1,000 televisions this year compared to 500 televisions last year, they've achieved massive revenue growth. But if they had to slash prices and spend heavily on advertising to move those extra units, their profit margin might drop to zero. They're pushing more product, but they're not keeping any of the money.
Key Concept: Revenue is the "top line" because it sits at the very top of an income statement. Profit is the "bottom line" because it's the final number remaining after all expenses are paid. Smart traders always evaluate both together.
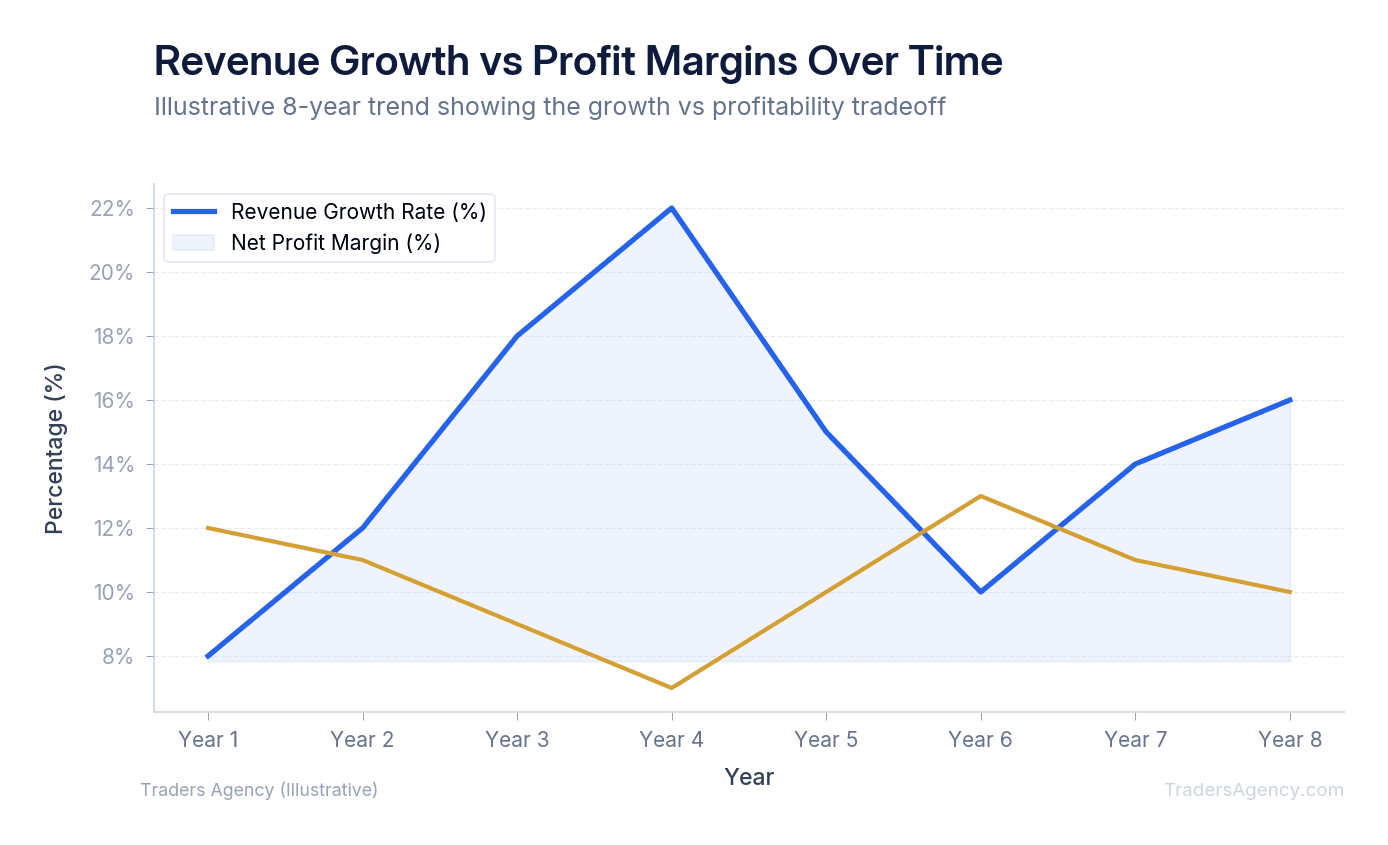
We teach our traders to look at both metrics together. High revenue growth with shrinking margins often signals a company buying its growth through unsustainable spending. Conversely, expanding margins with flat revenue can indicate a company cutting costs to the bone, which might hurt future expansion.
Gross, Operating, and Net Margin: Which One Should You Focus On?
You should focus on all three margin types because they tell different stories about a business. Gross margin reveals production efficiency. Operating margin shows how well management controls overhead costs. Net margin indicates the final bottom-line profitability after taxes and interest are paid.
To truly understand a company's financial health, we need to look at the income statement in stages. Each margin metric strips away a different layer of expenses.
1. Gross Profit Margin
Gross profit margin measures the money left over after subtracting the direct costs of creating a product. These direct costs are called Cost of Goods Sold (COGS). If a company sells a software subscription for $100 and it costs $20 in server space to host it, the gross profit is $80. The gross margin is 80 percent. We look at gross margin to determine whether the core product is inherently profitable.
2. Operating Profit Margin
Operating profit margin takes the gross profit and subtracts all daily business expenses: rent, administrative salaries, marketing, and research. If that same software company spends $50 per user on marketing and office rent, their operating profit drops to $30. The operating margin is now 30 percent. This metric shows us how efficiently the management team runs the corporate side of the business.
3. Net Profit Margin
Net profit margin is the final step. It takes the operating profit and subtracts interest payments on debt, then taxes, along with any one-time or non-operating items. If the company pays $10 in taxes and interest, the final net profit is $20. The net margin is 20 percent. When we evaluate a stock for a long-term hold, this is the number that ultimately dictates how much cash the business can return to shareholders.
| Margin Type | What It Measures | Example (per $100 in Revenue) |
|---|---|---|
| Gross Margin | Revenue minus Cost of Goods Sold | $80 (80%) |
| Operating Margin | Gross Profit minus Operating Expenses | $30 (30%) |
| Net Margin | Operating Profit minus Interest, Taxes & Non-Operating Items | $20 (20%) |
How Do You Calculate Revenue Growth Rate?
You calculate the revenue growth rate by subtracting the previous period's revenue from the current period's revenue, dividing that number by the previous period's revenue, and multiplying by 100. This formula gives you the exact percentage increase or decrease in sales over your chosen timeframe.
We teach our members to run this calculation across multiple timeframes to spot trends. Looking at a single quarter can be misleading due to seasonal fluctuations.
Here's a concrete example of how we set up this calculation. Assume we're analyzing a hypothetical company called TechCorp.
- Gather the Data: Pull the total revenue numbers from the company's income statements.
- Year 1 Revenue: $500 million
- Year 2 Revenue: $650 million
- Apply the Formula: Subtract the older number from the newer number to find the absolute growth. $650 million minus $500 million equals $150 million in new revenue. Then divide that new revenue by the original Year 1 revenue: $150 million divided by $500 million equals 0.30. Finally, multiply by 100 to get the percentage: 0.30 times 100 equals a 30 percent revenue growth rate.
- Compare to Margin Trends: Once we have the 30 percent growth figure, we immediately check the net margin for the same two years. If TechCorp had a 10 percent net margin in Year 1 and a 12 percent net margin in Year 2, we have a highly bullish setup. The company is growing sales rapidly while simultaneously becoming more profitable.
Key Concept: Revenue growth alone doesn't tell you if a company is healthy. Always pair the growth rate with margin trends. Rising revenue plus rising margins is the strongest fundamental signal you can find.
Which Matters More for Investors: Revenue Growth or Profit Margins?
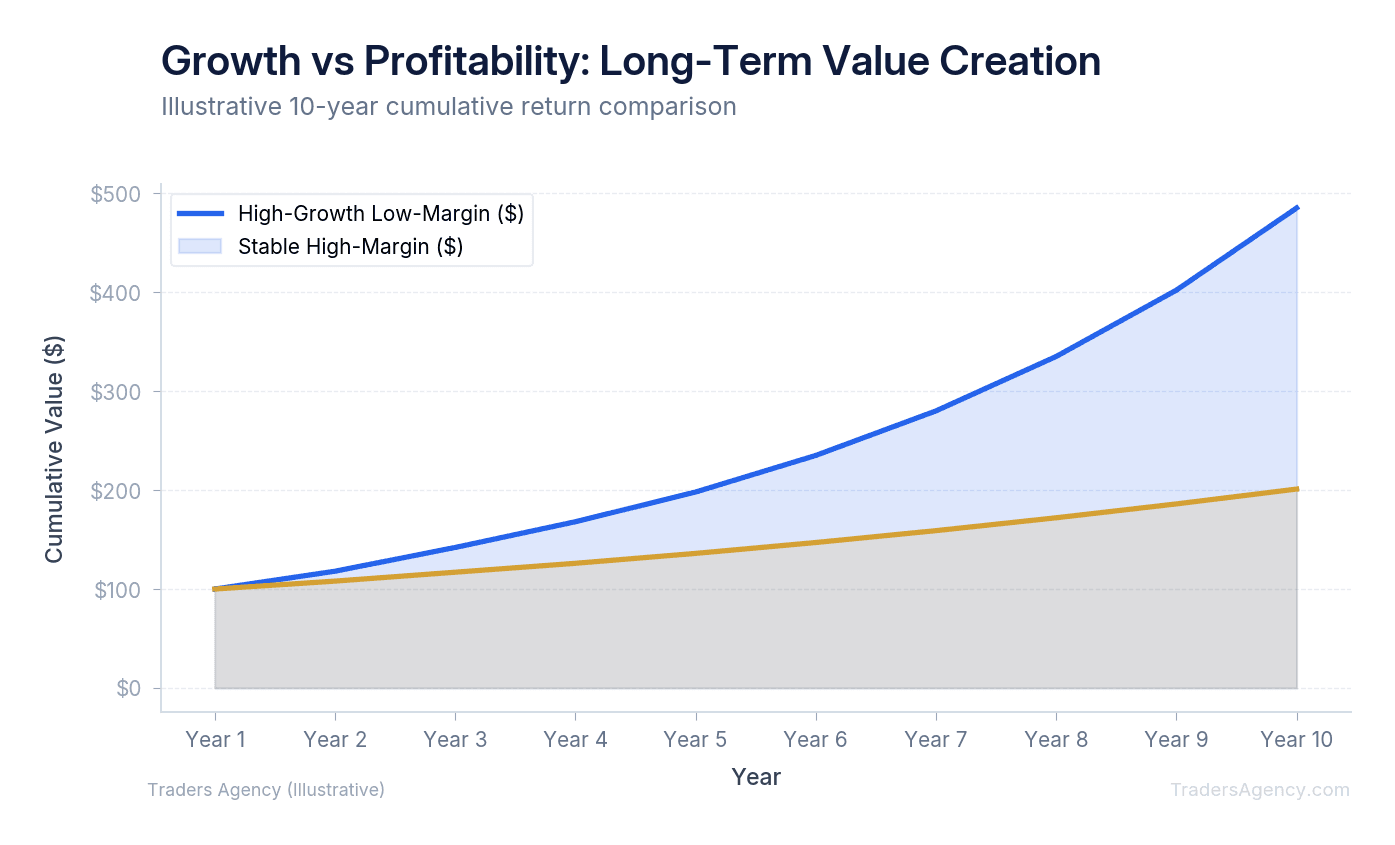
Neither metric universally matters more because the answer depends entirely on the lifecycle stage of the company. Early-stage companies must prioritize revenue growth to capture market share. Mature companies must prioritize profit margins to generate cash flow and return value to their shareholders.
When we evaluate a young technology company, we expect to see high revenue growth and negative profit margins. This is normal. The company is spending heavily on customer acquisition and product development. The debate around revenue growth vs profit margins shifts depending on where a company sits in its maturity curve.
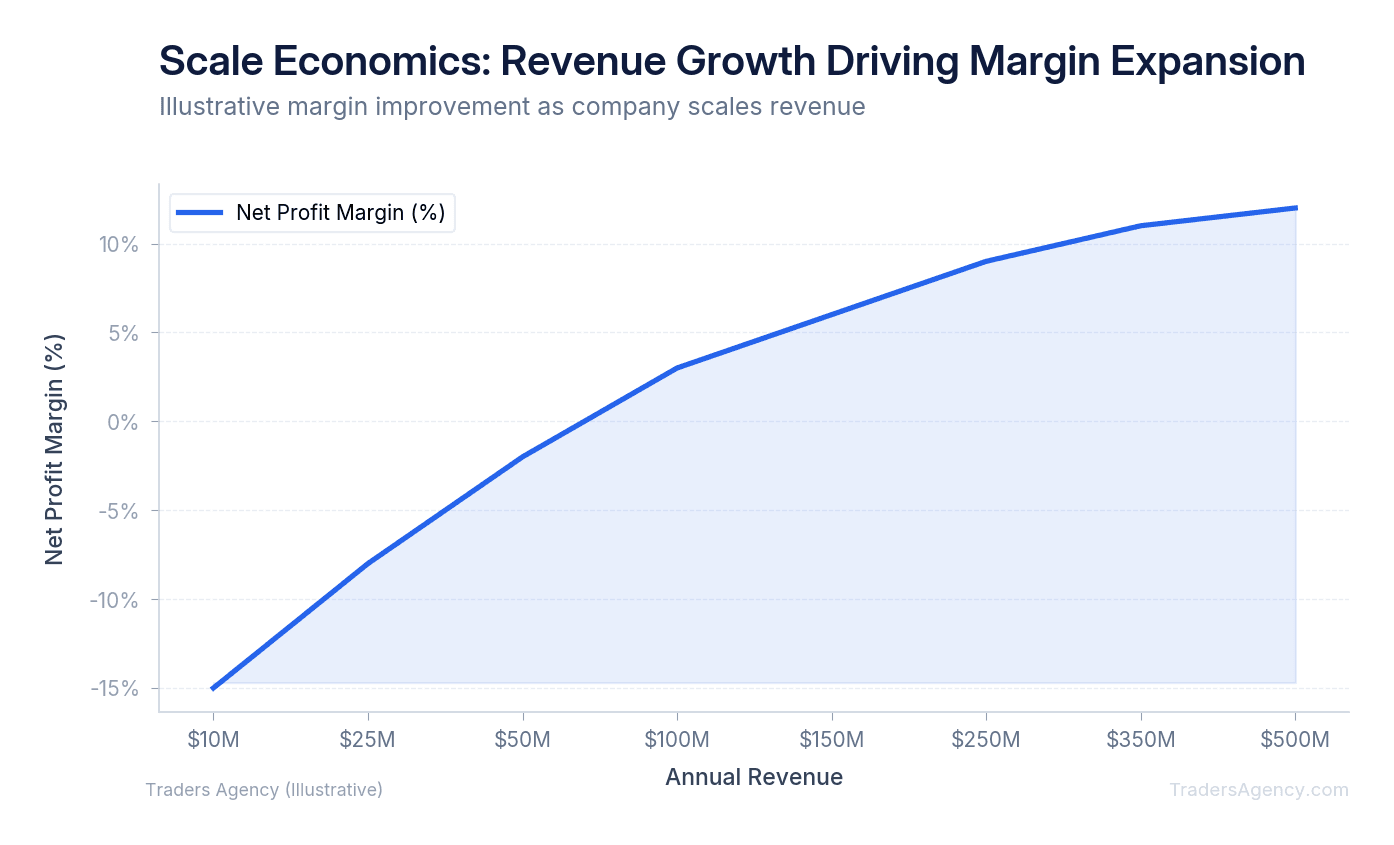
Understanding Scale Economics
The strategy of buying unprofitable, high-growth companies relies on a concept called scale economics. The theory is that once a company reaches a certain size, its revenue will outpace its fixed costs.
For example, building a software platform might cost $10 million whether you have one customer or one million customers. As revenue grows, that fixed cost becomes a smaller percentage of total sales. This naturally leads to margin expansion.
However, if we're evaluating an established consumer goods company like Procter & Gamble, the rules change entirely. We don't expect massive revenue growth from a mature company. Instead, we demand strong, stable profit margins. If a mature company shows shrinking margins, it usually means they're losing pricing power to competitors.
Want expert trading insights delivered daily?
Join thousands of traders who rely on Traders Agency for market analysis and trade ideas.
Join Traders AgencyWhat Is a Good Profit Margin for a Business?
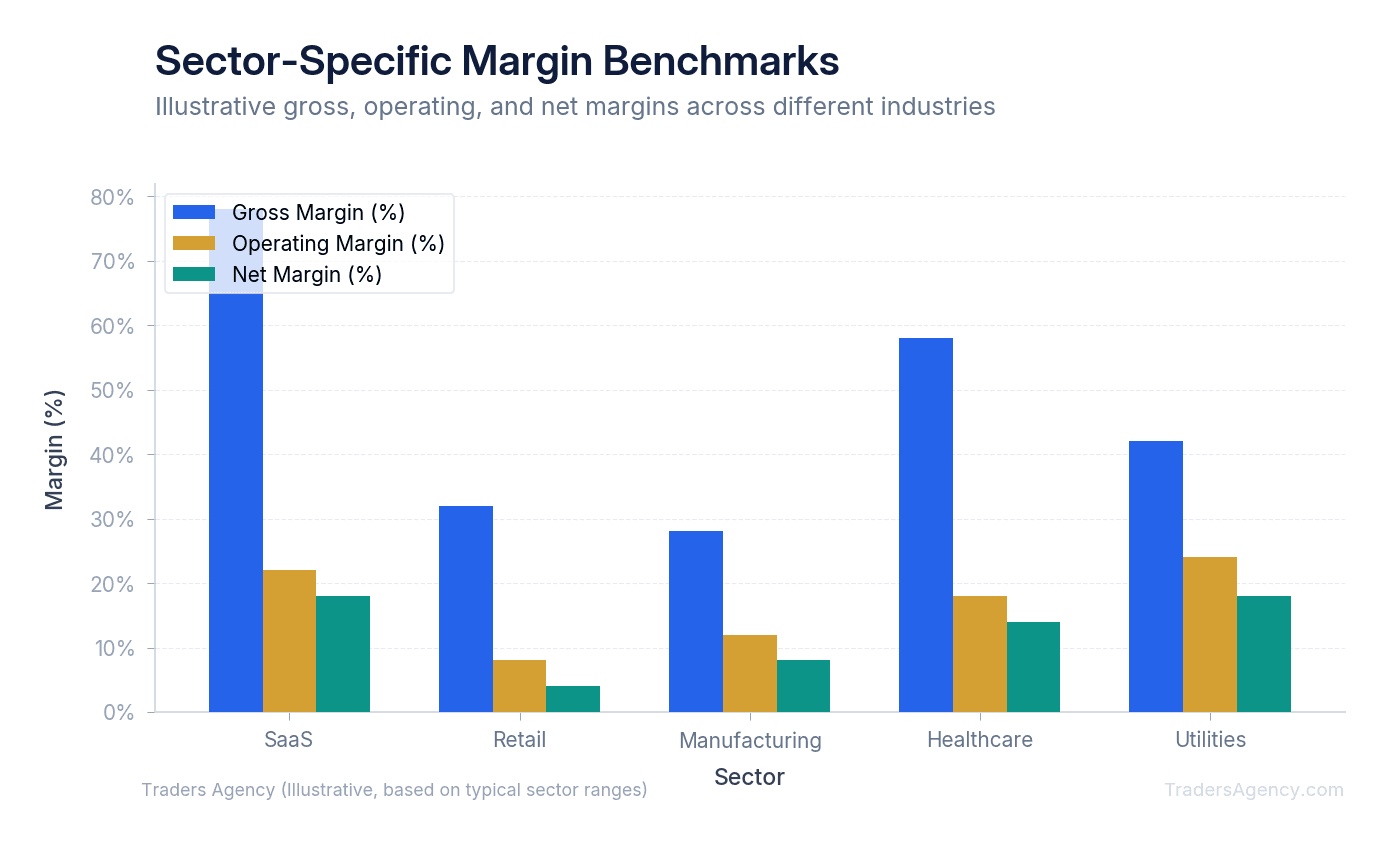
A good profit margin depends entirely on the specific industry sector. Software companies often maintain net margins above 20 percent due to low production costs. Retail businesses typically operate successfully with net margins between 2 and 5 percent because they rely on high sales volume.
You cannot compare the margins of a grocery store to the margins of a cloud computing firm. They operate on completely different business models. Our team uses sector-specific benchmarks when screening for stock setups.
Here's what we look for across different industries:
| Industry | Typical Gross Margin | Typical Net Margin | What We Watch For |
|---|---|---|---|
| SaaS / Software | 70 - 85% | 15 - 25% | High gross margins since duplicating software costs almost nothing |
| Retail & Grocery | 25 - 30% | 2 - 5% | Thin margins are normal; a 6% net margin is exceptional |
| Manufacturing | 20 - 35% | 8 - 12% | Heavy capital investment in factories and equipment |
| Healthcare & Pharma | 60%+ | 15 - 20% | Cheap production but massive R&D costs compress net margins |
When you evaluate a stock, always compare its margins to its direct competitors. If a retail stock has a 3 percent net margin while its biggest rival has a 6 percent net margin, the rival is operating twice as efficiently.
Where Can You Find Margin and Revenue Data in SEC Filings and Screeners?
To apply these concepts, you need accurate data. We never rely on press release headlines because companies often highlight flattering metrics while burying bad news. Instead, we go straight to the official financial statements.
The best place to find raw data is the SEC's EDGAR database, which provides free access to all public company filings. We strongly recommend reading the 10-Q (quarterly report) and 10-K (annual report) for any company you're evaluating.
Reading the Income Statement
When you open a 10-K, navigate to the "Consolidated Statements of Income." Here's exactly how to pull the numbers you need:
- Find Total Revenue: Look at the very top line. It might be labeled "Total Sales" or "Net Revenue."
- Find Gross Profit: Look a few lines down for "Cost of Revenue" or "Cost of Goods Sold." Subtract this from Total Revenue to get your Gross Profit.
- Find Operating Income: Scroll down past "Selling, General, and Administrative Expenses" (SG&A) and "Research and Development" (R&D) to find the Operating Income line.
- Find Net Income: Look at the very bottom of the statement. This is the final profit after taxes.
If you prefer a faster method, most free stock screeners will calculate these margins for you. When setting up a screener, we recommend adding filters for "Revenue Growth (Year over Year)" and "Net Profit Margin." This allows you to instantly filter out companies that are growing sales but losing money.
How Do You Use Revenue Growth and Margin Trends to Make an Investment Decision?
Understanding the math is only half the battle. The real skill is applying this data to an actual trading strategy. We use revenue and margin trends to identify specific setups and avoid dangerous value traps.
Spotting the Value Trap
A common mistake we see intermediate traders make is buying a stock solely because it looks cheap after a massive selloff. They see a low price-to-earnings ratio and assume it's a bargain.
Watch Out: If a company has flat revenue growth and steadily declining operating margins over the last four quarters, it is not a bargain. It is a value trap. The shrinking margins indicate the company is likely cutting prices just to maintain its current sales volume. We avoid these setups entirely.
We teach our members to check the margin trends first. If the numbers show deterioration across multiple quarters, that "cheap" stock is cheap for a reason.
The Margin Expansion Play
One of our favorite fundamental setups is the margin expansion play. Here's how we identify it:
- Screen for Consistent Revenue Growth: Look for a mid-cap company that has consistently grown revenue at 15 to 20 percent annually for three years.
- Check Operating Margin Trajectory: If the operating margin has slowly ticked up from 5 percent to 8 percent to 11 percent over those same three years, you have a prime candidate.
- Confirm the Scale Economics Story: This pattern proves the company is growing its customer base without proportionally increasing overhead costs. That's the hallmark of a business benefiting from scale.
| Year | Revenue Growth | Operating Margin | Signal |
|---|---|---|---|
| Year 1 | 18% | 5% | Early growth phase, margins still thin |
| Year 2 | 17% | 8% | Scale starting to kick in |
| Year 3 | 16% | 11% | Strong margin expansion, bullish setup |
Risk Management and Position Sizing
Even the best fundamental analysis can't protect you from broader market downturns. We never allocate our entire portfolio based on a single financial metric.
When we take a position based on strong revenue growth and expanding margins, we still apply strict risk management rules:
- We limit our maximum allocation to 5 percent of total account equity per trade.
- We place structural stop losses below major technical support levels.
- If a company reports a quarter where revenue growth unexpectedly stalls and margins compress simultaneously, we exit the position immediately. We don't wait and hope the numbers improve next quarter.
Risk Warning: Fundamental analysis gives you a directional thesis, not a guarantee. Always pair your margin and revenue analysis with proper position sizing and defined exit rules. No single metric should drive your entire portfolio allocation.
By combining fundamental margin analysis with strict risk management, you can build a highly systematic approach to the markets. You'll no longer guess whether a company is truly healthy. You'll have the exact mathematical proof right in front of you.
Want expert trading insights delivered daily?
Join thousands of traders who rely on Traders Agency for market analysis and trade ideas.
Join Traders AgencyKey Takeaways
- Revenue growth measures the percentage increase in total sales over a period, while profit margin measures what percentage of those sales survive after costs and taxes. Both numbers are required to assess business health.
- A company can double its revenue and still destroy shareholder value if it slashes prices or overspends to win customers. The television retailer example illustrates how volume gains can mask margin collapse.
- Earnings reports that show strong top-line growth but declining margins are a common trap for traders who skip the income statement details and react to headline sales figures alone.
- Proper position sizing and defined exit rules must accompany any margin or revenue thesis. Fundamental analysis provides a directional view, not a guaranteed outcome.
- SEC filings and stock screeners give you the raw data to calculate and compare these metrics systematically, removing guesswork from the evaluation process.
DISCLAIMER: Traders Agency does not offer financial advice. The information provided is for educational purposes only and should not be considered financial advice. Traders Agency is not responsible for any financial losses or consequences resulting from the use of the information provided. Trading carries inherent risks and may not be suitable for all individuals. You are advised to conduct your own research and seek personalized advice before making any investment decisions, recognizing the potential risks and rewards involved.
See more from Traders Agency on Google
Make us a preferred source and our market analysis will appear more prominently in your Google Search, Top Stories, and AI results.
Add to Preferred Sources