Skip to content
BLOG

Stock Market Blog

Daily stock market analysis, trade alerts, and trading education from Ross Givens and the Traders Agency team.

Showing 1188–1199 of 3702 articles
A split-screen trading display shows two stocks side by side — one with a high share price and one with a low share price — with a large balance scale centered between them, visually equalizing their true worth.
Educational
Educational

Understanding Market Capitalization

Market capitalization explained simply: learn how to calculate market cap, what size segments mean, and how to use this metric to build a smarter trading p

TAT
Traders Agency Team
May 15, 2026
A dramatic close-up of a massive circular silicon wafer — roughly the size of a dinner plate — gleaming with intricate circuit patterns under sharp, cool blue and silver lighting, symbolizing Cerebras' flagship Wafer Scale Engine processor.
Market News
Market News

Cerebras Systems IPO: Why Shares Are Falling

Cerebras Systems IPO raised $5.55B — then shares dropped 2.6%. Here's what's driving the volatility and why traders are watching AI hardware closely.

TAT
Traders Agency Team
May 15, 2026
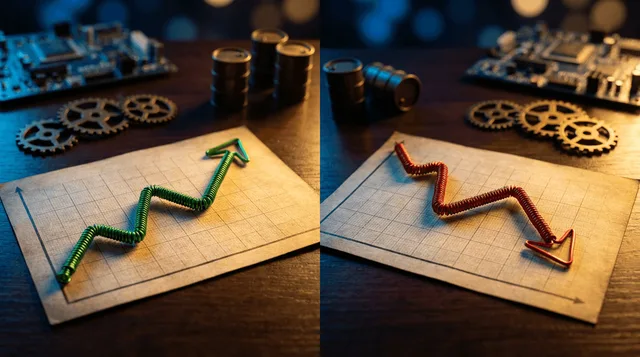
A split-screen composition showing a glowing, upward-trending stock chart in electric blue and green on one side, contrasting with a downward-sloping graph in muted gray on the other, symbolizing the tech surge versus materials decline.
Market News
Market News

Stock Market Today: Tech Surges, Materials Sink

Stock market today: Tech jumped +1.49% as Cisco surged 13% and Cerebras hit $100B at IPO. Materials dropped -0.78%. What tomorrow's retail sales data means

TAT
Traders Agency Team
May 14, 2026
A massive copper pipe or gleaming copper ingot dominates the foreground, its distinctive reddish-orange metallic surface catching dramatic industrial lighting, with a blurred background showing data center server racks and wind turbines.
Stock Analysis
Stock Analysis

I’m Up $40,000 on This Metal… And I’m Buying More

Copper stocks to buy are the urgent trade of 2026. A 25% supply shortfall meets exploding data center demand — here's why one investor owns 50,000 lbs and

Ross Givens
Ross Givens
May 14, 2026
A split-screen financial chart shows a stock price line climbing to new highs on one side while an RSI indicator curve visibly slopes downward on the other, with bold diverging arrows dramatically illustrating the disagreement between the t
Educational
Educational

Divergence Trading with RSI and MACD

Learn how the RSI divergence strategy reveals momentum shifts before price reverses. Combine RSI and MACD to confirm bullish and bearish divergence setups.

TAT
Traders Agency Team
May 14, 2026
A split-screen visual showing the iconic skylines of Washington D.C.
Market News
Market News

Trump-Xi Summit: Dow, S&P, Nasdaq Futures Surge

Trump Xi summit stocks are moving premarket — Dow up 0.4%, Nasdaq leading with +5.11% over 10 days. Here's what traders are watching as Beijing talks unfol

TAT
Traders Agency Team
May 14, 2026
A majestic condor with wings fully spread soars horizontally between two clearly defined cliff walls or boundary lines, symbolizing the strategy's defined risk range.
Educational
Educational

Iron Condor Strategy Explained

The iron condor strategy turns sideways markets into income. Learn how to construct the trade, manage Greeks, and adjust positions before expiration.

TAT
Traders Agency Team
May 14, 2026
A dynamic upward-trending stock chart rendered in bold green lines surges dramatically against a dark financial dashboard background, with glowing data points and percentage indicators suggesting explosive growth momentum.
Market News
Market News

S&P 500 Stocks With Soaring Sales: 20 Names

S&P 500 stocks with soaring sales are dominating this earnings season. These 20 companies show surging revenue and improving gross margins — including AI h

TAT
Traders Agency Team
May 14, 2026
A massive oil pipeline stretching across a sun-scorched Texas landscape toward a glowing Gulf Coast refinery on the horizon, with stacks of gold coins or bundled cash visible in the foreground, suggesting enormous wealth in motion.
Stock Analysis
Stock Analysis

Chevron Is About to Buy This ‘Sleepy’ $20 Stock… Could Jump 50% Overnight

Chevron acquisition target stock hiding in plain sight — a $20 midstream play that could jump 50% the moment big oil deploys its $100B cash pile.
Ross Givens
Ross Givens
May 13, 2026
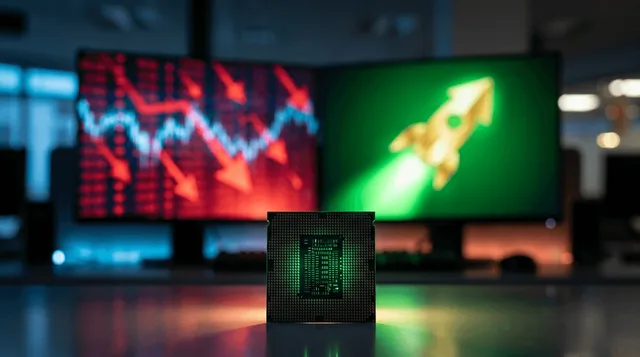
A split-screen stock market display showing a gleaming upward arrow or rocket representing tech and semiconductors on one side, bathed in bright green light, while the other side shows a sea of red-tinted downward arrows representing the br
Market News
Market News

Stock Market Today: S&P 500 Record, Most Stocks Fall

Stock market today: S&P 500 hit 7,444 as tech and semiconductors surged, yet two-thirds of stocks closed lower. Why the split — and what it means next.

TAT
Traders Agency Team
May 13, 2026
A split-screen composition showing a chaotic wall of cascading stock tickers and candlestick charts on one side, contrasting with a clean, focused spotlight illuminating just a handful of highlighted stocks on the other side.
Educational
Educational

Building Custom Screeners for Swing Trading Setups

Custom screeners for swing trading cut thousands of tickers to 10–20 high-probability setups. Learn the exact volume, momentum, and volatility filters that

TAT
Traders Agency Team
May 13, 2026
A dramatic upward-shooting rocket made of glowing gold coins and circuit board elements blazes through a dark sky, leaving a fiery trail behind it.
Stock Analysis
Stock Analysis

This Market Is On FIRE… These 2 Stocks Could DOUBLE Next

Stocks that could double are emerging as the S&P 500 hits new highs despite 3.8% inflation. See which 2 sectors institutional money is flooding into right

Ross Givens
Ross Givens
May 13, 2026
Join the Edge

Stop watching.
Start winning.

50,000+ traders get our daily brief before the market opens.

Free. No spam. Unsubscribe anytime.

Traders AgencyWhat Customers Say
4.8
1,544