
The US stock market has been surging for six weeks straight. If history is any indication, this is just the beginning. Massive institutional buying is showing up in specific corners of the market. My focus right now: tracking exactly where that money is flowing to find stocks that could double in the coming months.
Why Can't Inflation Stop This Stock Market Rally?
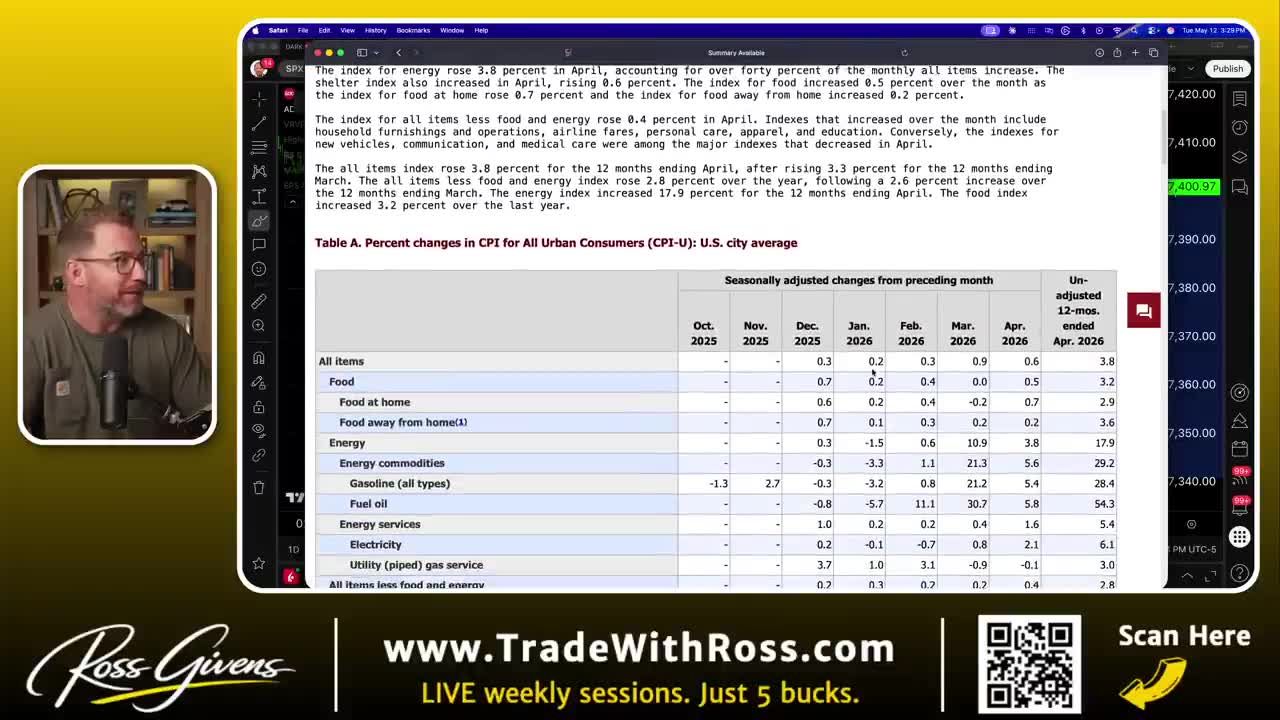
The US Bureau of Labor Statistics announced that the consumer price index rose 0.6% in April. That brings the unadjusted 12-month inflation rate to 3.8%. A lot of this is driven by energy costs, primarily oil and gasoline.
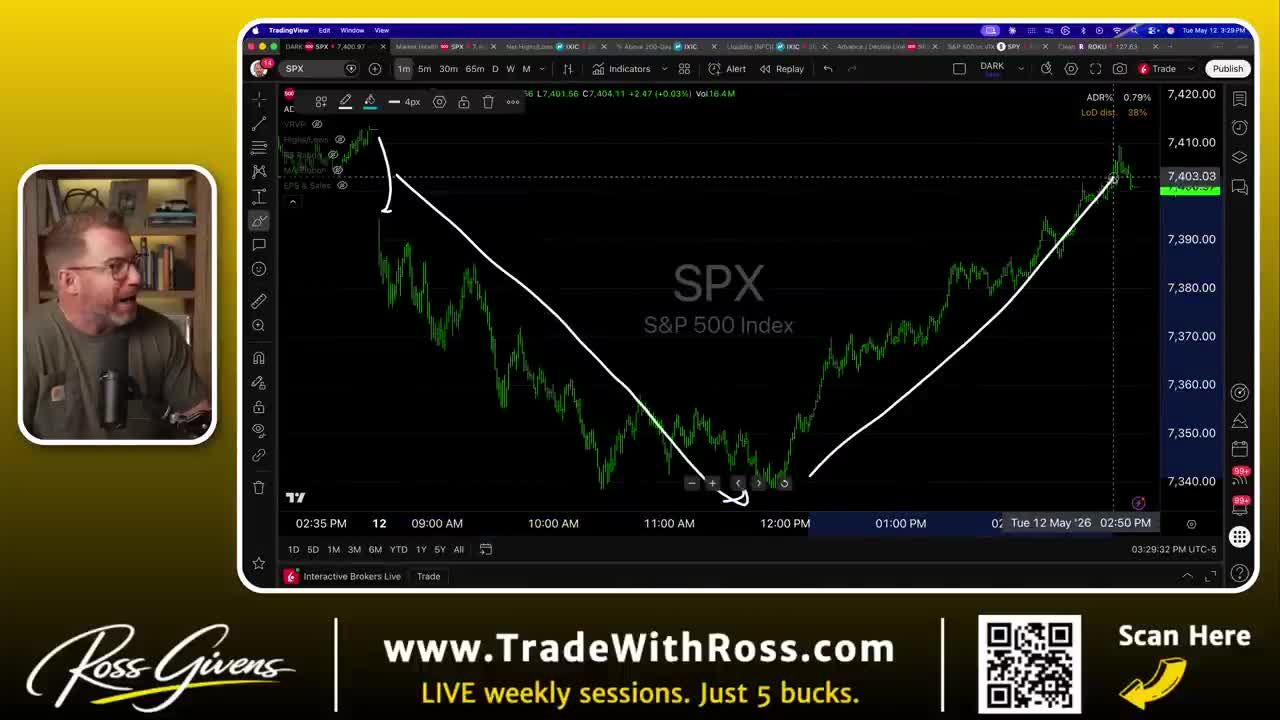
Despite above-average inflation, the S&P 500 continues to paint new highs. The market gapped down in the morning following the report, sold off all the way until lunch, then rallied to recover pretty much all of those losses by the close.
That recovery is a really nice sign of strength. Nothing can hold this market back. Investors are completely ignoring major headwinds:
- Above-average inflation, which typically lowers the odds of rate cuts
- A war with Iran
- A closed Strait of Hormuz
- Rising oil prices
Despite all of this, the index continues to paint new highs. That is exactly the kind of market you want to be invested in.
How Do You Follow Institutional Money to Find Stocks That Could Double?
The industry strength indicator tracks the top 40 areas of the market, the top 40 subsectors in terms of performance over the last one, two, three, and six-month periods. It shows what's rising the most. All things being equal, the sectors of the market showing the biggest gains, the ones going up the most, are the ones where the big institutions are buying. That's what's leading the market.
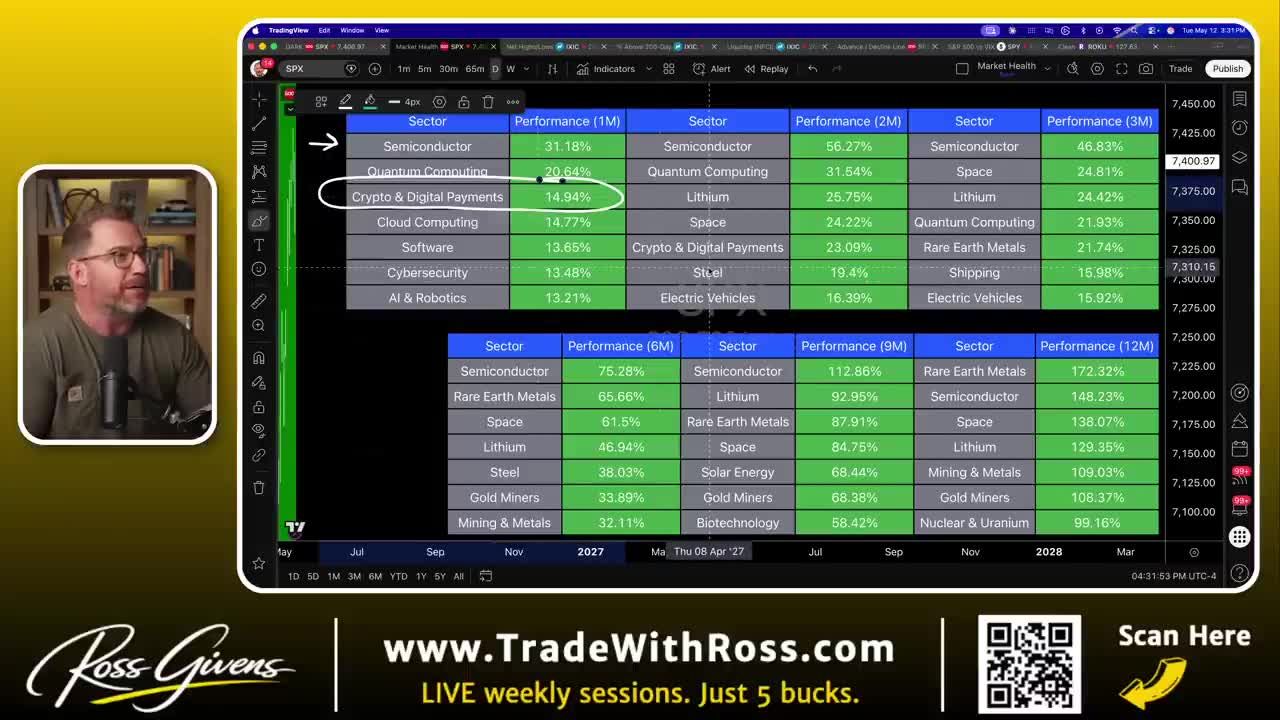
Semiconductors have been on an absolute tear. Intel is up over 200% in two months. AMD has already doubled. But a lot of these names are very extended, very stretched.
There are a couple of other areas actually rising up the ranks, and these are the stocks that could double from here. Two specific sectors are moving fast.
Crypto and Digital Payments
It has been a crypto winter. Digital payment stocks have massively lagged, and now they are beginning to rise up the ranks. This sector is one of the top-performing areas over the last two months. Over the last one month, it is a big-time leader.
Rare Earth Metals
This sector gets really hot and then really cold. Right now, it is beginning to rise up the ranks. Over the last year, rare earth metals are the leading group of the market, second being semiconductors. Not a group you want to ignore.
Get an entire year of live weekly mentoring sessions, my newsletter, indicators, bonus reports, tons more. Click the link and I'll see you in the next live session.
Join my Black Ops Trading ClubTwo Stocks That Could Double Next
Based on the sector strength outlined above, two specific companies are setting up for big potential runs.
1. Coinbase (COIN)
Coinbase benefits directly when crypto is strong. When Bitcoin, Ethereum, and the crypto coins are surging, more people are opening accounts, more people are buying, and the company is generating more commissions. When crypto is stalling, less so. That directly affects the bottom line of Coinbase.
Bitcoin is currently rounding out a bottom and beginning to run higher. Coinbase is setting up to follow suit. The stock moves pretty much in lockstep with Bitcoin.
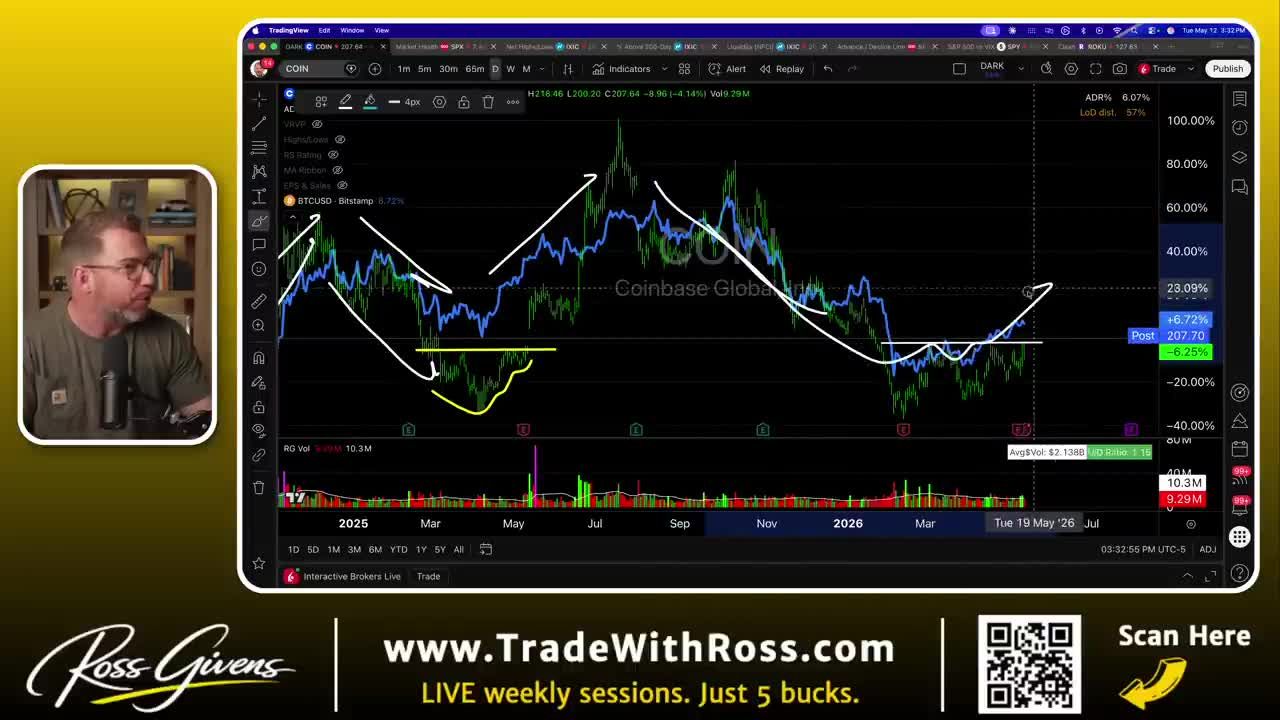
COIN suffered a massive 60% to 70% drop over the last year. Now we are seeing the exact shallowing formation you want off the lows after a big decline. It is absorbing supply, forming a rounded bottom, and the dips are becoming shallower and less severe.
Assuming cryptos stay strong, this stock should have a nice clean run higher.
2. Tronox Holdings (TROX)
Tronox Holdings operates in the highly rated rare earth sector. The stock currently holds a relative strength rating of 96, meaning it is outperforming 96% of all stocks in the market over the last year (with extra weight given to the most recent quarter).
TROX formed a large decline, built a rounded bottom, compressed, tightened up, and then broke out and pushed higher. It recently had an earnings report last Wednesday. The stock dipped into the 50-day simple moving average, holding right in there, consolidating.
The rule for these new strong stage-two breakouts running 30% to 50%: always buy the first touch of the 50-day moving average.
This is a perfect pullback buy in a very strong market, in a very strong group. You can buy it in here and not risk a ton of money.
Six Weeks of Gains. Now What?
The entire S&P 500 index is up 17% since the March 30th low. That is huge for the largest equity market on the planet.
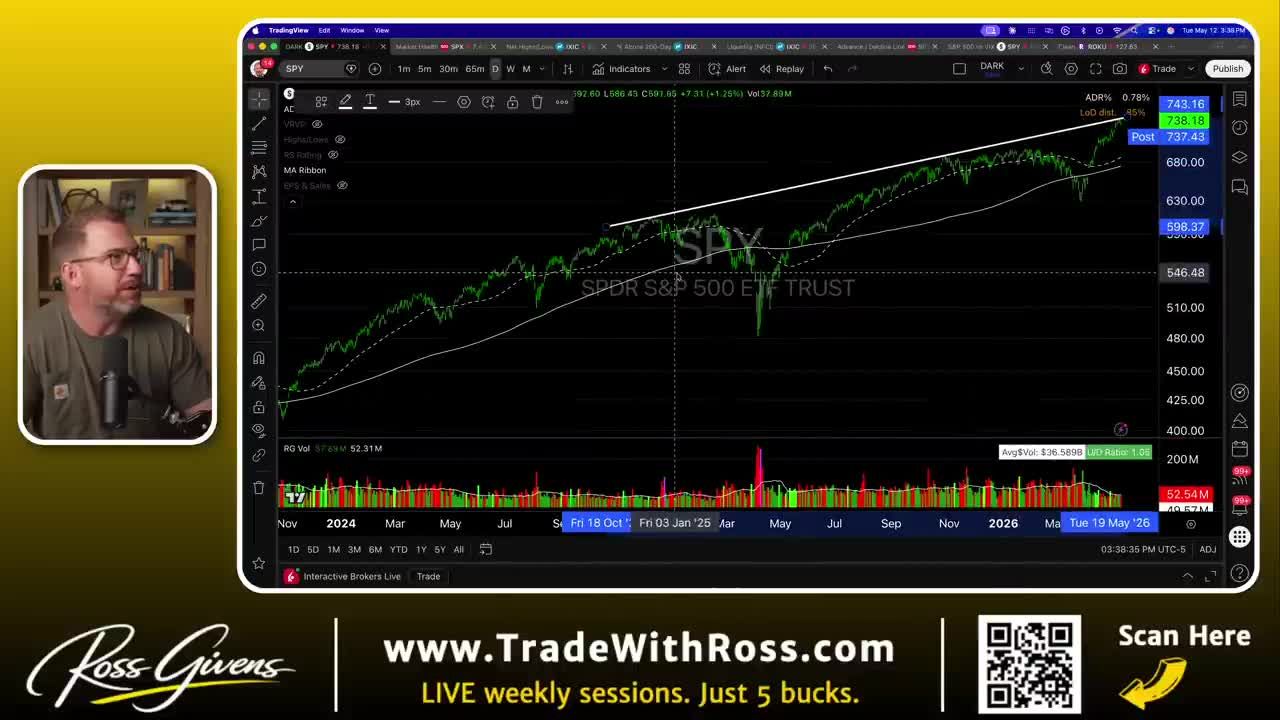
On a logarithmic scale, the S&P 500 is sitting right near that upper band where stocks tend to kind of pull back and revert to their mean.
I am not saying the market is peaking. I am not saying we are going to crash. I fully expect the market to be materially higher three, six, and twelve months into the future. But in the near term, we are extended. We could see a small stall, a pullback, or a hesitation period.
How Should You Manage Risk When a Stock Is Overextended?
A market pause would actually be more than welcome. It would allow these stocks to set up new bases, compress, and get ready for the next move higher. Until that consolidation happens, you need to manage your risk.
Reduce Position Sizes
I have been very aggressive on recent positions. Now that the broader market is extended, I am cutting my trade sizes roughly in half.
For example, I recently took a $20,000 position in IPX. I have generally been allocating roughly $20,000 per swing trade. Moving ahead, I am setting these back to about $10,000.
Scale Down Proportionately
Your numbers may be different. You might step down from $200,000 to $100,000. You might drop from $50 to $25. The exact dollar amount does not matter. The principle remains the same: when the market gets a bit extended and is due for a pause or consolidation, you size down.
The Smartest Play Right Now
The market is showing incredible resilience against inflation and geopolitical pressure. By tracking institutional money through sector strength, you can consistently locate stocks that could double before the big moves happen.
Buy strong pullbacks in leading sectors while managing your overall risk.
Keep your position sizes reasonable. Wait for the 50-day moving average touches. Let the market consolidation work in your favor.
Get an entire year of live weekly mentoring sessions, my newsletter, indicators, bonus reports, tons more. Click the link and I'll see you in the next live session.
Key Takeaways
- The S&P 500 has rallied for six consecutive weeks despite CPI rising 3.8% year-over-year and 0.6% in April alone, with energy costs as the primary driver.
- On the day of the CPI report, the market sold off sharply through midday then recovered nearly all losses by the close, a V-shaped reversal that signals underlying institutional demand.
- The market is absorbing significant headwinds simultaneously: above-average inflation reducing rate-cut odds, a war with Iran, a closed Strait of Hormuz, and rising oil prices.
- The core strategy for finding stocks that could double is tracking institutional money flows by sector strength, then buying pullbacks to the 50-day moving average in leading sectors.
- Position sizing is a key risk management rule: when a stock is extended far above its moving averages after a big run, reduce position size rather than adding.
DISCLAIMER: Traders Agency does not offer financial advice. The information provided is for educational purposes only and should not be considered financial advice. Traders Agency is not responsible for any financial losses or consequences resulting from the use of the information provided. Trading carries inherent risks and may not be suitable for all individuals. You are advised to conduct your own research and seek personalized advice before making any investment decisions, recognizing the potential risks and rewards involved.
See more from Traders Agency on Google
Make us a preferred source and our market analysis will appear more prominently in your Google Search, Top Stories, and AI results.
Add to Preferred Sources