
One of the biggest AI stocks in the market is already dead. Its stock is going to zero.
The technology behind artificial intelligence is real. The demand is real. But the capital structure funding it is a house of cards.
Knowing exactly when to sell stocks is the single most important skill you can develop right now. We are watching a direct repeat of the 1999 dot-com bubble, and there are five AI companies almost guaranteed to fail based entirely on their debt.
What Warning Signs Do Investors Miss Before an AI Stock Collapses?
Bottom Line: The case for selling certain AI stocks rests not on doubting the technology but on the debt structures funding it. Companies borrowing at payday-loan rates to generate near-zero or negative returns on capital are repeating a pattern the credit markets punished in 1929, 2000, and 2007. The signal to watch is not the stock price or the product roadmap; it is who is lending, at what rate, and whether they are starting to walk away.
The credit market always moves first
Knowing when to sell stocks comes down to reading a company's capital structure. When a business borrows money at double-digit interest rates to fund operations that yield negative returns, that is a massive red flag.
Take CoreWeave. The company borrows billions at 15% interest. That is not a short seller's estimate. It is printed in black and white in their own SEC filings. They pay 12% on a second facility and 11% on a third. These are payday loan rates.
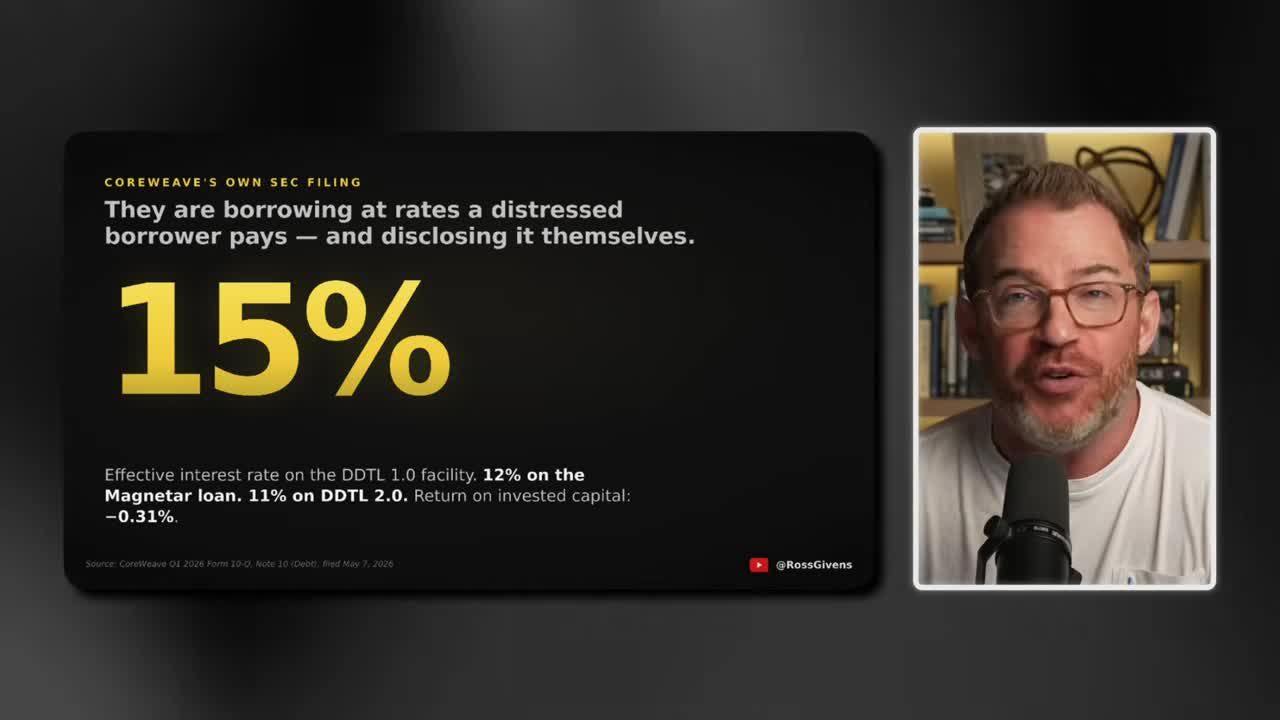
Good companies borrow at 5%. The United States government borrows at 4%. You pay 15% when the people lending you the money look at your balance sheet and conclude there is a real chance they will not get it back.
And what does CoreWeave earn on all that borrowed money? Roughly 1%. They borrow at 15% and earn less than nothing. Then they do it again at a bigger scale the next quarter.
How Does Debt Signal When to Sell a Stock?
A sell signal flashes when a company pays more in interest than it generates in revenue. When debt cannot be refinanced, operations cease immediately. Watch the refinancing window to know when to get out.
Most beginners learn this the hard way by staring at price charts. The professionals stare at the debt. You do not need a finance degree for this. You need fourth-grade math. You borrow at 15%, the thing you buy earns less than nothing, so you borrow again to cover the gap.
The people who decide how this ends are sitting in a credit committee looking at a spreadsheet. They already know AI changes the world. They are asking one question: Do I get my money back?
The day the answer is probably not, they stop lending. No announcement. No series of bad quarters. The window simply closes, and the company on the other side finds out the same way you do. If you are wondering when to sell the moment that news breaks, you are already too late. The market gaps down, and you are trapped.
March 2000: A Warning From History
Go back to the peak of the dot-com boom. There was a company called Exodus Communications.
Exodus went public in 1998. Their entire business was building data centers and renting them to the hottest technology companies in America. Racks, power, cooling, bandwidth. They owned the buildings the internet ran on, and it worked perfectly.
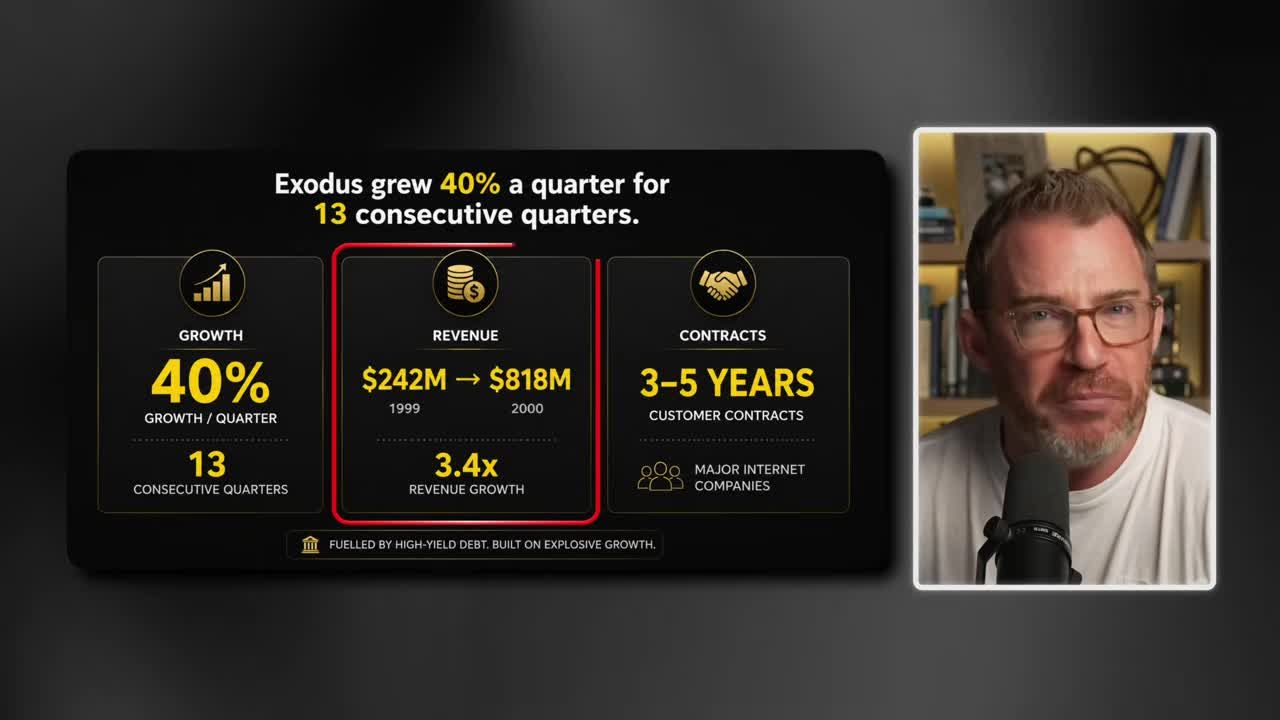
The numbers were staggering. Exodus grew 40% a quarter for 13 consecutive quarters. Revenue went from $242 million in 1999 to $818 million in 2000. They signed the biggest names on the internet to three and five-year contracts.
At the peak, the market said Exodus was worth $32 billion. They paid for it all with high-yield debt. When your revenue compounds at 40% a quarter, borrowing feels free no matter the interest rate.
In September of 2000, Exodus agreed to buy a competitor called Global Center for $6.5 billion in Exodus stock. By the time that deal closed four months later in January, 70% of the purchase price had evaporated mid-transaction.
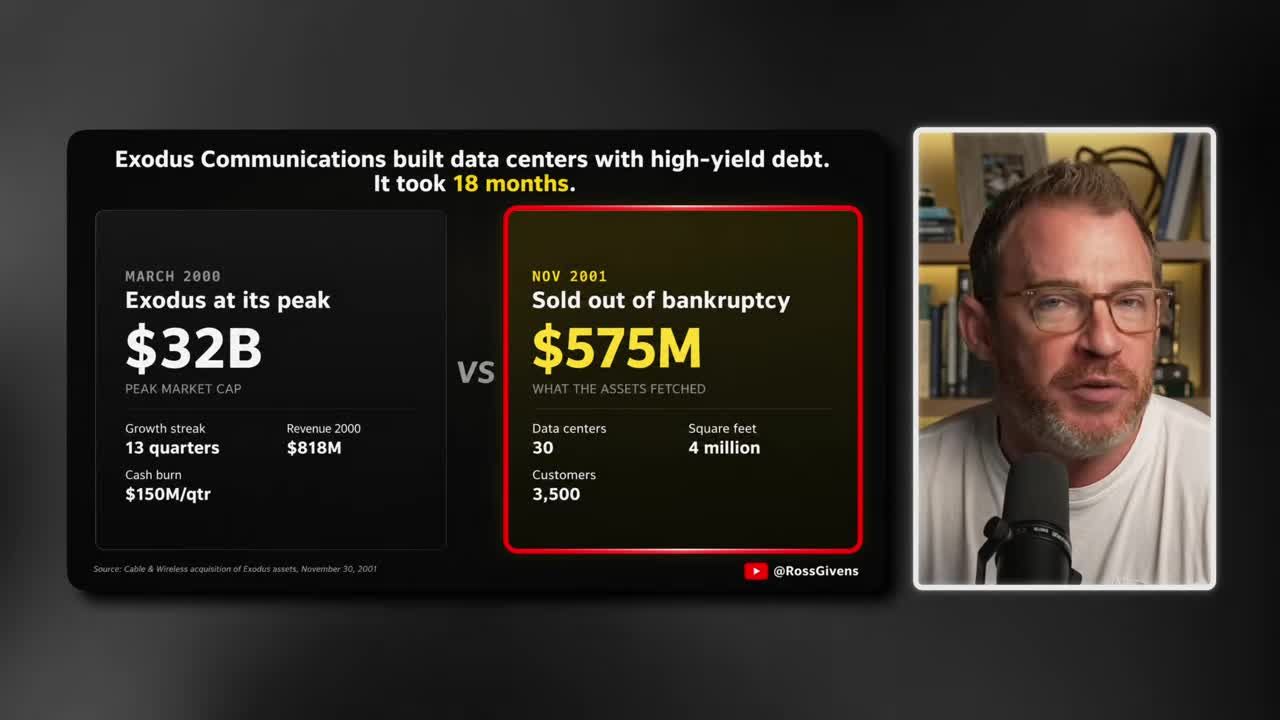
Eighteen months after the peak, Exodus filed for bankruptcy. Cable and Wireless bought it out of bankruptcy for $575 million. That included 30 data centers, 4 million square feet, and 3,500 customers. Less than 2% of the company's value from the year before. A full 98% gone.
The buildings were still standing. The fiber still worked. The racks were still full of servers. Nothing was wrong with the asset. Everything was wrong with the way it was paid for.
The Financing Loop That Kills
Exodus was not run by idiots. Neither was Global Crossing, PSET, Williams, Exo, or 360 Networks. These were serious companies with serious engineers building infrastructure we still use today.
They all failed inside the same 24 months because they were drinking from the same well. The companies selling the equipment were also lending the money to buy it.
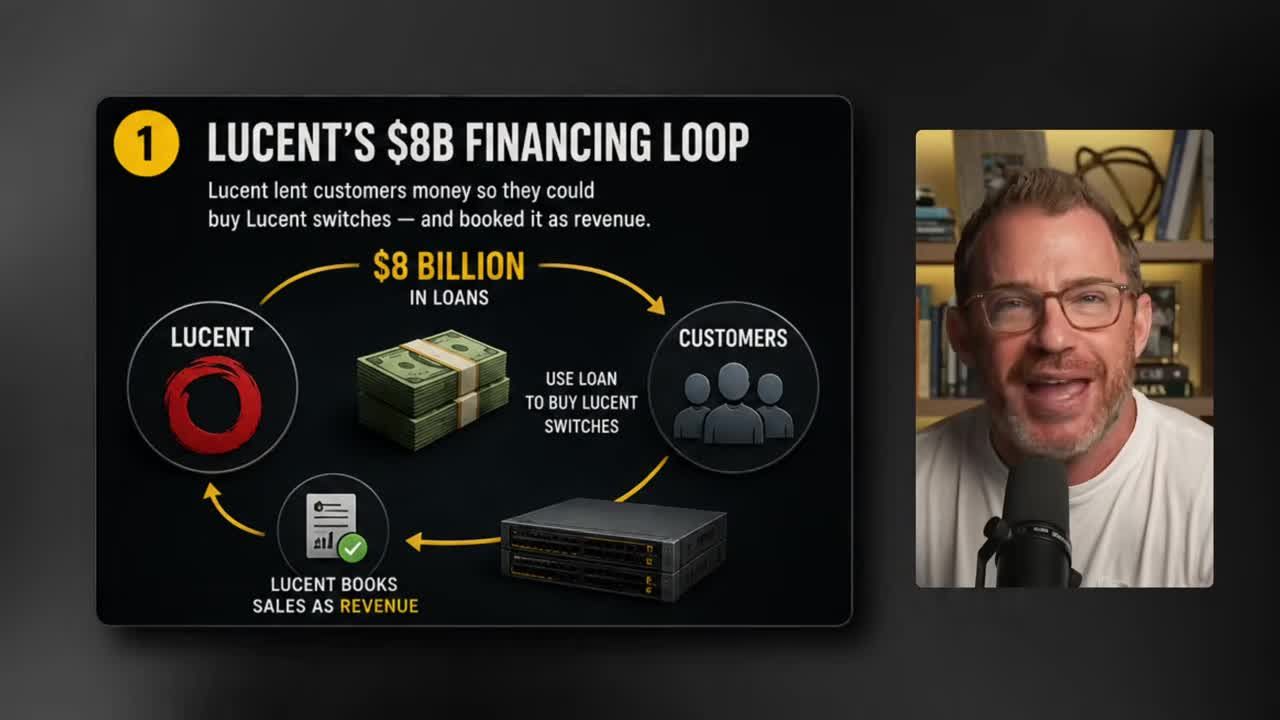
Lucent Technologies lent roughly $8 billion to its own customers. Those customers turned around and bought Lucent switches. Lucent then booked those loans as revenue on its own income statement.
Nortel did the same thing, only more aggressively. They lent up to 135% of the equipment's cost, often unsecured. More money than the gear was even worth. By the end of 2000, McKinsey counted about $25 billion of this across nine equipment makers.
Get an entire year of live weekly mentoring sessions, my newsletter, indicators, bonus reports, tons more. Click the link and I'll see you in the next live session.
Join my Black Ops Trading ClubWhich AI Stocks Are Repeating the 1999 Bubble Pattern?
The exact same business model and financing is happening today. Every AI infrastructure stock has a 1999 twin. Recognize these patterns before the market collapses.
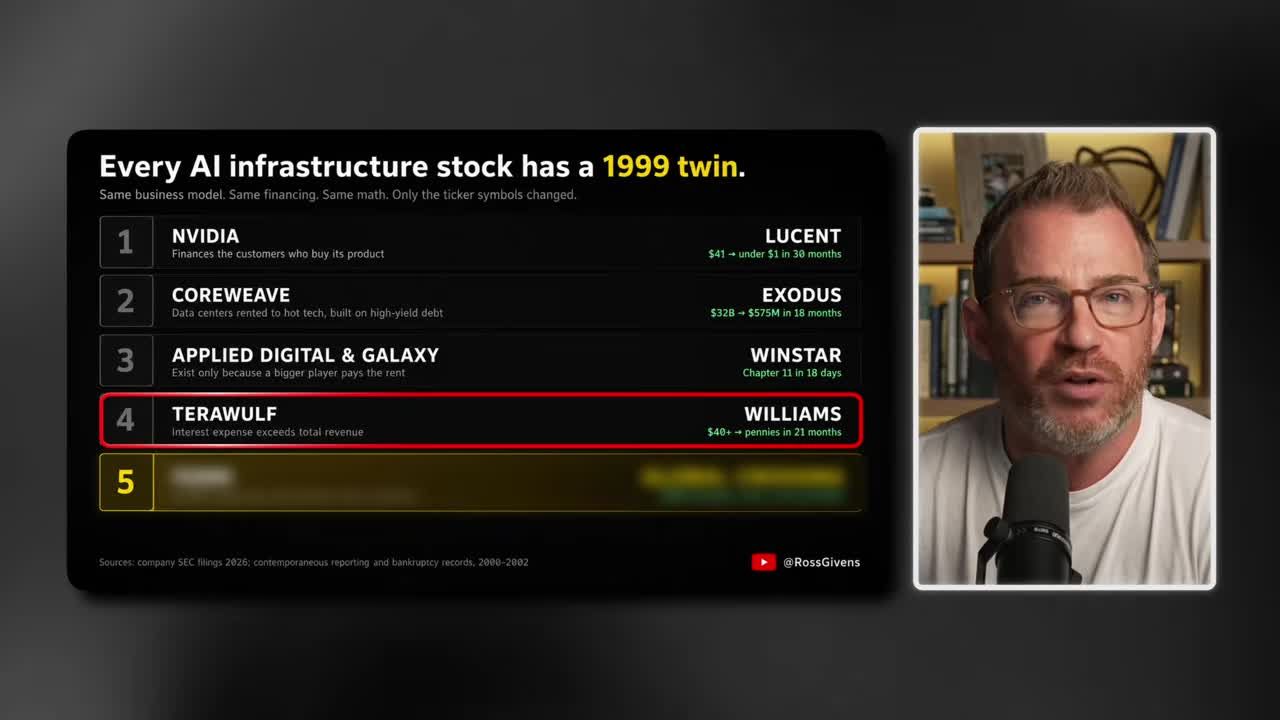
1. Nvidia: The Modern Lucent
Nvidia holds $30 billion of equity at OpenAI, $10 billion committed to Anthropic, and $2 billion in CoreWeave.
There is an agreement right there in the 8-K obligating Nvidia to purchase CoreWeave's unsold capacity through April of 2032. If CoreWeave cannot rent the chips out, Nvidia has agreed to rent them itself.
That is not a customer relationship. That is a seller underwriting its own demand. The precise thing Lucent did 25 years earlier, which destroyed $250 billion of shareholder value, an amount equal to 2% of America's GDP at the time. Lucent went from $41 a share to under a dollar in 30 months.
2. CoreWeave: The Modern Exodus
CoreWeave runs the exact same business as Exodus, right down to the square footage. Data centers rented to technology companies, built with expensive debt against multi-year contracts.
CoreWeave carries $11.7 billion of debt coming due by the end of the year against just $2.2 billion of cash on hand. They burned $4.7 billion of free cash flow in a single quarter. Their own SEC filing states that their financial controls are "not effective" more than a year after going public. Exodus had better growth, and it did not save them.
3. Applied Digital and Galaxy: The Modern Winstar
Winstar existed because Lucent financed it. Applied Digital and Galaxy Digital exist because CoreWeave rents from them.
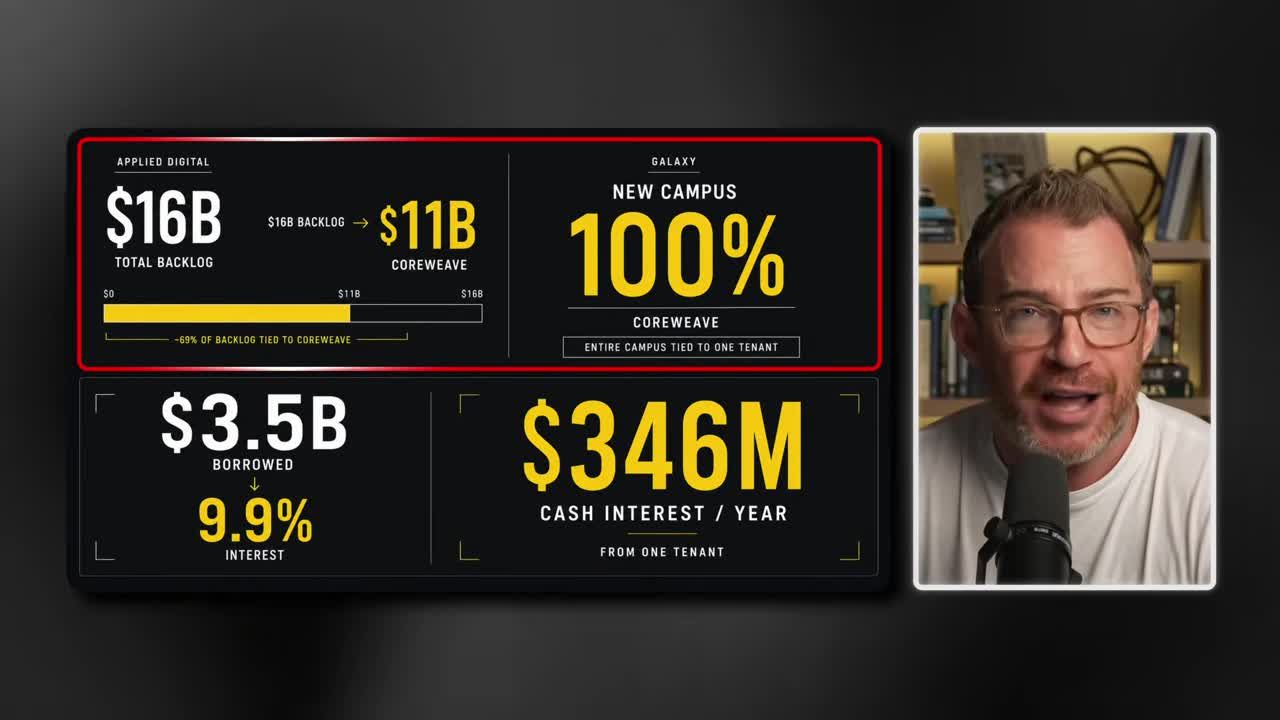
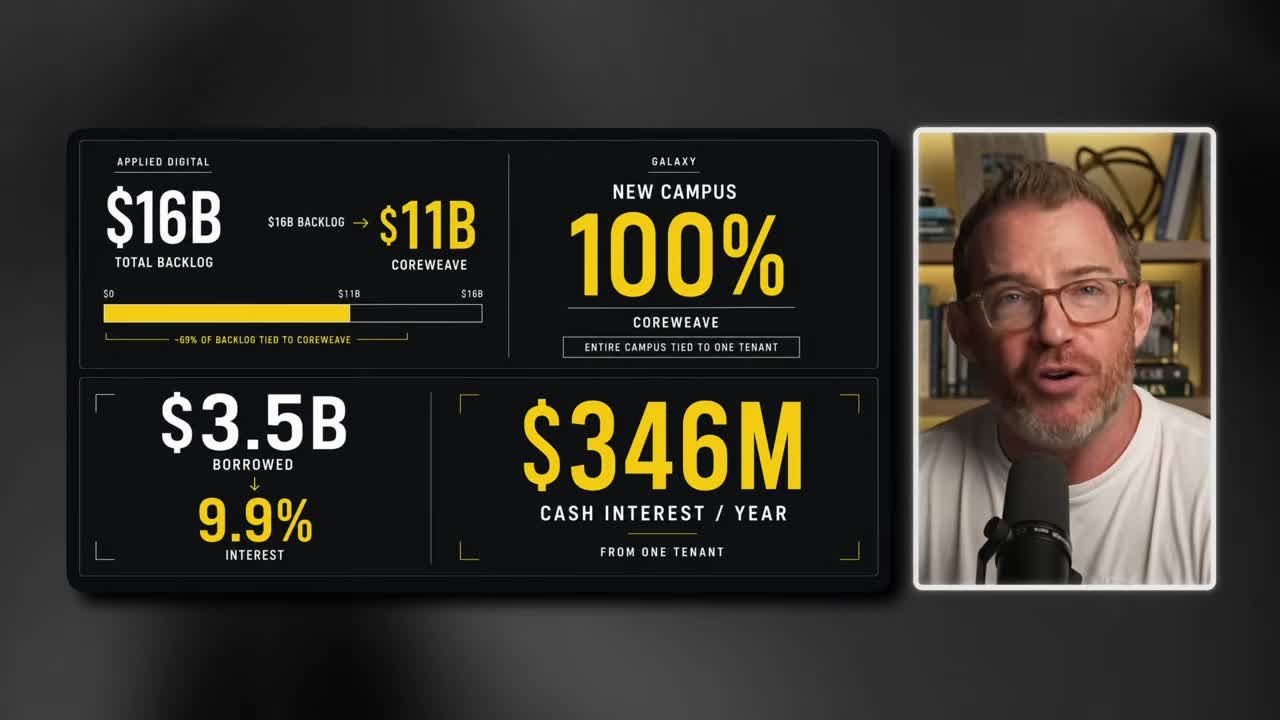
Applied Digital carries a $16 billion backlog. $11 billion of that is all CoreWeave. That is 100% concentration.
Every square foot of Galaxy's new campus is CoreWeave. Galaxy borrowed $3.5 billion at 9.9% interest to build it. That means $346 million of cash interest a year from a single tenant. They do not own a data center. They own a claim on CoreWeave's ability to pay rent.
4. Terawulf: The Modern Williams
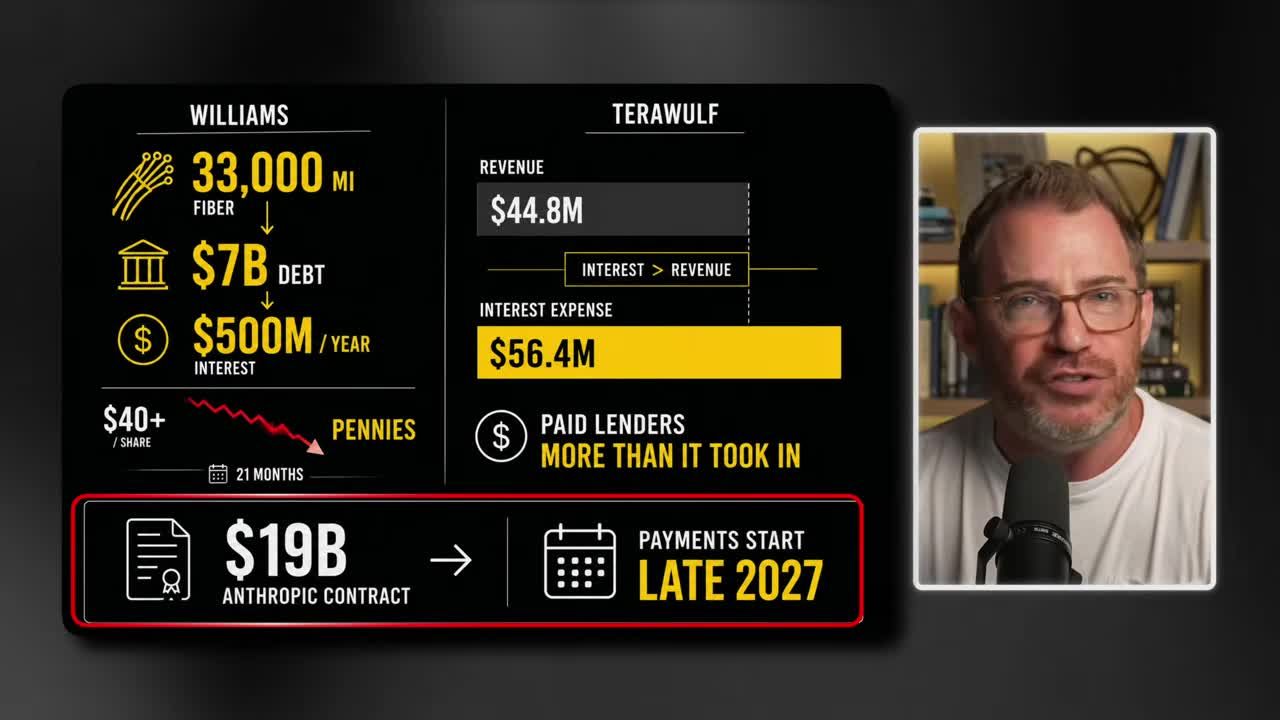
Williams built 33,000 miles of fiber against $7 billion of debt and $500 million a year of interest the business never once generated. It went from over $40 a share to trading in pennies in 22 months.
Last quarter, Terawulf posted $44.8 million of revenue against $56 million of interest expense. They paid their lenders more than the entire company took in. The $19 billion Anthropic contract everybody points to does not even start paying until late 2027.
5. Fermi: The Modern Global Crossing
Global Crossing reached a $47 billion valuation without ever earning a profit in its entire existence. It went bankrupt three years after its IPO.
Fermi went public last October. The market says it is worth $4 billion. Revenue: zero. Binding customer agreements: zero. They have $27 million in the bank and somehow spent $441 million on construction in a single quarter. Yet eight Wall Street analysts cover Fermi, and all eight rate it a buy.
When the Window Slams Shut
When lenders stop extending credit, companies fail instantly. No warning shots. No series of bad earnings reports. The moment the lending stops, demand ceases and the stock plummets to zero.
None of these companies died because demand disappeared. Exodus's data centers were full when it filed. Williams' fiber was carrying traffic. PSET's network worked perfectly on the day it went bankrupt.
They died because the refinancing window closed. Debt comes due, and you have to roll it. The same market that happily handed you $2 billion last year says no. You are left standing there with a payment you cannot make on an asset you cannot sell fast enough.
Look at Winstar Communications. Lucent had already lent it more than $700 million. Winstar came back for another $90 million. Lucent said no. Eighteen days later, a $6.3 billion company with a real network and real customers went into Chapter 11. One supplier declined a check, and the company collapsed in under three weeks.
When that happens, you will not have time to sell for cash. The bottom falls out instantly. You have to recognize the debt trap and sell while the music is still playing.
The Hard Asset Myth
The most comforting lie in this entire sector is the idea that there is real hardware behind these companies.
PSE borrowed $3.7 billion to build its network in the 1990s. Cooji Communications bought the entire United States business out of bankruptcy for $10 million. That included the customers, the backbone, the equipment, and the IP. $3.7 billion in, $10 million out.
Bondholders recovered about a quarter of a penny on the dollar. Across the whole telecom bust, bondholders got back roughly 20 cents on the dollar. More than 95% of the fiber that got laid was never even lit up. By 2002, the industry was using just 2.7% of the capacity it had built.
When everybody in a sector is liquidating at the same moment, the only buyer left is a vulture. And a vulture sets the price. There is no such thing as hard assets protecting your investment.
Even the Winner Lost 99%
Here is the part that should change how you think. Even if you pick the one company that survives, you still lose.
Level 3 Communications was the last man standing in the telecom wars. They survived every bankruptcy and eventually bought Global Crossing outright. Their fiber is still carrying traffic today under the name Lumen.
If you had picked Level 3 in 1999, you had the correct answer. And you still got destroyed.
Level 3 stock closed 1999 at $81 a share. A year later it was $32. Two years later it was at $5. By 2008 it was at 70 cents. The winner went down 99%. Eleven years later, it still had not recovered and needed a 1-for-15 reverse split just to stay listed.
The Capital Structure Decides Everything
Being right about the technology has never protected anybody from the capital structure. Not one time in a hundred years.
You are being sold on artificial intelligence. What you are actually holding is a bet on whether a handful of companies can refinance tens of billions of dollars of expensive debt in a market already charging CoreWeave 15%. Those are two completely different bets.
The music is still playing, and these stocks could stay elevated for several more years. But the people who lend money have started walking toward the exit. They moved first in 1929. They moved first in 2000. They moved first in 2007. They are starting to move right now.
You can verify the numbers yourself. Every figure cited here comes straight from the companies' own SEC filings, available through EDGAR.
Get an entire year of live weekly mentoring sessions, my newsletter, indicators, bonus reports, tons more. Click the link and I'll see you in the next live session.
Key Takeaways
- CoreWeave borrows at a 15% effective interest rate on its DDTL 1.0 facility, per its own SEC filings, while earning a return on invested capital of roughly -0.31%.
- The spread between borrowing cost and return on capital is the core warning sign: good companies borrow at 5%, the U.S. government borrows at 4%, and 15% signals lenders see real default risk.
- The credit market has historically moved before equity markets in major crashes, including 1929, 2000, and 2007, making debt structure a leading indicator of when to sell stocks.
- Five AI companies are flagged as high failure risk based entirely on their capital structures, not their technology, which may remain viable even as the funding behind it collapses.
- All figures cited are sourced directly from SEC filings available through EDGAR, making the analysis independently verifiable.
DISCLAIMER: Traders Agency does not offer financial advice. The information provided is for educational purposes only and should not be considered financial advice. Traders Agency is not responsible for any financial losses or consequences resulting from the use of the information provided. Trading carries inherent risks and may not be suitable for all individuals. You are advised to conduct your own research and seek personalized advice before making any investment decisions, recognizing the potential risks and rewards involved.
See more from Traders Agency on Google
Make us a preferred source and our market analysis will appear more prominently in your Google Search, Top Stories, and AI results.
Add to Preferred Sources