
What is the debt-to-equity ratio? The debt-to-equity ratio is a fundamental financial metric that compares a company's total liabilities to its shareholder equity. Understanding the debt-to-equity ratio meaning is straightforward: it shows exactly how much of a business is funded by borrowing versus how much is owned by the actual shareholders.
You have probably seen this happen before. A popular company reports massive sales, the stock price looks attractive, and then suddenly, the business files for bankruptcy. The missing piece of the puzzle is almost always the company's debt.
We'll walk you through how to calculate this metric, how to read the numbers, and how to spot dangerous debt levels before you buy a stock. By the end of this guide, you will know exactly how to evaluate a company's financial health using fundamental analysis.
What Is the Debt-to-Equity Ratio and Why Does It Matter?
Bottom Line: The debt-to-equity ratio cuts through headline revenue numbers to show who really has a claim on a company's assets. A ratio well above the sector average, combined with shrinking ability to cover interest payments, is a concrete warning to reduce exposure before fundamentals force the issue. Knowing how to read this single metric can prevent the kind of catastrophic loss that catches investors off guard when a seemingly healthy company files for bankruptcy.
The debt-to-equity ratio centers on financial risk and corporate leverage. This metric reveals whether a company relies too heavily on borrowed money to fund its growth. A high ratio indicates that a business takes on significant debt, which increases the risk of bankruptcy if revenues unexpectedly decline.
Our team looks at this ratio to understand who really owns the company. If a business has mostly debt, the bank essentially owns the assets. If it has mostly equity, the shareholders own the assets.
When you buy a stock, you become a part-owner of that business. You need to know if your ownership stake is buried under a mountain of loans. A company with low debt has a safety net during tough economic times. A company with high debt must constantly generate enough cash to make strict interest payments.
Key Concept: The debt-to-equity ratio tells you how many dollars of debt a company carries for every dollar of shareholder equity. A ratio of 1.0 means debt and equity are exactly equal. Below 1.0 means the company relies more on equity. Above 1.0 means it relies more on debt.
How Do You Calculate the Debt-to-Equity Ratio?
To find these numbers, you need to look at a company's balance sheet. You can find this document in the company's quarterly or annual reports filed with the Securities and Exchange Commission (SEC) through the EDGAR database.
The debt-to-equity ratio formula is straightforward. You divide the company's total liabilities by its total shareholder equity:
Total Liabilities ÷ Total Shareholder Equity = Debt-to-Equity Ratio
Here's a concrete example. Imagine you are researching a retail company called XYZ Corp. You open their latest financial statement and find the following numbers:
| Balance Sheet Item | Value |
|---|---|
| Total Liabilities | $500,000 |
| Total Shareholder Equity | $1,000,000 |
| Total Assets | $1,500,000 |
| Debt-to-Equity Ratio | 0.50 |
You apply the formula by dividing $500,000 by $1,000,000. The result is 0.50. This means XYZ Corp uses 50 cents of debt for every dollar of equity.
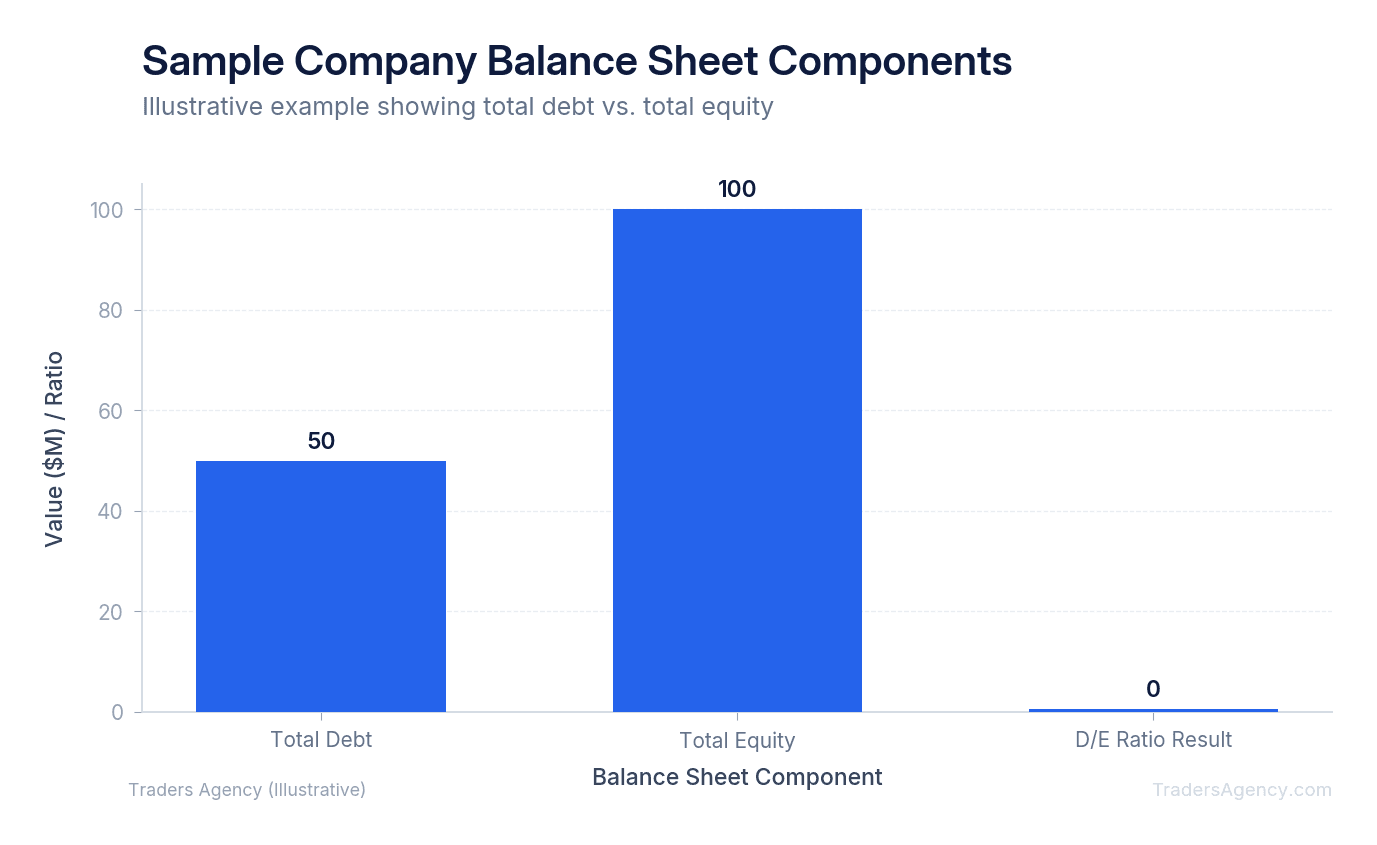
This is a very conservative financial structure. The company has twice as much equity as it does debt. If sales drop, XYZ Corp will likely survive because its loan obligations are relatively small.
What Are Leverage Ratios?
Leverage ratios are a broad category of financial metrics that measure how much capital comes in the form of debt. These formulas assess a company's ability to meet its financial obligations. Investors use these calculations to determine if a business is carrying a safe or dangerous amount of borrowing.
When comparing a general leverage ratio vs. debt-to-equity, keep in mind that debt-to-equity is simply one specific type of leverage ratio. There are several other ways to measure corporate debt.
Some common leverage ratio examples include:
- Debt-to-Assets Ratio: Divides total debt by total assets to show what percentage of the company's assets are financed by borrowing.
- Debt-to-Capital Ratio: Compares debt to the sum of debt plus equity, giving you a percentage of total capitalization that comes from loans.
- Interest Coverage Ratio: Measures how easily a company can pay interest on its outstanding debt. You calculate it by dividing earnings before interest and taxes (EBIT) by interest expense.
- Debt/EBITDA Ratio: Compares a company's total debt to its earnings before interest, taxes, depreciation, and amortization. It tells you roughly how many years it would take the company to pay back all its debt if EBITDA stayed constant and was used entirely for repayment.
We teach our members to look at multiple leverage metrics together rather than relying on a single number. Each ratio highlights a different angle of the company's debt picture, and together they give you a much clearer view of overall financial health.
Want expert trading insights delivered daily?
Join thousands of traders who rely on Traders Agency for market analysis and trade ideas.
Join Traders AgencyHow Do You Interpret the Debt-to-Equity Ratio?
You interpret the debt-to-equity ratio by comparing the calculation result to an industry average. A ratio of 1.0 means debt and equity are exactly equal. A ratio above 1.0 means the company funds its operations mostly through debt. A ratio below 1.0 means the company relies mostly on shareholder equity.
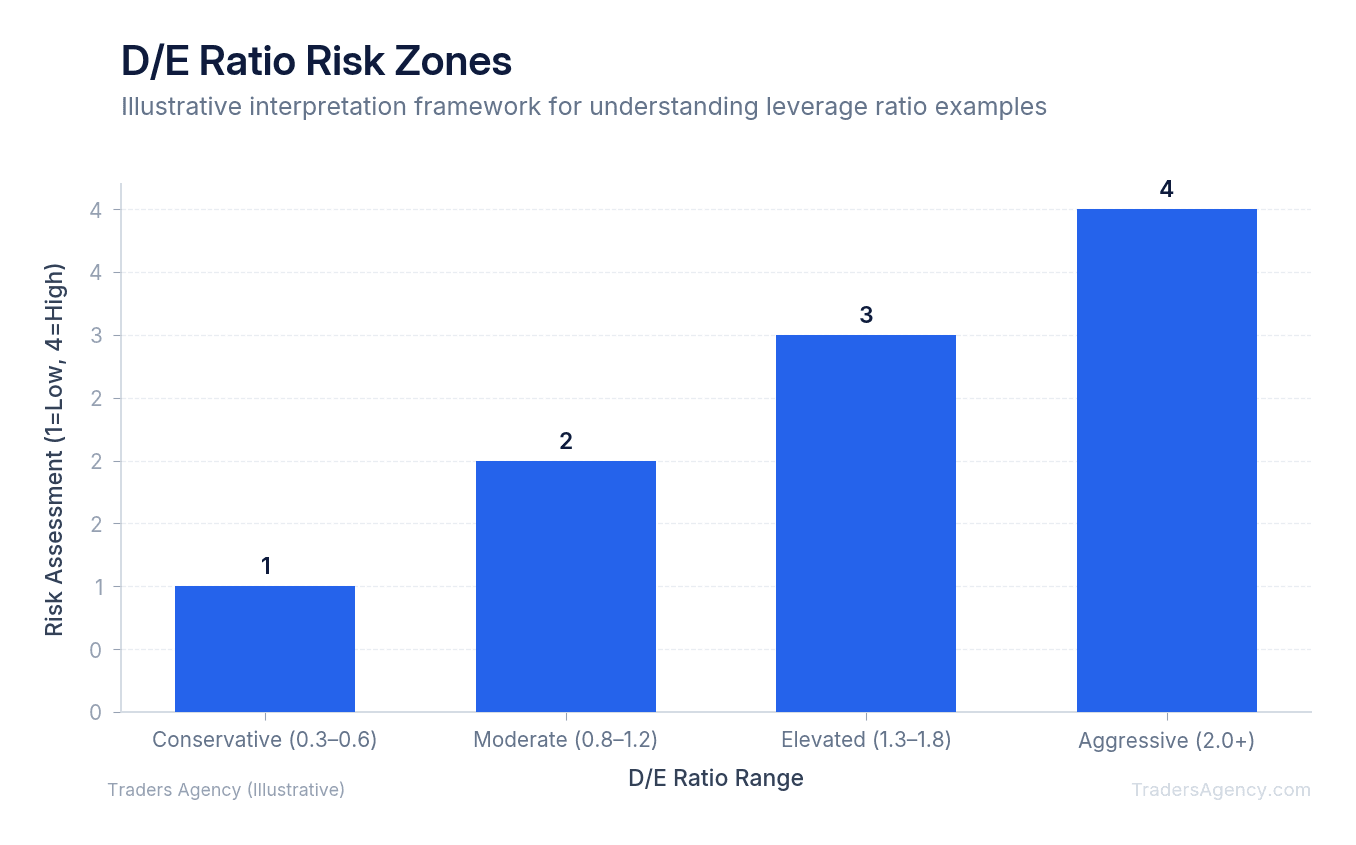
There is no single perfect number that applies to every stock. You must look at the context of the business model. However, we prefer to see ratios below 1.5 for most traditional manufacturing and retail companies.
If you see a ratio of 2.5, the company has $2.50 of debt for every $1.00 of equity. This is a business with extreme leverage. During an economic boom, high leverage can multiply profits. During a recession, high leverage can quickly lead to insolvency.
Many beginners use an online debt-to-equity calculator to speed up their research. These tools are helpful for quick screening. However, you still need to know what the output means for the specific stock you are trading.
Watch Out: A single ratio number means very little in isolation. Always compare a company's debt-to-equity ratio against three or four direct competitors in the same industry. A ratio that looks alarming in one sector may be perfectly normal in another.
What Is a Good Debt-to-Equity Ratio Across Different Sectors?
A good debt-to-equity ratio depends entirely on the company's specific industry. Capital-intensive sectors like utilities and real estate naturally carry higher ratios, often between 1.5 and 2.0. Technology and service companies require less physical infrastructure, so their typical ratios fall between 0.3 and 0.6.
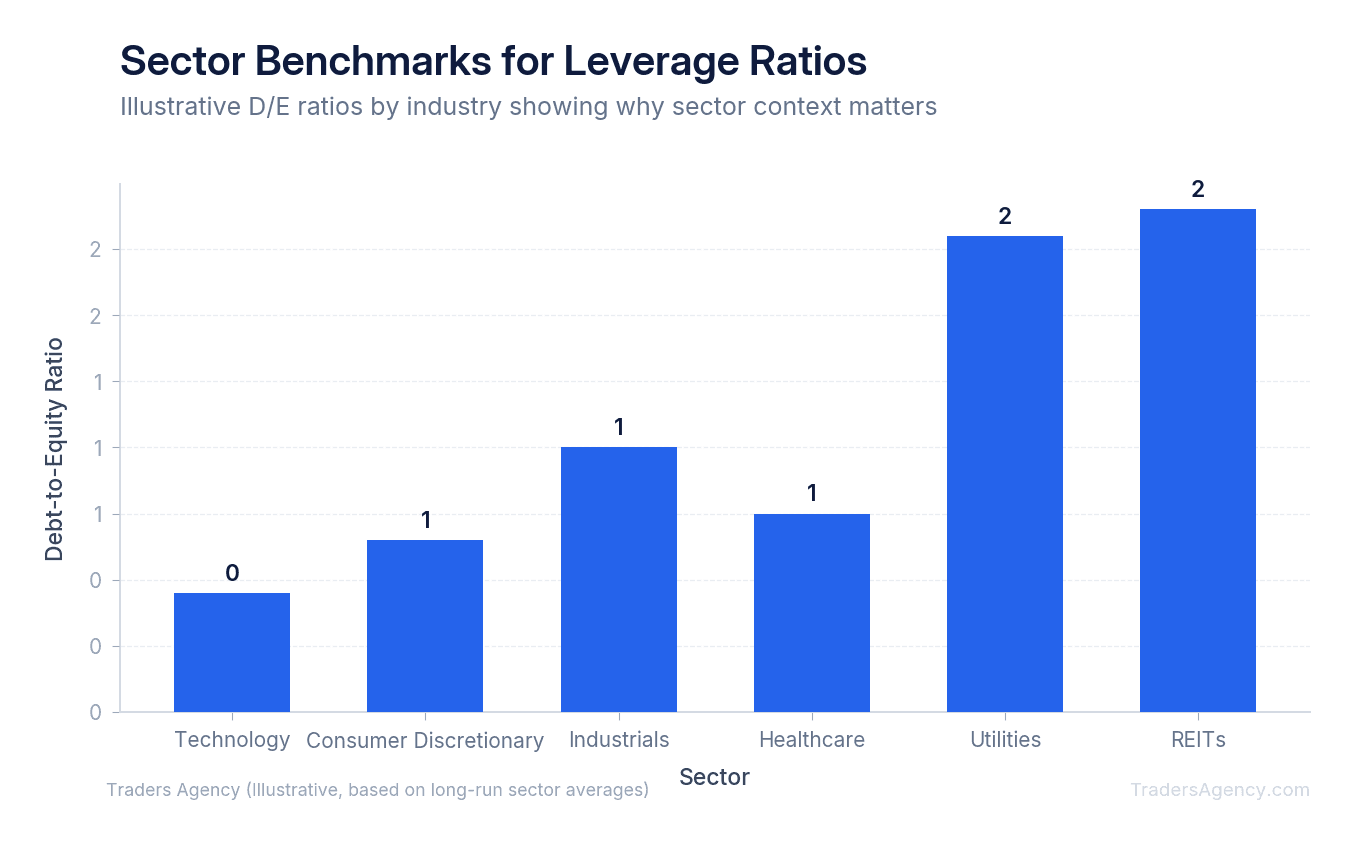
You should never compare the debt load of a software startup to the debt load of a power company. They operate under completely different financial realities.
| Sector | Typical D/E Range | Why |
|---|---|---|
| REITs & Utilities | 1.5 - 2.0 | Highly predictable cash flows from rent and utility bills. Banks lend at favorable rates. |
| Industrials & Manufacturing | 0.8 - 1.2 | Significant capital equipment needs, but revenues can be cyclical. |
| Technology & Software | 0.3 - 0.6 | Low physical infrastructure costs. Revenue can swing sharply. Growth funded primarily by equity. |
Real Estate Investment Trusts (REITs) and utility companies have highly predictable cash flows. People pay their power bills and rent every single month. Because this income is so stable, banks are willing to lend these companies massive amounts of money at favorable rates. A ratio of 1.8 for a utility company is completely normal and generally safe.
Conversely, a software company might experience wild swings in revenue. They do not have expensive factories or land to use as collateral. If a tech company has a ratio of 1.8, that is a massive red flag. We expect tech companies to fund their growth primarily through equity.
How Do Rising Interest Rates Increase Risk for Overleveraged Companies?
Rising interest rates significantly increase the cost of borrowing for overleveraged companies. When central banks raise rates, companies with high debt-to-equity ratios must pay more to service their loans. This higher interest expense directly reduces their profit margins and leaves less cash available for dividends or business expansion. You can track the Federal Reserve's rate decisions to stay ahead of these shifts.
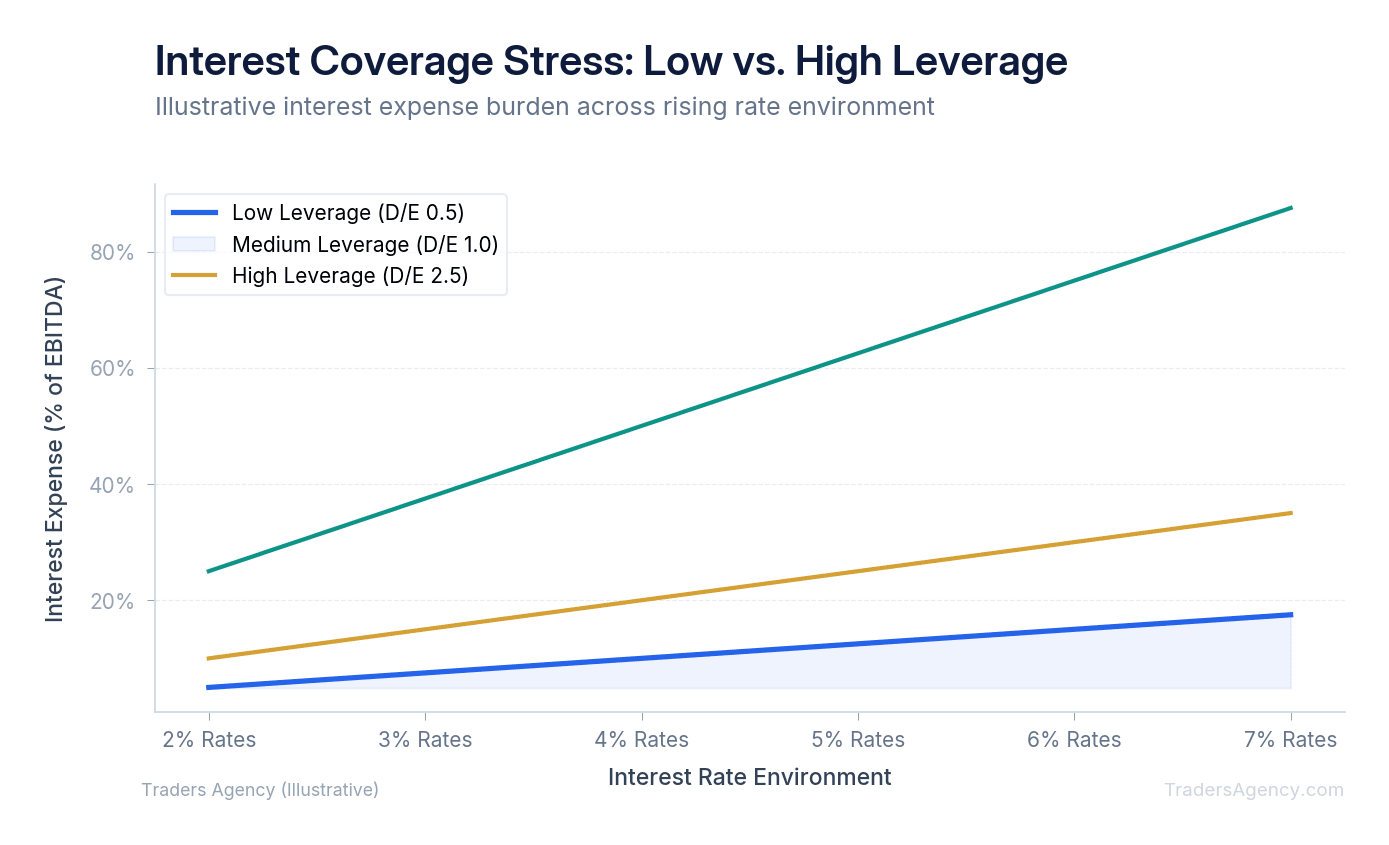
When interest rates are near zero, companies can afford to carry massive debt loads. The monthly payments are tiny. But debt is rarely locked in forever.
Corporate debt eventually matures and must be refinanced. Here's a simple example of how that plays out:
| Scenario | Loan Amount | Interest Rate | Annual Interest Payment |
|---|---|---|---|
| Original Loan | $100 million | 2% | $2 million |
| Refinanced Loan | $100 million | 6% | $6 million |
| Increased Cost | +$4 million |
That extra $4 million comes directly out of the company's profits. If the business has extreme leverage, this sudden increase in expenses can wipe out their entire net income. This is why our team pays close attention to macroeconomic conditions when evaluating debt metrics. A debt load that looks safe in a low-rate environment can become toxic when rates rise.
Where Can You Find Financial Data for Any Stock?
You do not need to be a Wall Street accountant to find this information. Publicly traded companies are legally required to publish their financial data. Here is the exact process our team uses to find and calculate these metrics:
- Locate the Official SEC Filings: The most accurate source of financial data is the EDGAR database on the SEC website. Look for the company's 10-Q (quarterly report) or 10-K (annual report). These documents contain the official, unedited balance sheet.
- Find the Balance Sheet: Open the report and scroll to the financial statements section. Look specifically for the "Consolidated Balance Sheets." This page lists everything the company owns and everything it owes.
- Extract the Key Numbers: You need to locate two specific line items. First, find the line labeled Total Liabilities. Second, find the line labeled Total Shareholders' Equity (sometimes called Total Stockholders' Equity).
- Run the Calculation: Divide the total liabilities by the total equity. Compare your result against three or four direct competitors in the exact same industry. If your target company has a significantly higher ratio than its peers, you need to investigate why before buying the stock.
Many online brokerage platforms and financial screeners will calculate this number for you automatically. However, we prefer to check the raw SEC filings ourselves. Financial websites sometimes use outdated numbers or calculate the formula differently. Doing the math yourself ensures you are basing your trades on accurate, up-to-date information.
How to Use Debt Metrics for Risk Management
You can use debt metrics to adjust your position sizing and set strict risk management rules. When trading companies with high debt loads, you should reduce your total capital allocation. A heavily indebted company carries a higher risk of sudden price drops, requiring tighter stop losses.
Our team never allocates a full position size to a company with a debt-to-equity ratio far above its sector average. We treat that excess debt as a fundamental warning sign.
If you decide to trade a company with high debt, you must protect your capital. Here's how we approach it:
- Use hard stop losses. If the market turns against the stock, the presence of massive corporate debt can accelerate the selloff. Institutional investors will dump shares of indebted companies first during a market panic.
- Cut your position size. If your standard position size is 5% of your account, consider cutting that to 2.5% for a company with questionable debt levels.
- Monitor refinancing dates. Know when the company's major debt tranches mature. A refinancing event in a high-rate environment can trigger sharp price declines.
- Watch the interest coverage ratio. If it drops below 1.5x, the company is struggling to cover its interest payments. That is your signal to tighten stops or exit entirely.
Risk Warning: A company with a debt-to-equity ratio far above its sector average carries elevated bankruptcy risk. Never allocate a full position to these trades. Reduce your size, set hard stop losses, and be prepared to exit quickly if fundamentals deteriorate.
This simple adjustment protects your trading account from catastrophic fundamental failures. Debt analysis is not just an academic exercise. It is a practical risk management tool that should inform every position you take.
Want expert trading insights delivered daily?
Join thousands of traders who rely on Traders Agency for market analysis and trade ideas.
Join Traders AgencyKey Takeaways
- The debt-to-equity ratio compares total liabilities to shareholder equity, revealing whether a bank or the actual shareholders effectively own a company's assets.
- A high debt-to-equity ratio signals elevated bankruptcy risk, particularly when revenues decline unexpectedly, which is why strong sales figures alone can be misleading before a company collapses.
- When a company's ratio sits far above its sector average, the practical response is to reduce position size, set hard stop losses, and monitor whether the business can still cover its interest payments.
- Rising interest rates directly amplify risk for overleveraged companies because higher borrowing costs eat into the cash flow needed to service existing debt.
- Debt analysis is a live risk management tool, not just a screening filter. Watching for deteriorating interest coverage is a concrete exit signal, not a background concern.
DISCLAIMER: Traders Agency does not offer financial advice. The information provided is for educational purposes only and should not be considered financial advice. Traders Agency is not responsible for any financial losses or consequences resulting from the use of the information provided. Trading carries inherent risks and may not be suitable for all individuals. You are advised to conduct your own research and seek personalized advice before making any investment decisions, recognizing the potential risks and rewards involved.
See more from Traders Agency on Google
Make us a preferred source and our market analysis will appear more prominently in your Google Search, Top Stories, and AI results.
Add to Preferred Sources