

Hey, Ross here:
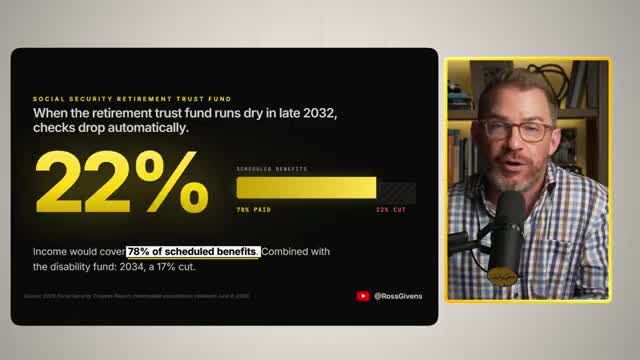
Social Security running out of money is not a talking point. It is math, and the math has a date attached to it: late 2032. That is when the retirement trust fund hits zero and checks automatically drop to about 78 cents on the dollar. A 22% pay cut for every retiree in America, all at once.
If you are under 60, that is your paycheck they are arguing about. If you have a job right now, you are the one they want to send the bill to.
The fight blew up on social media last week after a poll showed 89% of Americans 65 and older would rather protect their own benefits than protect younger workers from tax hikes. What that poll actually asked is worse than the headline suggests.
Why Was There Never a Social Security Account?
Bottom Line: Social Security running out refers to the trust fund, not the program itself: in late 2032 automatic checks fall to about 78% of scheduled benefits unless Congress acts. The real fight is over who absorbs that gap, retirees facing cuts or workers facing tax hikes, and waiting to decide makes the eventual fix more painful.
Why the money is not sitting anywhere
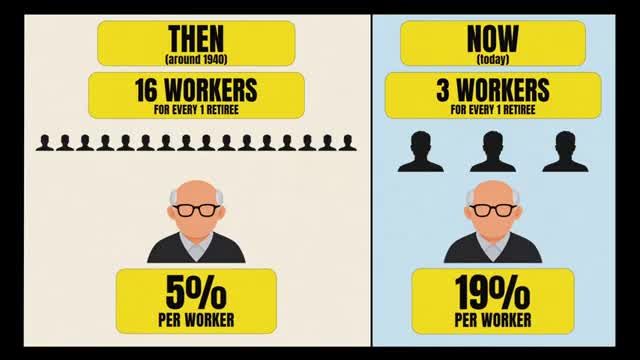
Social Security is running out of money because it was never a savings account. It is a pay-as-you-go system where today's workers fund today's retirees, and the ratio of workers to retirees has collapsed from 16.5-to-1 in 1950 to 2.6-to-1 today.
The story starts with a woman named Ida May Fuller, a legal secretary from Ludlow, Vermont. On January 31, 1940, she received check number one, the very first monthly Social Security check ever issued: $22.54.
Ida had worked under Social Security for about three years. Her total lifetime Social Security taxes, everything she ever paid in, came to $24.75.
She lived to be 100. By the time she died in 1975, she had collected $22,888.92.
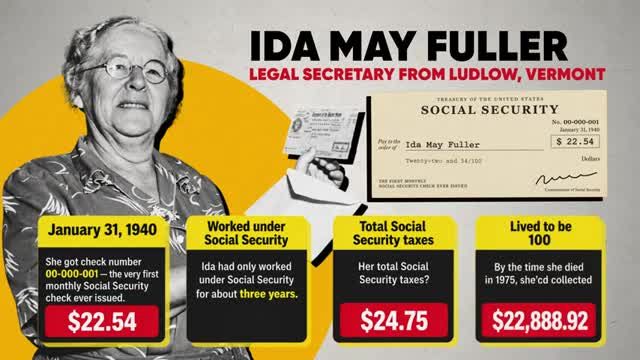
Where did that money come from? Not from Ida. Her $24.75 barely covered her first check. Everything after that came out of somebody else's paycheck.
That is the part most people miss. From day one, today's workers paid today's retirees.
The Cato Institute survey behind that 89% headline also found that 49% of Americans do not know their payroll taxes pay for current retirees right now, not their own future. Among people under 30, half think their money is being saved or invested for them.
It is not.
Call it what it is: the mechanism is identical to a Ponzi scheme. The people who got in early got paid by the people who came in later. The difference between this and Bernie Madoff's scheme is that Madoff's was a crime hidden from investors. This one is federal law printed on your pay stub.
And it only works as long as a lot more people keep coming in behind the people collecting checks.
The 1950 Number That Broke It
In 1950, there were 16.5 workers paying in for every one person collecting a check. Sixteen people split one retiree's check. Each worker covered about 6% of that benefit. Easy. No strain on the system at all.
By 1960, it was down to five workers per retiree. By 1975, about three, and it held around three for more than 30 years. That 3-to-1 ratio still worked because people did not live as long and healthcare was far cheaper than it is today, even after adjusting for inflation.
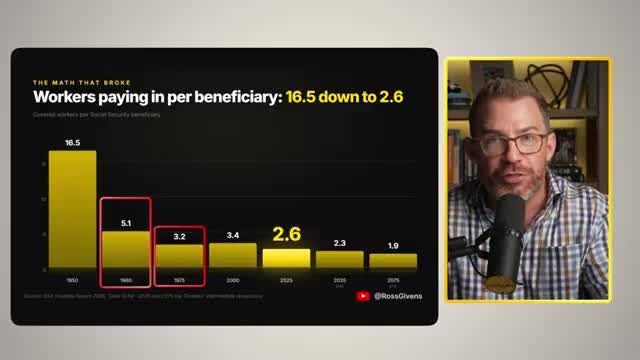
Today that number sits at 2.6 workers per retiree, and the trustees project it keeps sliding toward 1.9.
The math does not work anymore. That is the structural problem underneath every argument in this debate, and no amount of political rhetoric changes arithmetic.
Where Did the Social Security Surplus Go?
The boomers paid in. Washington spent it.
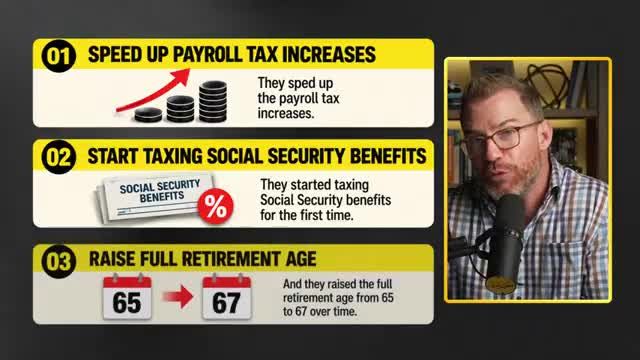
Back in 1982, the retirement fund nearly ran dry. In 1983, Congress passed a rescue. They sped up payroll tax increases, started taxing Social Security benefits for the first time, and raised the full retirement age from 65 to 67.
Who was working in 1983? The baby boomers. They were the young workers at the time, and they absorbed the higher tax rates and the later retirement age so the system could keep paying their parents.
For about 25 years after that, more money came in than went out. A huge surplus piled up. So where did it go?
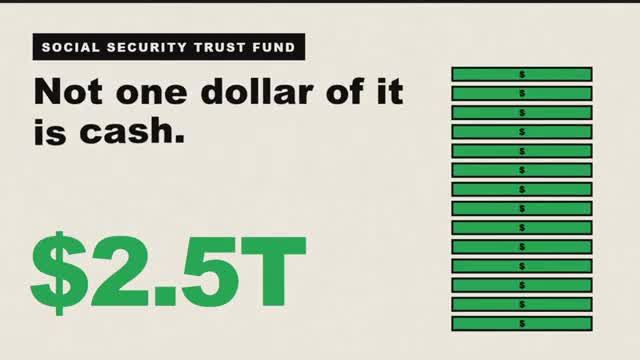
By law, every dollar that comes into the trust fund gets invested in government bonds. The Treasury takes the cash and hands the trust fund an IOU in return. The Social Security Administration says it plainly in its own words: the cash exchanged for those securities "goes into the general fund of the Treasury and is indistinguishable from other cash in the general fund."
Translation: the cash got dumped in the general hopper and spent on everything else the government does.
To be fair, those bonds are backed by the full faith and credit of the United States government, and the government has always paid them back. But paying back an IOU you wrote to yourself is like taking cash out of your left pocket, spending it, and sticking a note in your right pocket that says "I owe me."
When it comes time to cash that note, there are only three ways Washington can come up with the money. Tax it, borrow it, or print it.
And they are already cashing them in. The fund peaked at $2.91 trillion in 2020. It shrank by $160 billion in 2025 alone. Since 2021, it has paid out more than it brings in, even counting the interest on those bonds.
That trajectory is exactly how you get to late 2032.
Get an entire year of live weekly mentoring sessions, my newsletter, indicators, bonus reports, tons more. Click the link and I'll see you in the next live session.
Join my Black Ops Trading ClubWhat Happens to Social Security in Late 2032?
Once the IOUs are gone, the law requires Social Security to pay out only what comes in that year. That covers about 78 cents on every dollar promised. An automatic 22% cut to every check, with no vote required.
Congress could theoretically change that before it happens. They have not. And based on 1983, when they waited until the fund was nearly empty before touching it, I would not bet on them moving early this time either.
This is not a shutdown. It is a permanent pay cut that lands on everyone collecting at that moment, including boomers who will be somewhere between 68 and 86 years old by then, which happens to be the most active voting bloc by age.
Who Gets the Bill?
What that 89% poll really asked
The real fight comes down to a forced choice: cut benefits for current retirees, or raise taxes on current workers.
The Cato Institute and YouGov surveyed 2,000 Americans in October of last year. One question made people pick a side. Protect current retirees' benefits even if it means higher taxes on younger workers, or protect younger workers from higher taxes even if it means reducing benefits for current retirees.
Under 30, it was 47%. Roughly 50/50. Maybe the next generation is not as entitled as everyone thinks.
Support climbed with every age bracket the closer people got to retirement, all the way to 89% among those 65 and older.
The more revealing question came next. That same Cato poll asked people already collecting Social Security a tougher one: would you raise payroll taxes to keep your own benefits where they are, even if today's workers wound up getting back less than they paid in?
More than half of the people cashing checks right now are fine with younger workers paying in more than they will ever get back, as long as their own check does not change.
Part of me understands it. You worked 40 years. You built your whole retirement around that check, and nobody wants a 22% pay cut at 75. But if hard times must come, let them come now, and let me handle them so my children don't have to.
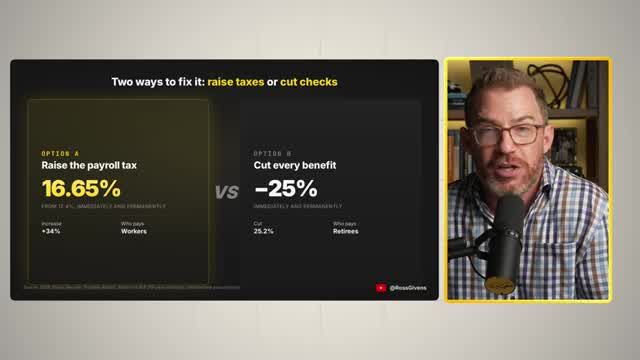
And this is not a small ask in dollar terms. The trustees say the payroll tax would have to jump from 12.4% to 16.65%, immediately and permanently, just to stay solvent. Or cut every benefit by about 25%.
Those are the two buttons.
If You're a Retiree Yelling at Your Screen
You are not wrong to be angry. You did pay in. You paid higher tax rates than your parents did for most of your working life, and in 1983 you got hit with tax hikes and a later retirement age so the system could keep paying your parents' generation.
Then the surplus you built got spent by Washington. The honest version of the story is that your money was taken from you, and now some people want to take from younger workers as restitution.
The boomers got screwed. Gen X got screwed. Millennials are getting screwed now. And the generation behind them stands to get it worst of all, because they do not have a larger working generation behind them to fill the gap the way every prior generation did.
The question is not whether retirees deserve their benefits. Of course they do. The money is simply not there. It was spent.
Three Ways This Plays Out
- Cut benefits. Current retirees take the hit while they are alive to feel it.
- Raise taxes on workers. Younger generations absorb it through higher payroll taxes, on top of federal income tax, state income tax, property taxes, vehicle taxes, and everything else already coming out of their paychecks.
- Print the money. The path I think is most likely, because it is a band-aid nobody feels right away. Our kids and grandkids absorb the cost later, with interest.
I am self-employed, so I already pay both halves: the 6.2% employee contribution and the 6.2% employer contribution. That is 12.4% before a dollar of income tax. It is getting to the point where you have to ask why bother working.
If Congress does nothing, which is what Congress does best, door number one opens automatically in late 2032. Everybody collecting at that point gets cut.
Neither party can fix this. Social Security running out of money is not a partisan problem, it is a math problem. And as long as they can convince you the other side wants to cut your check, you will keep voting for the team that promises it won't.
How Much Your Check Drops
Today, the average retired worker gets about $2,071 a month. Cut that by 22% and you are looking at roughly $1,615.
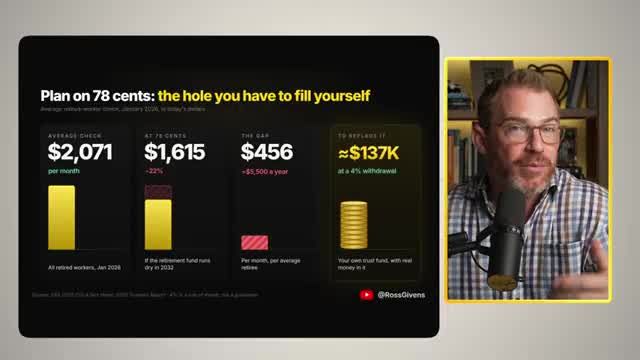
That $137,000 is the number nobody talks about. If you are under 60, take whatever your Social Security statement currently projects and multiply it by .78. That is the realistic figure to plan around, not the full promised amount.
What I Would Actually Do
I do not believe Congress is capable of building a plan that spreads this pain fairly across generations before 2032. I think they bicker until the fund hits zero and the cut happens on its own. So plan on 78 cents.
1. Calculate your real number
Take your official Social Security statement estimate and multiply it by .78. That is your realistic monthly income from the program, not the number printed on the page.
2. Find your monthly gap
Subtract the 78-cent number from your full projected benefit. For the average retiree today, that gap runs about $456 a month, or about $5,500 a year.
3. Build the nest egg to cover it
At a 4% withdrawal rate, a gap that size takes roughly $137,000 saved outside of Social Security. That is a real target, not a vague "save more" goal.
4. Plan for weaker dollars
Eventually Washington pays its IOUs the way it always has: tax, borrow, or print. Printing is the most likely path, which makes every dollar sitting in cash worth less. You may get the number of dollars you were promised. They just won't buy as much.
Plan for 78 Cents, Not 100
Ida May Fuller paid in $24.75 and walked away with almost $23,000. So did nearly everyone in those first few decades, because the law paid them to. Every generation since has gotten a worse deal.
Mine is next in line. I am 43, and I have already written off every dollar I have ever paid into the system. I am building my own trust fund, my own nest egg, and if I were you, I would think seriously about doing the same.
Take your Social Security statement, multiply by .78, find your gap, and build toward covering it yourself. That is the only plan that does not depend on Washington agreeing on anything.
Get an entire year of live weekly mentoring sessions, my newsletter, indicators, bonus reports, tons more. Click the link and I'll see you in the next live session.
DISCLAIMER: Traders Agency does not offer financial advice. The information provided is for educational purposes only and should not be considered financial advice. Traders Agency is not responsible for any financial losses or consequences resulting from the use of the information provided. Trading carries inherent risks and may not be suitable for all individuals. You are advised to conduct your own research and seek personalized advice before making any investment decisions, recognizing the potential risks and rewards involved.
See more from Traders Agency on Google
Make us a preferred source and our market analysis will appear more prominently in your Google Search, Top Stories, and AI results.
Add to Preferred Sources