
What is exhaustion gap trading? It's a technical strategy where we identify the final, volume-heavy price jump at the end of a long trend and anticipate a sharp reversal. You've probably seen this happen before: a stock opens significantly higher on massive volume, only to stall out and crash by noon.
Our team sees traders get trapped in these moves every single week. We're going to walk you through how to spot these traps and profit from the reversal. By the end of this guide, you'll know exactly how to identify these setups, execute them with defined risk, and avoid common pitfalls.
What Are Exhaustion Gaps in Trading?
Bottom Line: Exhaustion gap trading is a reversal strategy built on recognizing when a trend's final surge is likely running out of fuel, not a guaranteed outcome. Execution discipline, particularly closing positions that fail to fill by end of session, is what the article frames as the difference between consistent profitability and giving back gains on a single bad hold.
Exhaustion gaps are sudden price jumps that occur at the very end of an extended uptrend or downtrend. They represent a final surge of panic buying or selling before the prevailing trend collapses. Traders use these patterns to enter reversal positions as the gap begins to fill.
Think of a marathon runner sprinting the final 100 yards of a race. They expend all their remaining energy in one explosive burst. Once they cross the finish line, they collapse because there is nothing left in the tank. Financial markets behave the exact same way.
Key Concept: An exhaustion gap represents the last gasp of a dying trend. Late retail buyers capitulate and enter the market out of fear of missing out, while institutional sellers use this sudden flood of liquidity to unload their massive positions.
Once the institutional selling absorbs all the retail buying pressure, the price stalls. The lack of new buyers causes the price to reverse sharply. We teach our members to wait for this exact moment of failure to enter a high-probability reversal trade.
What Are the Types of Gaps in Trading?
The four main types of gaps in trading are common gaps, breakaway gaps, runaway gaps, and exhaustion gaps. Understanding the differences is your first step toward profitability. If you trade a breakaway gap thinking it's an exhaustion gap, you'll get run over by a massive new trend. We categorize gaps based on where they occur within the broader market structure.
| Gap Type | Where It Occurs | Volume Characteristics | Fill Probability |
|---|---|---|---|
| Common Gap | Range-bound markets | Low to average | High (fills within days) |
| Breakaway Gap | End of consolidation | High, sustained | Low (rarely fills quickly) |
| Runaway Gap | Middle of a strong trend | Above average, controlled | Moderate |
| Exhaustion Gap | End of an extended trend | Massive, abnormal spike | Very high (fills quickly) |
Common gaps usually appear in range-bound markets. They carry very little predictive value and often fill within a few days. Breakaway gaps occur when a stock explodes out of a long consolidation period on high volume. These gaps rarely fill immediately.
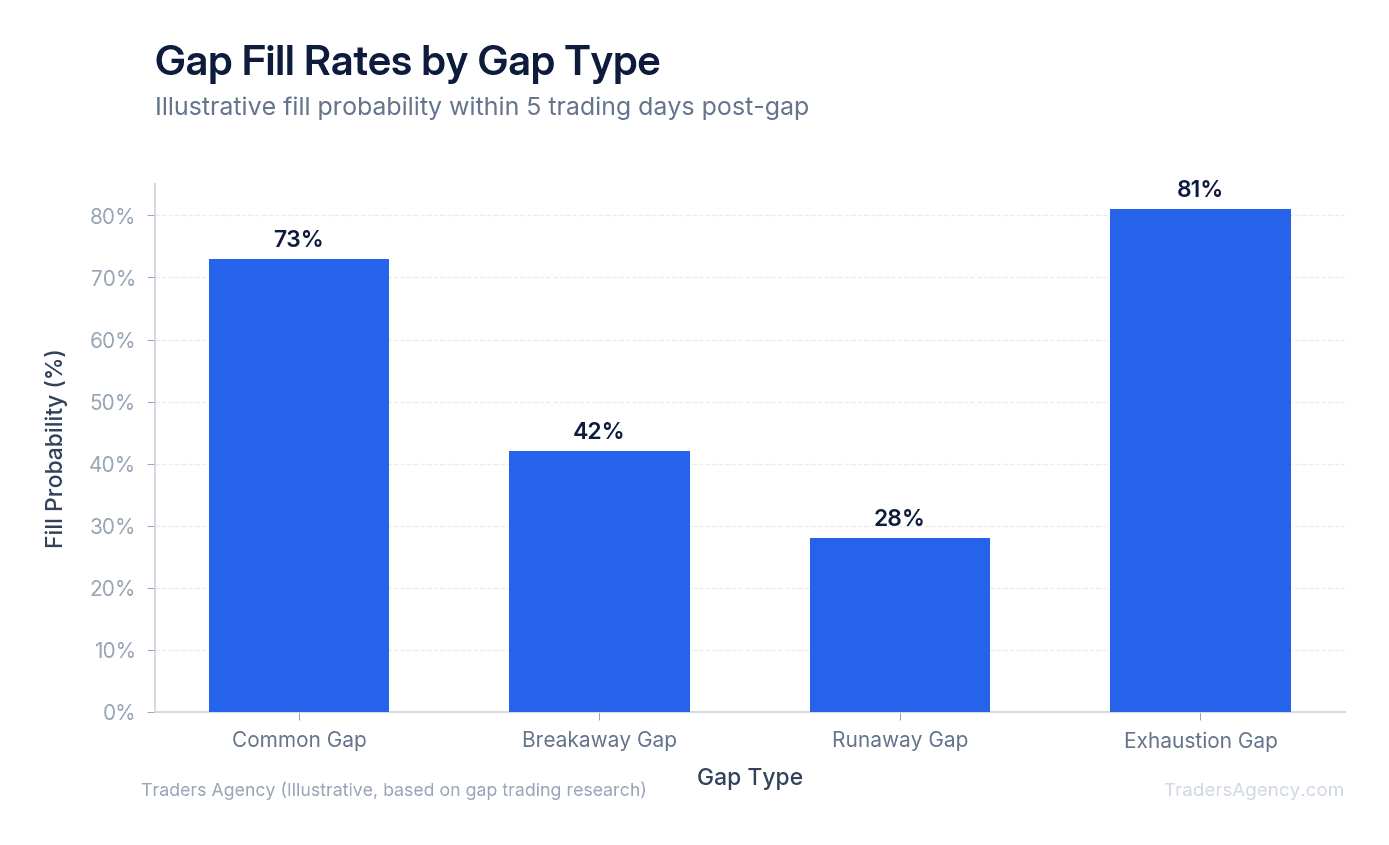
Runaway gaps happen in the middle of a strong trend. They confirm that the current momentum is accelerating. Exhaustion gaps appear after a prolonged trend has already run its course. Based on established technical analysis principles documented in CME Group educational resources, exhaustion gaps have a very high probability of filling quickly once the reversal is confirmed.
Exhaustion Gap vs Runaway Gap: How Do They Differ?
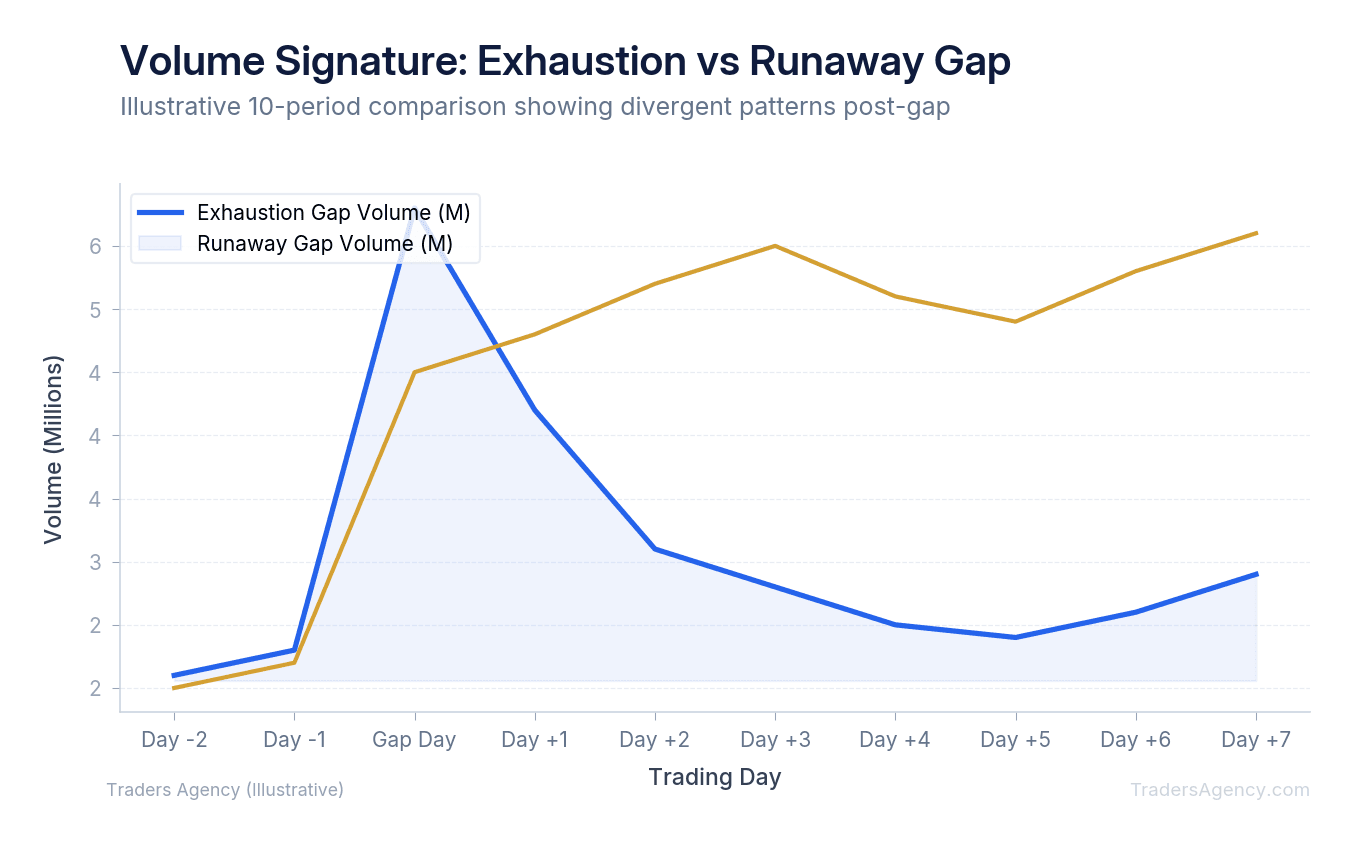
The primary difference between an exhaustion gap and a runaway gap is the subsequent price action and volume. Runaway gaps occur mid-trend with steady volume and immediate continuation. Exhaustion gaps occur late in a trend with massive volume spikes followed by a failure to advance further.
Confusing these two patterns is a fast way to lose money. A runaway gap tells you to hold your winning position or add to it. An exhaustion gap tells you to take profits and prepare for a reversal.
We prefer to look at the preceding trend duration. If a stock has been rallying for three days and gaps up, it's likely a runaway gap. If a stock has been rallying for three weeks and goes parabolic, it's a prime candidate for an exhaustion gap pattern.
Volume is your ultimate lie detector here. A runaway gap will have higher-than-average volume, but it will look controlled. An exhaustion gap will print a massive, abnormal volume spike that dwarfs the previous trading sessions.
Pre-Market Assessment: Preparing for the Open
Pre-market assessment is how you determine gap types before the opening bell even rings. You must analyze pre-market volume, identify the news driver, and map out daily support and resistance levels. This preparation prevents emotional decision-making when the market opens.
We never recommend trading the open blindly. You need a structured routine:
- Check the pre-market volume. If a stock is gapping up on very light volume, it's likely a common gap that will fade quickly.
- Identify the news driver. Is the stock gapping up on a major earnings beat, or is it just reacting to a vague analyst upgrade? Major fundamental news often creates breakaway gaps. Weak or recycled news at the end of a long trend frequently creates exhaustion gaps.
- Zoom out to the daily timeframe. Mark your major support and resistance levels. If a stock is gapping directly into a massive multi-year resistance level after a long run, the probability of an exhaustion gap increases dramatically.
Watch Out: Trading the open without a pre-market plan is gambling, not trading. If you skip this preparation step, you're relying on emotion and reaction speed rather than analysis and probability.
Want expert trading insights delivered daily?
Join thousands of traders who rely on Traders Agency for market analysis and trade ideas.
Join Traders AgencyHow Do You Identify an Exhaustion Gap Pattern on a Chart?
To identify an exhaustion gap pattern on a chart, look for an extended prior trend, a significant gap at the open, and a massive volume spike that is at least double the average. The price must fail to make new highs or lows within the first hour of trading.
We teach our members to wait for the opening range to establish itself. The opening range is typically the high and low of the first 15 to 30 minutes of trading.
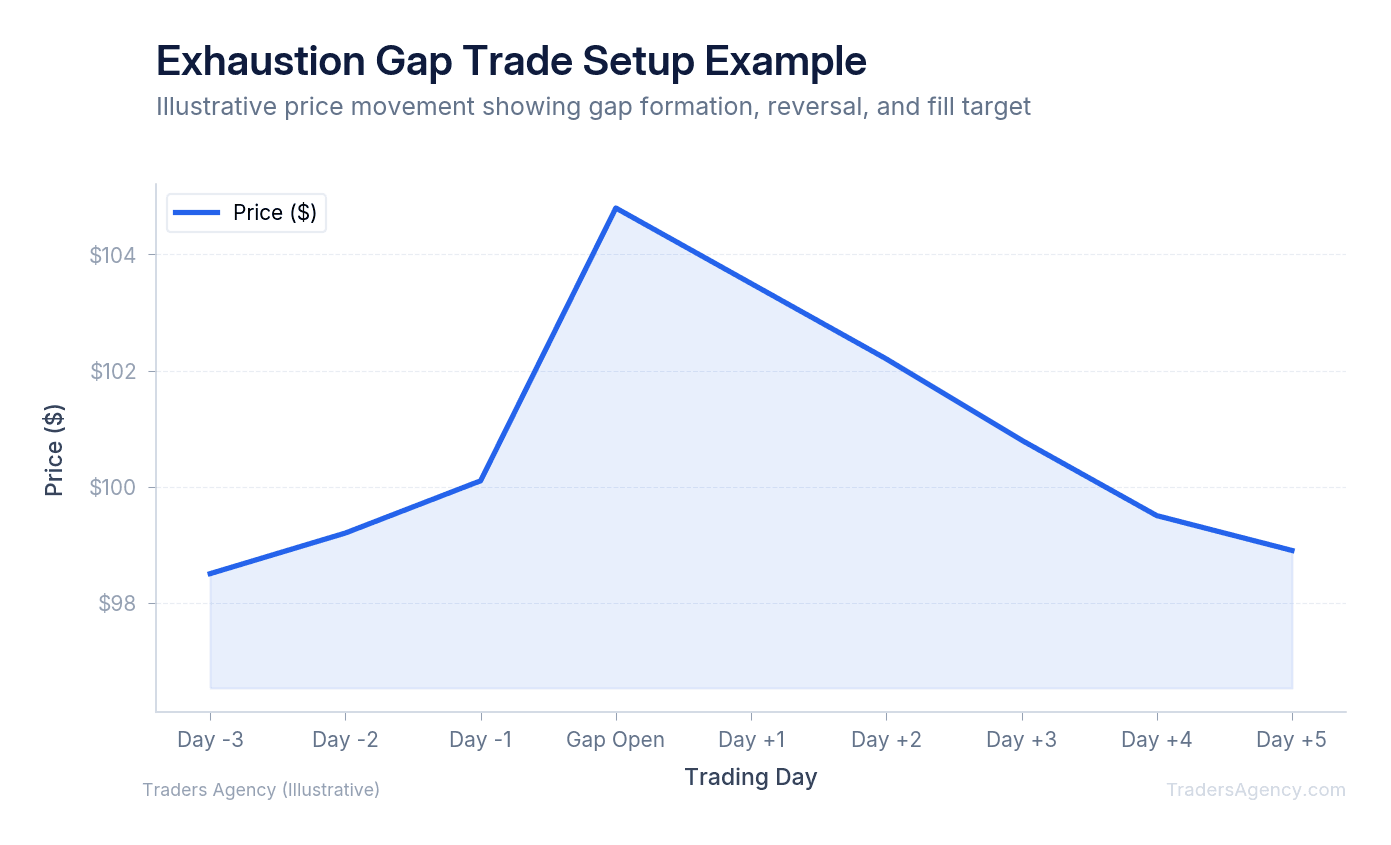
Here is the exact checklist we use to confirm the pattern:
- Extended Trend: The asset must have been trending strongly for several weeks.
- Abnormal Volume: The opening volume bar should be significantly larger than the previous days (at least 2x average).
- Failed Continuation: The price stalls almost immediately and cannot push higher.
- Range Breakdown: The asset breaks its opening range in the opposite direction of the gap.
If you see all four of these criteria, you have a highly probable exhaustion gap, meaning a reversal is imminent.
Exhaustion Gap Trading Strategy: Step-by-Step Entry and Exit
An effective exhaustion gap trading strategy requires waiting for the opening range to break, entering on the reversal, placing a stop loss above the gap high, and targeting the gap fill. This provides a structured, objective framework for trading high-volatility market opens.
Here's a concrete example using specific numbers. Assume Tesla (TSLA) has been in a massive uptrend, rallying from $180 to $220 over three weeks.
On Friday morning, TSLA gaps up to $235 at the open on retail hype. The stock pushes to $238 in the first ten minutes on massive volume, but then it stalls completely. By 9:45 AM, the stock drops back below the opening price to $234.
Trade Execution Steps
- Confirm the Setup: TSLA has rallied for three weeks, gaps up on abnormal volume, and fails to continue higher within the first 15 minutes.
- Enter the Trade: Place a short entry order at $233.50, confirming the downward momentum as it breaks below the opening range.
- Set Your Stop Loss: Place a hard stop loss at $238.50, just above the morning high.
- Define Your Profit Target: Target the previous day's closing price of $220, which is the gap fill level.
- Manage the Position: If the gap does not fill by end of day, close the trade at the market close.
| Parameter | Value |
|---|---|
| Stock | TSLA gapping to $235 |
| Entry Price | $233.50 (short) |
| Stop Loss | $238.50 (above morning high) |
| Profit Target | $220.00 (gap fill) |
| Risk per Share | $5.00 |
| Reward per Share | $13.50 |
| Risk-to-Reward Ratio | 1:2.7 |
This nearly 1-to-3 risk-to-reward ratio is exactly what we look for in every exhaustion gap trade.
What Are the Signals of a Bullish Exhaustion Gap Setup?
A bullish exhaustion gap happens at the bottom of a downtrend, signaling an upward reversal. It requires the same volume confirmation and failure to continue the prior trend as a bearish gap. Traders buy the stock when it breaks above the morning resistance level.
We want to make sure this guide covers both directions. Bullish setups often happen on capitulation days, when panicked retail investors sell everything at the open, creating a massive gap down.
Here's another example. Assume Advanced Micro Devices (AMD) has dropped steadily from $120 to $85. On Monday, it gaps down to $78 on bad earnings.
- Identify the Setup: AMD has been in a sustained downtrend for weeks and gaps down on massive volume.
- Watch for Failure: The stock hits $76 in the first five minutes, but institutional buyers step in. The price quickly rallies back to $79.
- Enter Long: Enter a long position at $79.50 as it breaks the morning high.
- Set Risk Parameters: Place stop loss at $75.50 and target the gap fill at $85.
| Parameter | Value |
|---|---|
| Stock | AMD gapping down to $78 |
| Entry Price | $79.50 (long) |
| Stop Loss | $75.50 (below morning low) |
| Profit Target | $85.00 (gap fill) |
| Risk per Share | $4.00 |
| Reward per Share | $5.50 |
| Risk-to-Reward Ratio | 1:1.4 |
How Do You Know If a Gap Will Fill?
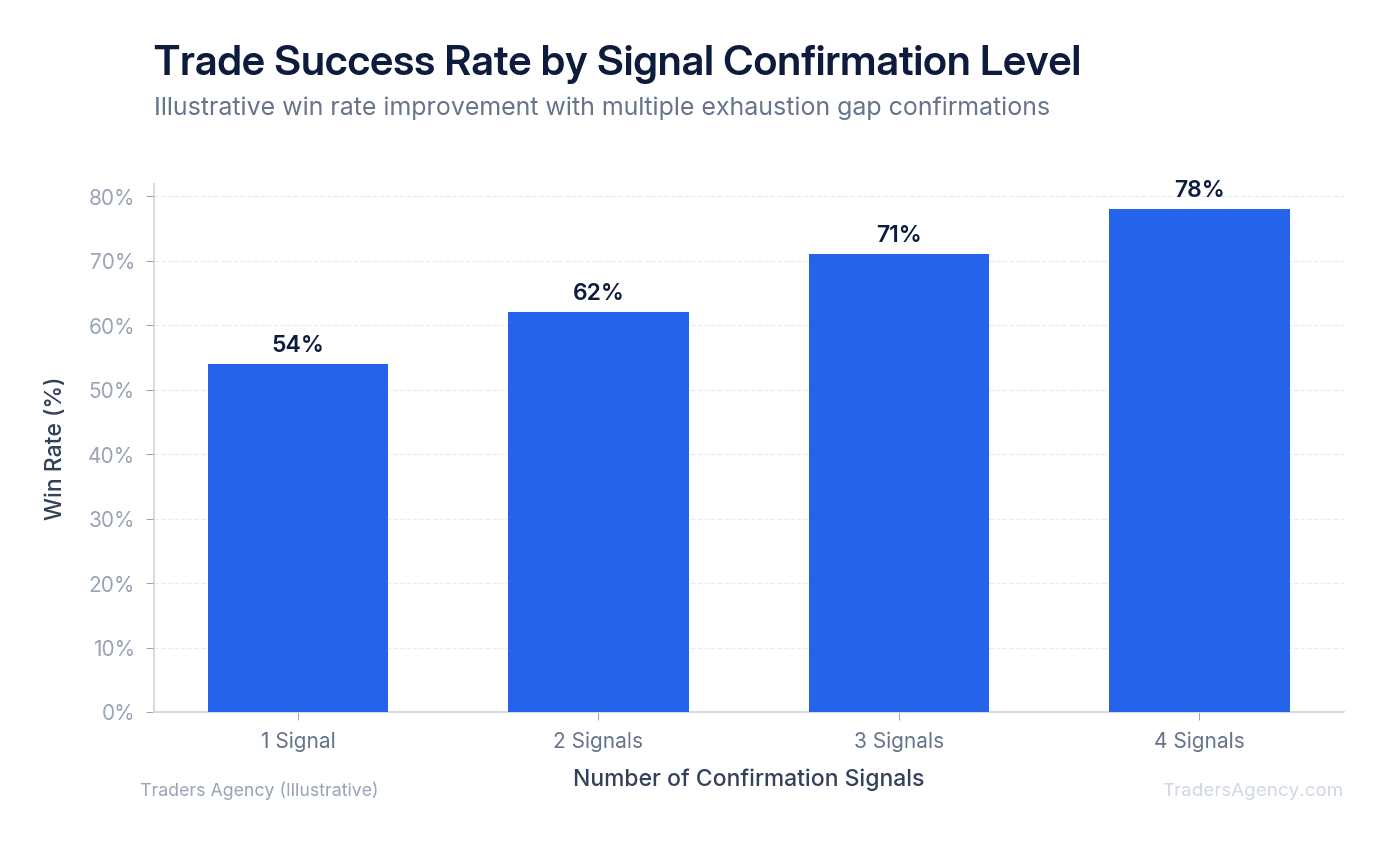
You know a gap will fill when the price breaks back through the previous day's closing level on increasing volume. We use multiple confirmation signals like moving average crossovers, bearish engulfing candlestick patterns, and momentum divergence to increase our win rate on gap fills.
We never assume a gap will fill just because it looks extended. We rely on multiple confirmation signals to avoid false entries.
The Relative Strength Index (RSI) is an excellent tool here. If the price gaps to a new high, but the 14-period RSI makes a lower high, you have bearish divergence. This tells you the upward momentum is fading fast.
We also use the Volume Weighted Average Price (VWAP). If a stock gaps up but immediately loses the VWAP level and cannot reclaim it, the sellers are in control. High-volatility opens often revert to the mean when institutional order flow dries up, a principle covered in SEC investor education materials on market mechanics.
Key Concept: The more confirmation signals that align (RSI divergence, VWAP rejection, candlestick reversal patterns, opening range breakdown), the higher your probability of a successful gap fill trade. We look for at least 3 out of 4 signals before entering.
Practical Application and Risk Management
Apply this strategy only in highly liquid stocks and ETFs during the first two hours of the trading day. Avoid trading exhaustion gaps in low-float penny stocks or during major macroeconomic announcements, as the risk of unpredictable volatility is too high.
Position sizing is your ultimate protection in gap trading. We prefer to risk no more than 1% to 2% of total account equity on a single trade. If your trading account size is $50,000, your maximum risk per trade should be $500 to $1,000.
| Account Size | Max Risk (1%) | Max Risk (2%) |
|---|---|---|
| $25,000 | $250 | $500 |
| $50,000 | $500 | $1,000 |
| $100,000 | $1,000 | $2,000 |
You must also respect your stop losses. If you short a gap up and the stock breaks above the morning high, you are wrong. Close the trade immediately. Hoping a runaway gap will turn into an exhaustion gap is a guaranteed way to blow up your account.
Risk Warning: Do not turn a day trade into a swing trade. If the gap does not fill by the end of the trading session, close the position. Market conditions change overnight, and holding gap reversal trades past the closing bell introduces unnecessary overnight risk that can wipe out your gains.
Our approach is disciplined and repeatable. We take our profits or our losses and move on to the next setup. That consistency is what separates profitable gap traders from those who give back their gains on one bad hold.
Want expert trading insights delivered daily?
Join thousands of traders who rely on Traders Agency for market analysis and trade ideas.
Join Traders AgencyKey Takeaways
- Exhaustion gaps appear at the end of extended trends and are characterized by a significant opening price jump on unusually high volume, often stalling and reversing within the same trading session.
- The pattern reflects late retail buyers entering out of FOMO while institutional players use the liquidity surge to unload positions, which can cause the move to collapse once buying pressure is absorbed.
- If the gap does not fill by the end of the trading session, the recommended approach is to close the position rather than hold overnight, as gap reversal trades carry meaningful overnight risk.
- Exhaustion gaps differ from breakaway gaps, which signal the start of a new trend, making correct classification essential before entering a reversal trade.
- Treating an exhaustion gap trade as a swing trade when it moves against you is identified as one of the most common ways traders give back gains on otherwise sound setups.
DISCLAIMER: Traders Agency does not offer financial advice. The information provided is for educational purposes only and should not be considered financial advice. Traders Agency is not responsible for any financial losses or consequences resulting from the use of the information provided. Trading carries inherent risks and may not be suitable for all individuals. You are advised to conduct your own research and seek personalized advice before making any investment decisions, recognizing the potential risks and rewards involved.
See more from Traders Agency on Google
Make us a preferred source and our market analysis will appear more prominently in your Google Search, Top Stories, and AI results.
Add to Preferred Sources



