
Volume profile analysis is an advanced charting study that displays trading activity over a specified time period at specific price levels. Unlike traditional volume bars that show how much volume traded during a specific time, volume profile reveals how much volume traded at a specific price. We'll walk you through how our team uses this tool to identify institutional support, locate hidden resistance, and pinpoint exact stop-loss levels.
You've probably seen this happen before. A stock breaks out above a major trendline, only to slam into an invisible wall and reverse sharply. Traditional technical analysis might not show any resistance at that level. But if you look at the volume traded at that price over the last 90 days, you often find a massive cluster of historical transactions. That invisible wall was never invisible. You just weren't looking at the right data.
By the end of this guide, you'll know how to construct composite profiles, identify high-probability trade locations, and manage risk using volume nodes. We'll show you exactly how to apply these concepts to real-world trading scenarios.
What Is Volume Profile?
Bottom Line: Volume profile analysis works because it shows where transactions actually occurred, not just when, which exposes the institutional footprints that traditional indicators ignore. The most reliable trades come from combining profile levels with order flow and macro context rather than treating any single node as a standalone signal. Master the composite profile and you stop guessing at support and resistance and start reading the market's own transaction history.
Volume profile is a visual representation of transaction volume distributed by price rather than time. It appears as a horizontal histogram on the y-axis of your chart, highlighting the specific price levels where the most and least trading activity occurred during a defined period.
Our team relies on volume profile analysis to understand where institutions are accumulating or distributing positions. When a market spends significant time and volume at a specific price, it establishes fair value based on auction market theory.
Think of it like a real estate heat map. If traditional volume tells you how many houses sold this month, volume profile tells you exactly which price neighborhoods saw the most bidding wars. This data allows advanced traders to anticipate where price will stall and where it will accelerate.
Key Concept: Traditional volume measures when trading happened. Volume profile measures where trading happened. That distinction is what makes this tool so powerful for identifying institutional activity at specific price levels.
What Are the Point of Control, Value Area, and VPVR in Volume Profile?
To apply volume profile analysis effectively, you need to understand its core mathematical components.
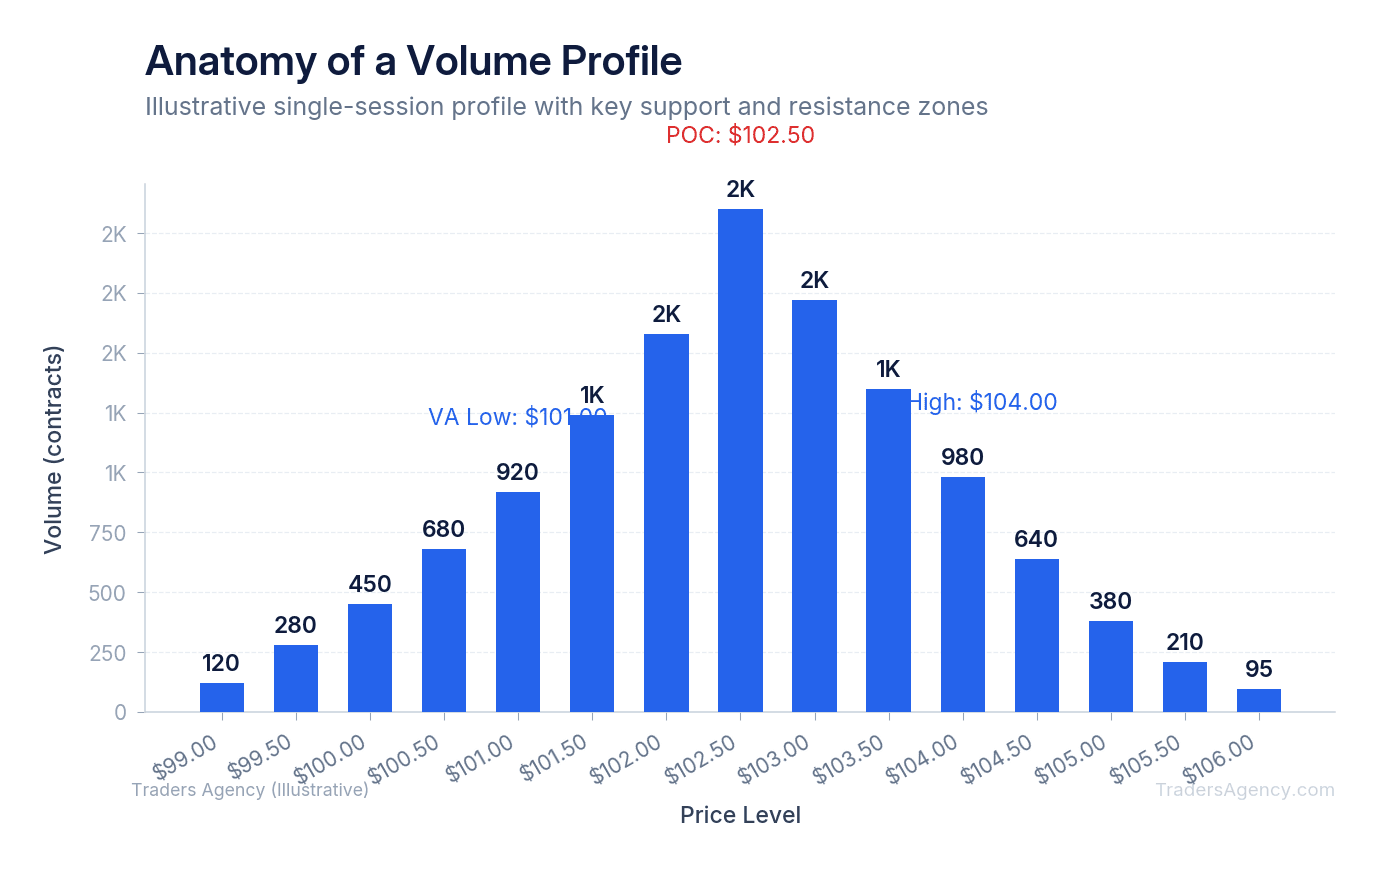
The Point of Control (POC) is the single price level with the highest traded volume for the selected time period. It acts as the center of gravity for the asset. Price is magnetically drawn to the POC, and when it arrives there, it tends to slow down and consolidate.
The Value Area (VA) represents the price range where a specified percentage of all volume traded. In professional trading, this is typically set to 70%, derived from one standard deviation in a normal distribution (which covers approximately 68.2% of the data).
- The upper boundary of this zone is the Value Area High (VAH).
- The lower boundary is the Value Area Low (VAL).
Many traders use the Volume Profile Visible Range (VPVR) indicator on their charting platforms. VPVR dynamically updates the profile based strictly on the price action currently visible on your screen, making it a flexible tool for quick analysis across different timeframes.
When price trades within the value area, the market is in balance. Buyers and sellers agree on the asset's worth. When price breaks outside the VAH or VAL, the market becomes imbalanced and begins seeking a new fair value. We use these breakouts to trigger directional trades.
How Do High and Low Volume Nodes Signal Support and Resistance?
High Volume Nodes (HVNs) and Low Volume Nodes (LVNs) are the two building blocks that make volume profile actionable. Understanding the difference between them is what separates traders who read profiles from traders who trade them profitably.
High Volume Nodes (HVNs) look like peaks extending outward on the profile histogram. They act as gravitational pulls. When price approaches an HVN, it tends to slow down, chop, and consolidate. Both buyers and sellers have historically agreed on value here, so it takes massive effort to push the price through. HVNs signal strong support and resistance because they represent price areas where heavy institutional trading previously occurred.
Low Volume Nodes (LVNs) look like valleys or deep gaps in the histogram. They represent prices the market rejected or skipped over quickly, such as during a gap-up on earnings. These are areas of low liquidity, meaning price will typically move through these zones rapidly with very little friction.
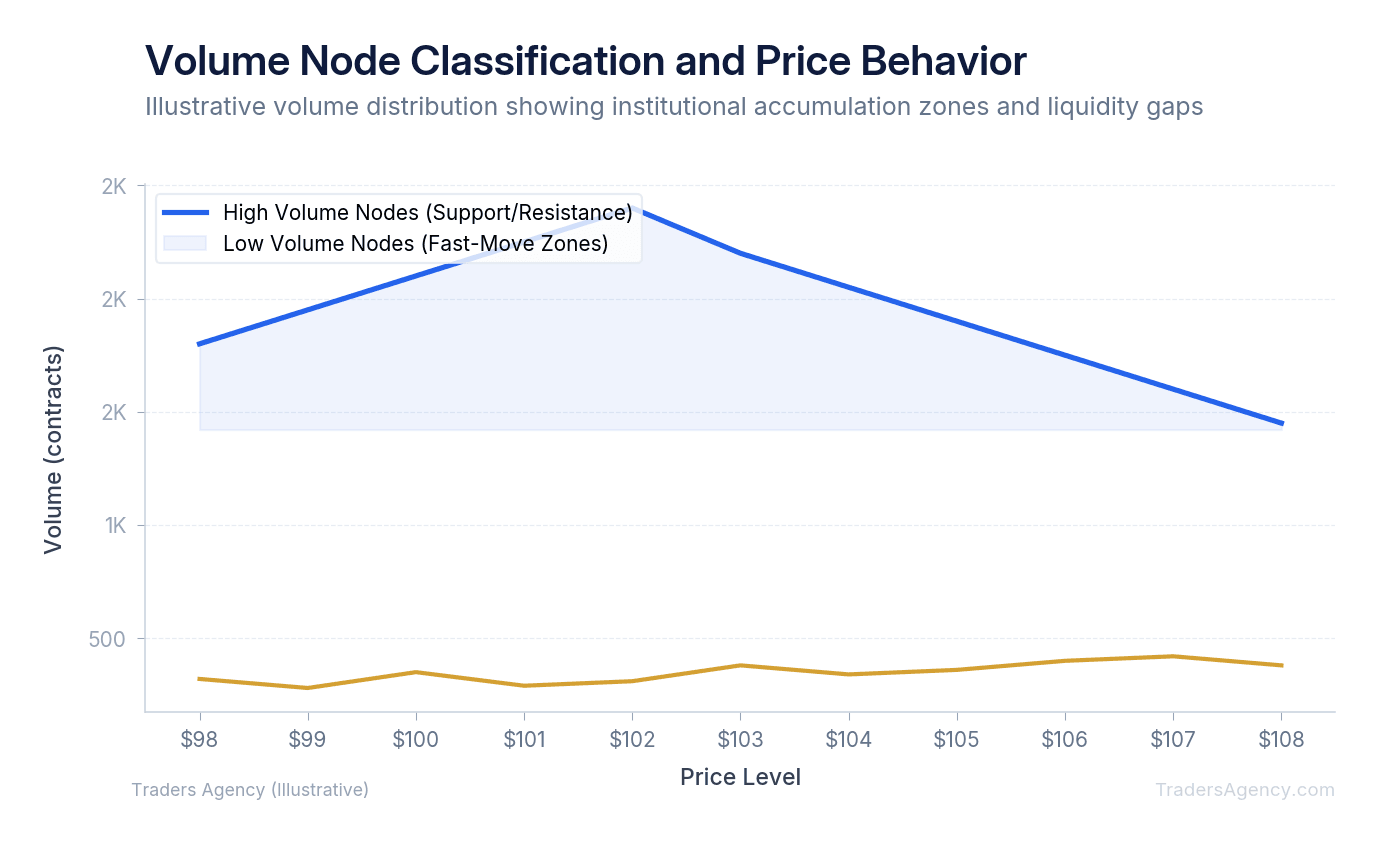
We teach our members to use LVNs as breakout triggers. If price enters an LVN, we expect a fast, directional move to the next available HVN. The lack of historical liquidity means there are very few limit orders waiting to slow the price down.
Key Concept: HVNs act like speed bumps. Price slows down and consolidates. LVNs act like open highway. Price accelerates through them. Knowing which zone you're trading into changes everything about your entry timing and profit targets.
When Should You Use a Session Profile vs. a Composite Profile?
Advanced traders must distinguish between short-term and long-term volume data to build a complete market thesis. A session profile measures volume at price for a single trading day. A composite profile aggregates volume at price across multiple days, weeks, or months.
We prefer to use session profiles for intraday mean reversion trades. If the E-mini S&P 500 futures (ES) open outside yesterday's value area but drift back inside, we target the previous day's POC. This is a classic value area play that works consistently in range-bound markets.
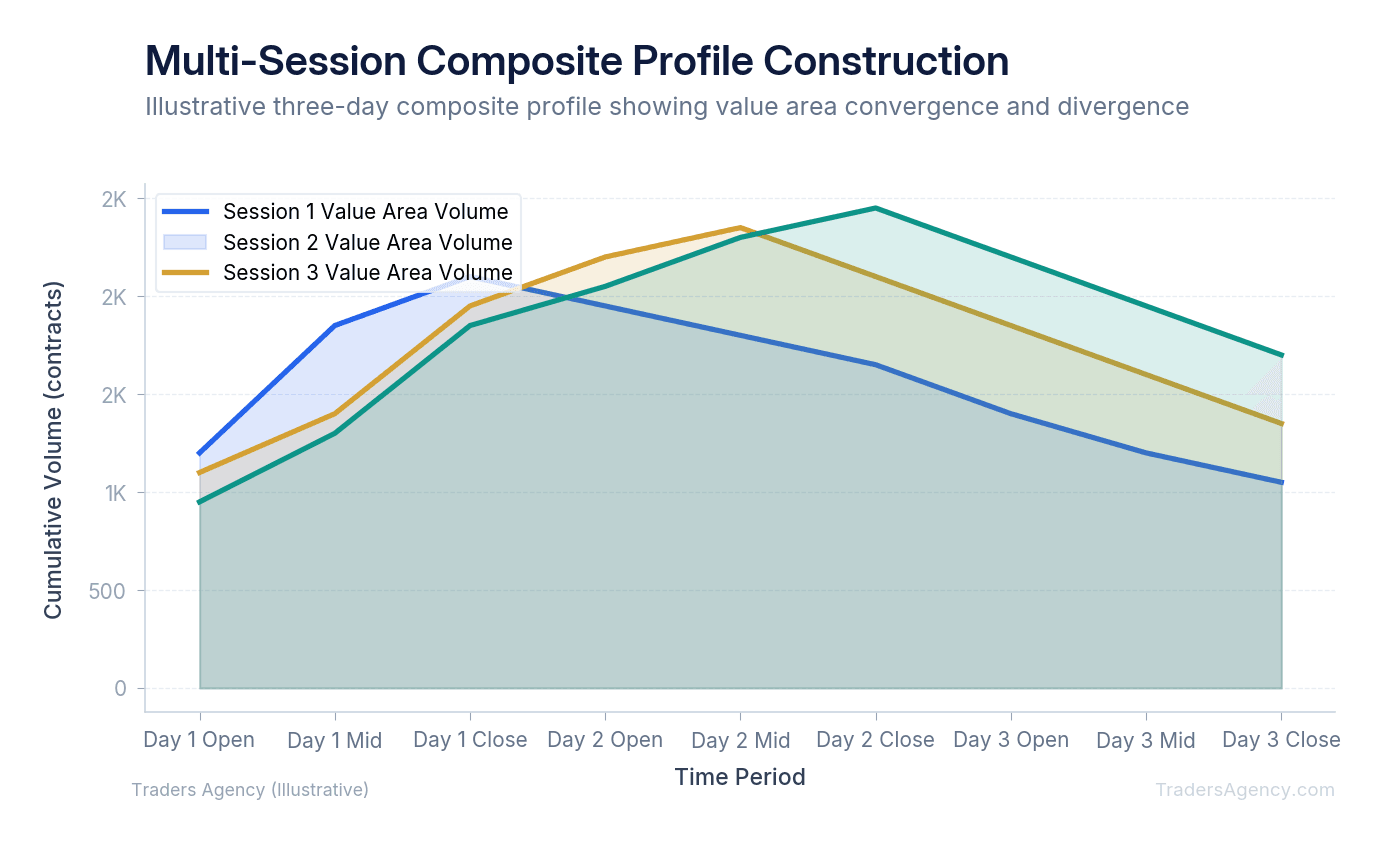
Composite profiles are better for swing trading and macro trend analysis. By merging a full quarter of data, you can identify massive institutional accumulation zones that a single-day chart completely hides. We often merge profiles manually to cover specific consolidation periods before a breakout.
| Profile Type | Best Use Case | Timeframe | Primary Signal |
|---|---|---|---|
| Session Profile | Intraday mean reversion | Single trading day | POC rotation, VA acceptance/rejection |
| Composite Profile | Swing trades, trend analysis | Multiple days to months | Institutional accumulation/distribution zones |
| VPVR | Quick visual analysis | Dynamic (visible chart range) | Context-dependent support/resistance |
Want expert trading insights delivered daily?
Join thousands of traders who rely on Traders Agency for market analysis and trade ideas.
Join Traders AgencyHow Does Volume Profile Work? A Step-by-Step Trade Example
Volume profile works by analyzing historical transaction data from exchanges like the CME Group to plot horizontal volume distributions, allowing traders to execute setups based on market auction theory. You set up a trade by identifying an imbalance, entering near a low volume node, and targeting a high volume node.
Here's a concrete options trading example using the SPDR S&P 500 ETF (SPY) to show exactly how we apply this.
- Identify the Setup: Assume SPY is currently trading at $510. You pull up a 30-day composite volume profile. You spot a massive HVN at $515, which serves as your logical profit target. Between $510 and $514, the profile shows a distinct LVN (a volume void). This gap in the histogram tells you there's very little historical liquidity to slow price down if it starts moving upward.
- Execute the Trade: Because price moves quickly through LVNs, you want a directional options position. As SPY breaks into the volume void at $510.50, you buy the SPY $512 Call expiring in 14 days for a $3.50 premium ($350 total risk per contract). Your thesis: the market will auction rapidly upward through the thin liquidity to reach the $515 HVN.
- Manage the Position: Monitor price behavior as it enters the LVN. If momentum stalls and price drops back below $510, the thesis is broken. Cut the trade immediately. If price accelerates through the void as expected, hold for the $515 HVN target where you expect consolidation and profit-taking.
| Parameter | Value |
|---|---|
| Underlying | SPY at $510 |
| Option Purchased | $512 Call, 14 DTE, $3.50 premium |
| Entry Trigger | Price breaks into LVN at $510.50 |
| Profit Target | $515 HVN |
| Total Risk | $350 per contract (full premium) |
| Scenario | SPY Price | Option Value | Profit/Loss |
|---|---|---|---|
| Best Case | $515 (reaches HVN in 2 days) | $5.50 | +$200 per contract |
| Stop-Loss Exit | $508 (rejects LVN entry) | $2.00 | -$150 per contract |
| Max Loss (hold to expiry) | Below $512 at expiration | $0.00 | -$350 per contract |
How to Combine Volume Profile with Order Flow for Higher Conviction
Volume profile analysis shows you the historical map, but order flow shows you the real-time traffic. We combine composite profiles with footprint charts and Level 2 data to confirm that buyers are actually defending a historical level before we commit capital.
If price drops to a major POC at $4100 on the ES futures, we do not blindly buy. We watch the footprint chart or the Depth of Market (DOM) for real-time order absorption. Here's the sequence we follow:
- Identify the level: Use your composite volume profile to locate the nearest HVN or POC where you expect institutional defense.
- Watch for absorption: On the footprint chart, look for aggressive sellers hitting the bid with large market orders while the price refuses to drop. This tells you passive limit orders are absorbing the selling pressure exactly where the volume profile suggested they would.
- Confirm the reversal: Wait for aggressive buyers to step in with market orders. You'll see the delta shift from negative to positive on the footprint chart.
- Execute the entry: Once absorption is complete and aggressive buyers are in control, take your long position with a stop below the LVN beneath the support level.
Watch Out: Trading volume profile blindly without order flow confirmation often leads to catching falling knives. The profile tells you where to look. The order flow tells you when to enter. You need both.
How Do You Manage Risk Using Volume Profile Levels?
Granular risk management separates professional traders from amateurs. Volume profile analysis provides exact mathematical locations for stop-loss placement based on market structure rather than arbitrary percentages.
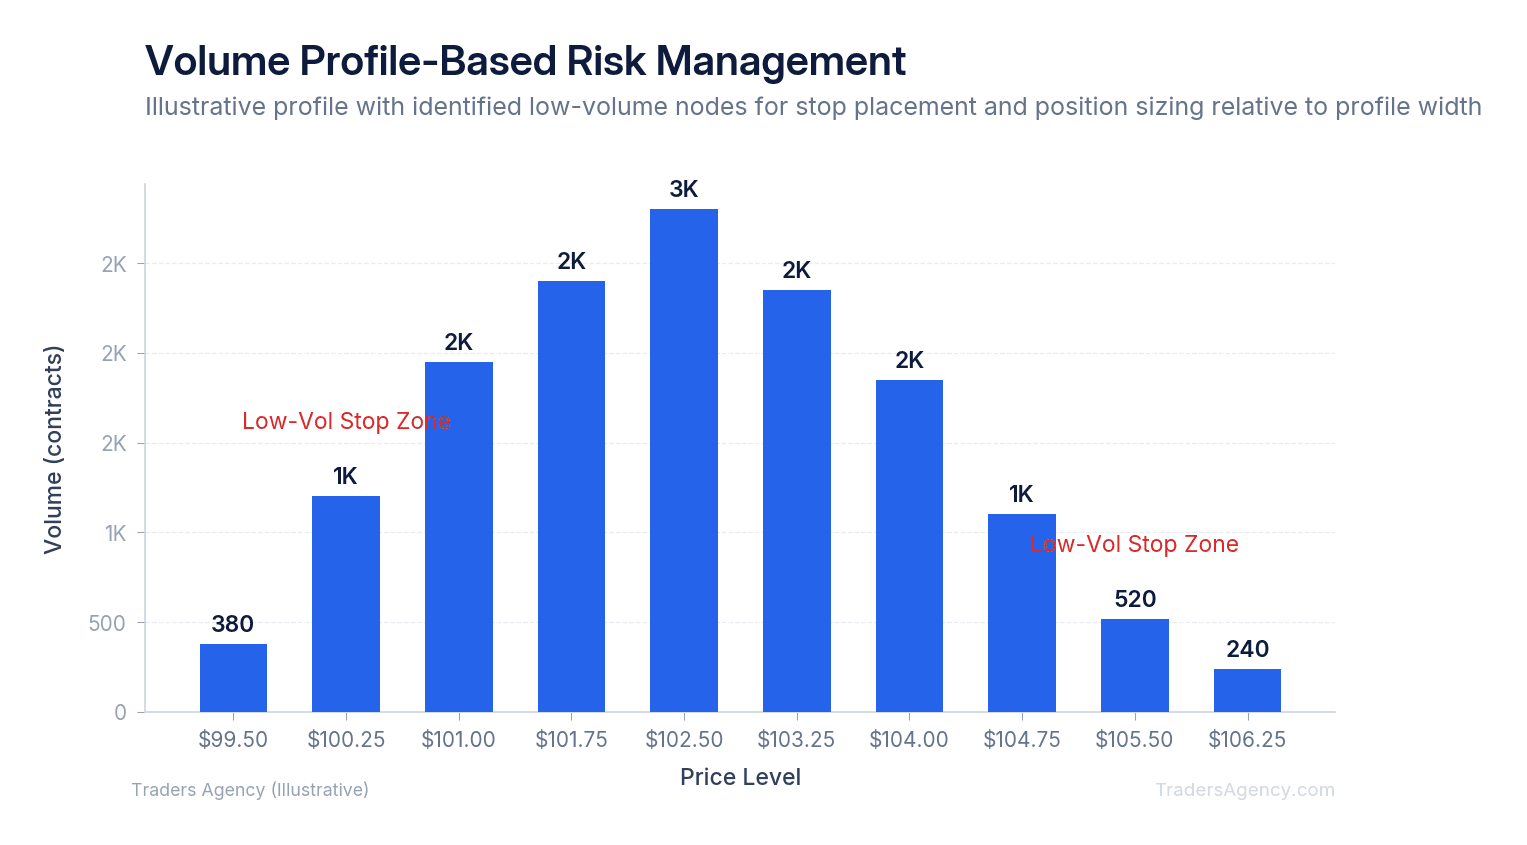
We place our stop-loss orders beyond the far edge of a Low Volume Node relative to our entry. Here's why: if price trades through an LVN, the premise of a support-bounce trade is invalidated. The fast-moving nature of the LVN will quickly carry the price away from your entry, meaning you want to exit before the acceleration worsens your loss. Be aware that stops placed inside LVNs may experience slippage due to the thin liquidity in these zones.
Position sizing should adapt directly to the width of the value area you're trading:
- Tight Value Areas: When the distance between VAH and VAL is narrow, use larger position sizes. You can place tighter stops just outside the value area, reducing your dollar risk per share.
- Wide Value Areas: When the profile is stretched over a large price range, reduce your position size by 50%. You need to accommodate the wider stop required to safely get outside the nearest LVN.
- Profile Extremes: Never place a stop exactly on a POC. The magnetic nature of the POC will almost certainly trigger your stop before the real directional move begins.
Watch Out: Placing stops directly on the POC is one of the most common mistakes we see. The POC attracts price like a magnet, and your stop will get triggered during normal consolidation before the actual move plays out. Always place stops through an LVN, not on an HVN or POC.
What Are the Disadvantages of Using Volume Profile?
The main disadvantage of using volume profile is that it relies entirely on historical data. Sudden news events or macroeconomic shifts can instantly invalidate established high volume nodes. Liquidity can dry up rapidly during volatile periods. When panic hits the market, historical volume nodes temporarily lose their gravitational pull, and price will slice through them regardless of past data. The SEC's investor education resources on market structure reinforce this point: liquidity is never guaranteed.
Here are the most common pitfalls we see traders fall into:
- Zooming in too far with VPVR: If you only look at two days of data on a 5-minute chart, a local POC might look like massive resistance. But zooming out to a daily chart might reveal that this specific price is just a minor blip within a massive long-term low volume void. Context is everything.
- Treating every POC as a permanent reversal point: In strongly trending markets, a POC can act as a launchpad rather than a ceiling. If heavy volume transacts at a high and buyers keep absorbing the supply, the breakout will be explosive.
- Ignoring the macro environment: Volume profile is a structural tool. It does not account for earnings announcements, Fed decisions, or geopolitical events. Always align your profile analysis with the broader market context before placing a trade.
Our approach is to treat volume profile as one layer in a multi-factor decision framework. Combine it with order flow, macro context, and sound position sizing. That's how you turn a powerful analytical tool into consistent, repeatable results.
Want expert trading insights delivered daily?
Join thousands of traders who rely on Traders Agency for market analysis and trade ideas.
Join Traders AgencyKey Takeaways
- Volume profile maps trading activity by price level, not by time, which reveals where institutional transactions clustered over a defined lookback period such as 90 days.
- The Point of Control is the single price level with the highest traded volume in a given session or composite range, making it the most reliable magnet for price during retracements.
- A composite profile built across multiple sessions exposes structural support and resistance that individual session profiles miss, giving traders a broader view of where real money has transacted.
- When heavy volume prints at a high and buyers continue absorbing supply, the resulting breakout tends to be explosive, because the overhead supply has already been cleared.
- Volume profile is a structural tool only. It does not account for earnings, Fed decisions, or geopolitical events, so it must be layered with macro context before any trade is placed.
DISCLAIMER: Traders Agency does not offer financial advice. The information provided is for educational purposes only and should not be considered financial advice. Traders Agency is not responsible for any financial losses or consequences resulting from the use of the information provided. Trading carries inherent risks and may not be suitable for all individuals. You are advised to conduct your own research and seek personalized advice before making any investment decisions, recognizing the potential risks and rewards involved.
See more from Traders Agency on Google
Make us a preferred source and our market analysis will appear more prominently in your Google Search, Top Stories, and AI results.
Add to Preferred Sources