
You've probably seen this happen before. A company announces a massive jump in quarterly profits, but the stock immediately drops 10% on the news. You check the headlines, and nothing makes sense. If the company is making more money, why are institutional investors dumping shares? The answer almost always comes down to the quality of that growth. Revenue growth vs. earnings growth analysis is a fundamental evaluation method that compares a company's total sales increases against its net profit increases. Wall Street professionals know that not all profit is created equal. We're going to walk you through how to spot the difference between genuine business expansion and temporary accounting tricks. Our team relies on these exact metrics to filter out weak companies. By the end of this guide, you'll know how to read these financial statements and apply them to your own stock screening process.
Is Earnings Growth the Same as Revenue Growth?
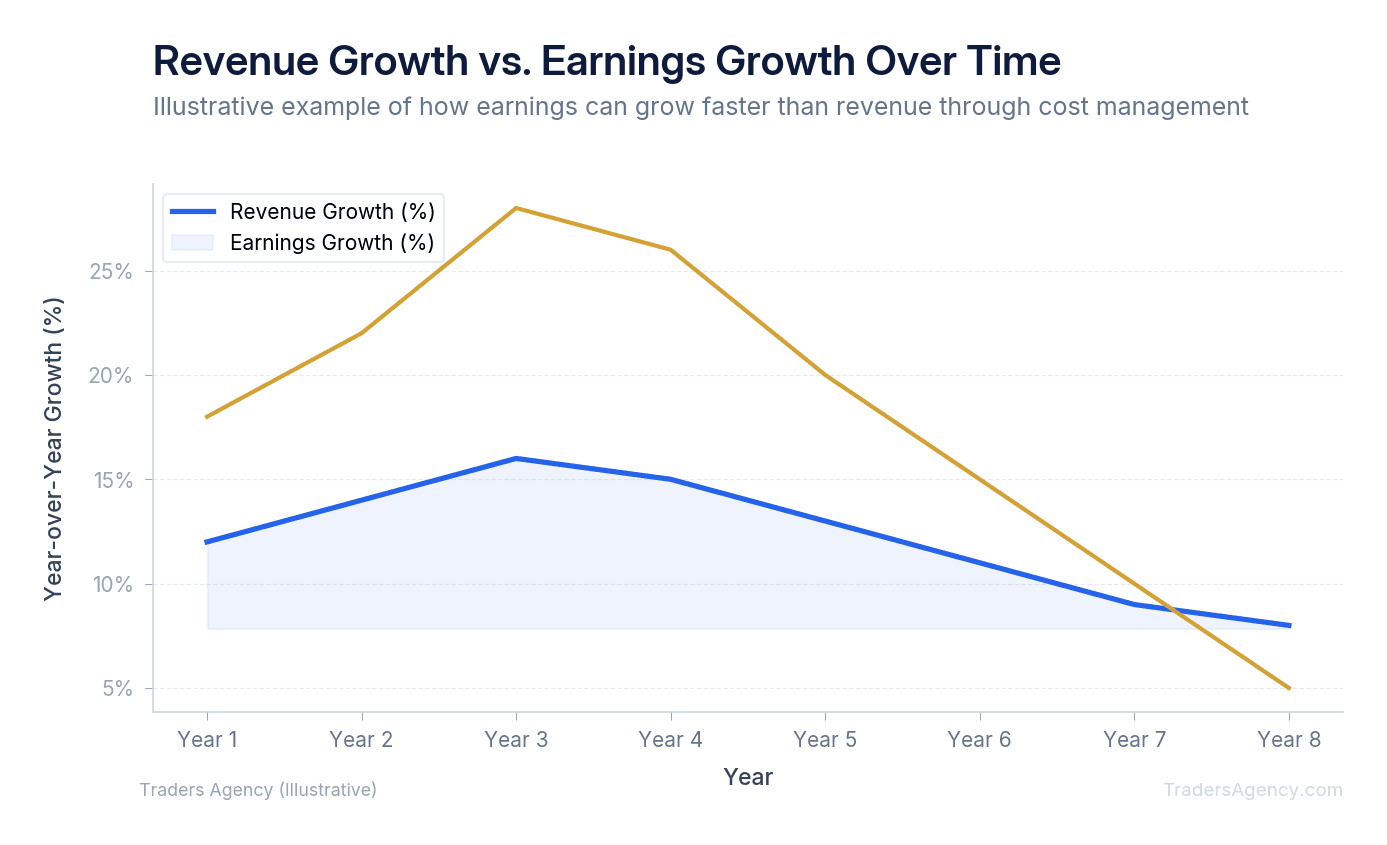
No, and confusing the two is one of the most common mistakes newer traders make. Revenue growth measures the increase in total money brought into a business before any expenses are deducted. Earnings growth measures the increase in net profit after subtracting all operating costs, taxes, and interest from that initial revenue.
We teach our members to think of revenue as the raw engine power of a business. It represents actual demand for a company's products or services. Earnings represent the actual speed of the car after factoring in vehicle weight and friction. A company can have high revenue growth but negative earnings if their expenses are out of control.
Conversely, a company can show positive earnings growth while revenue is shrinking. This divergence is a massive warning sign for investors. When you see profits rising but sales falling, the business is usually shrinking its way to profitability.
Key Concept: Revenue growth tells you whether customers are buying more. Earnings growth tells you whether the company is keeping more of what it collects. Both matter, but they answer very different questions about business health.
Why Is Revenue Harder to Manipulate Than Earnings?
Revenue is a straightforward metric. A company either sold a product to a customer, or it didn't. Earnings, on the other hand, are much easier for a management team to engineer.
Corporate executives are frequently compensated based on Earnings Per Share (EPS) targets. This creates a strong incentive to boost the bottom line, even if the core business is stagnating. We prefer to look at the top line because it reveals the true health of customer demand.
Here's a classic revenue growth example that illustrates this manipulation. Imagine Company XYZ reports flat revenue of $100 million for two consecutive years. However, they report a 15% increase in earnings. How did they pull this off without selling more products?
They likely used one of these common tactics:
- Firing 10% of their workforce to temporarily slash payroll expenses
- Cutting the research and development budget to zero
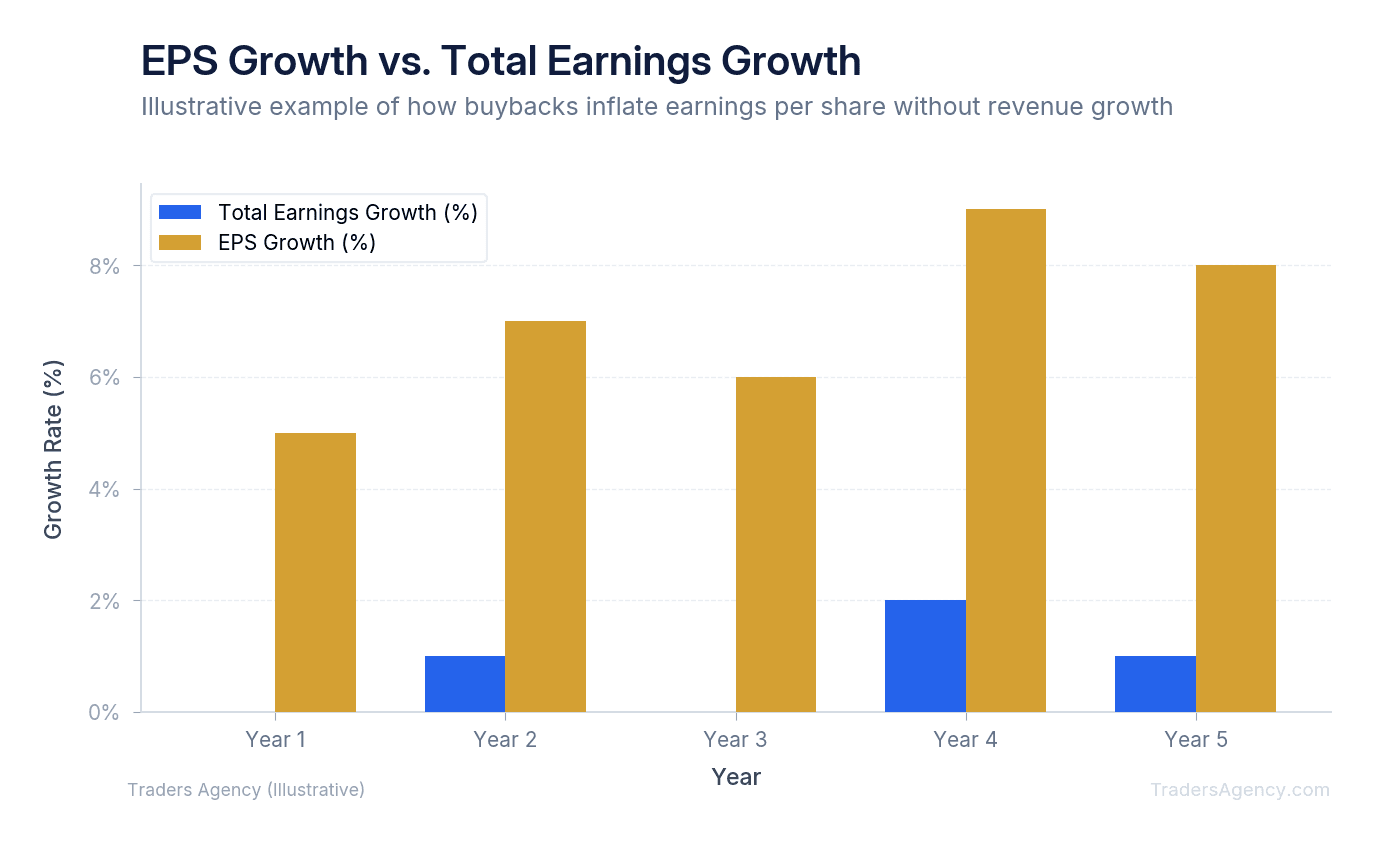
- Using corporate cash to buy back millions of shares of their own stock
- Selling off a valuable piece of real estate for a one-time cash injection
None of these actions improve the long-term viability of the business. Share buybacks are particularly deceptive. By reducing the total number of outstanding shares, the company divides the same amount of profit across fewer shares. The EPS goes up, but the actual business hasn't grown at all.
Watch Out: A company reporting strong earnings growth with flat or declining revenue is a red flag. Always check whether buybacks, layoffs, or asset sales are inflating the bottom line before taking a position.
What Is a Good Revenue Growth Rate?
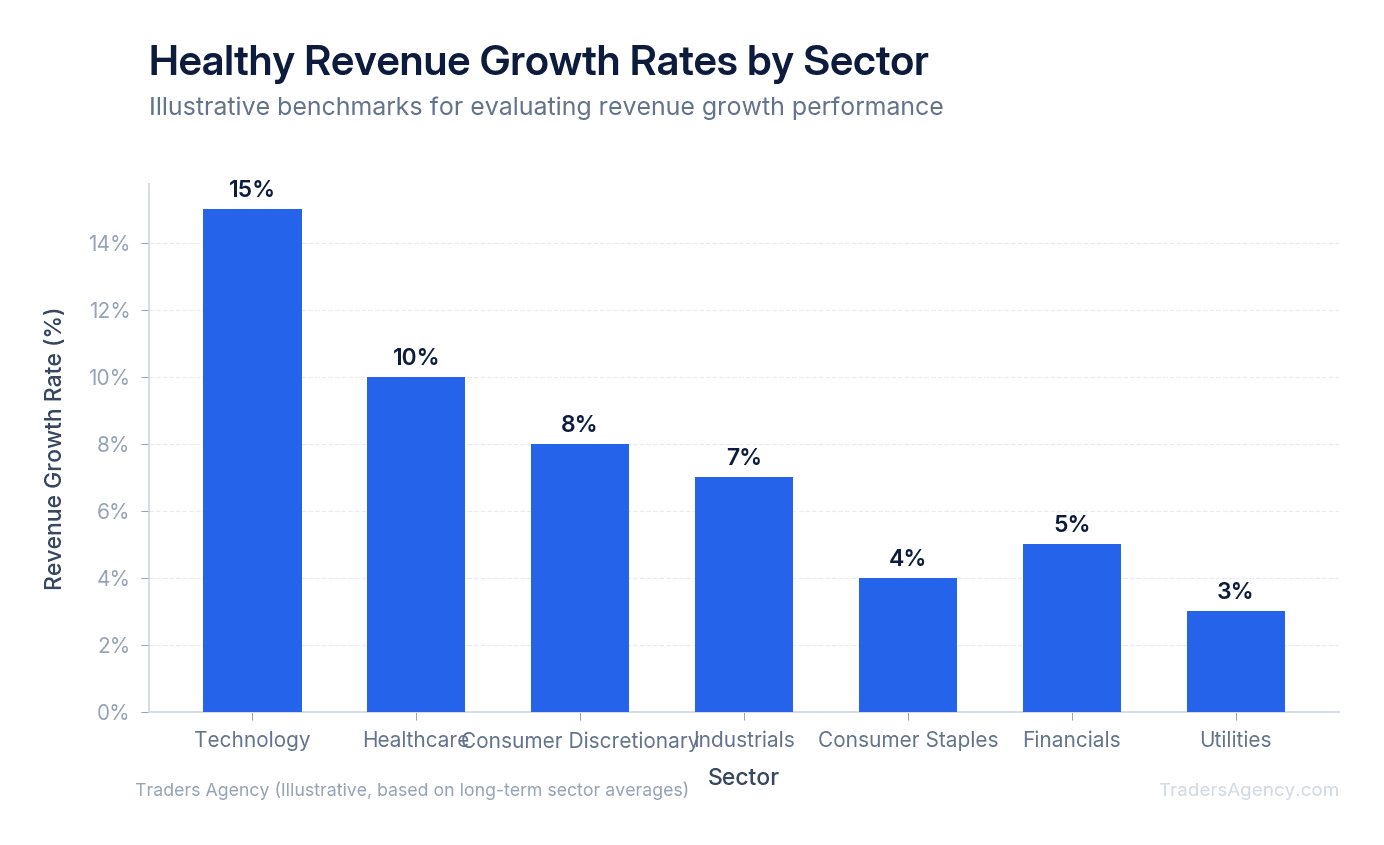
A good revenue growth rate depends entirely on the specific sector and the maturity of the company. For mature consumer staples, a healthy rate is typically 3% to 5% annually. For early-stage technology companies, investors generally expect revenue growth rates exceeding 20% year over year.
You can't compare a fast-growing software company to a hundred-year-old utility provider. Our team recommends establishing a baseline for the specific industry you're trading.
Here's what we look for across different sectors:
| Sector | Healthy Annual Revenue Growth | Notes |
|---|---|---|
| Technology | 15% to 30% | High valuations demand proof of rapid expansion |
| Consumer Staples | 3% to 6% | Slow, steady growth driven by price increases alongside inflation |
| Financials | 5% to 10% | Heavily dependent on the current interest rate environment |
If a technology stock is only growing sales at 4% a year, it's losing market share. If a grocery chain grows sales at 15% a year, they're dominating their competition. Context is everything when evaluating these numbers.
Want expert trading insights delivered daily?
Join thousands of traders who rely on Traders Agency for market analysis and trade ideas.
Join Traders AgencyS&P 500 Earnings Growth History and Market Context
To understand individual stocks, you need to understand the broader market environment. We always check the macro trend before taking a position.
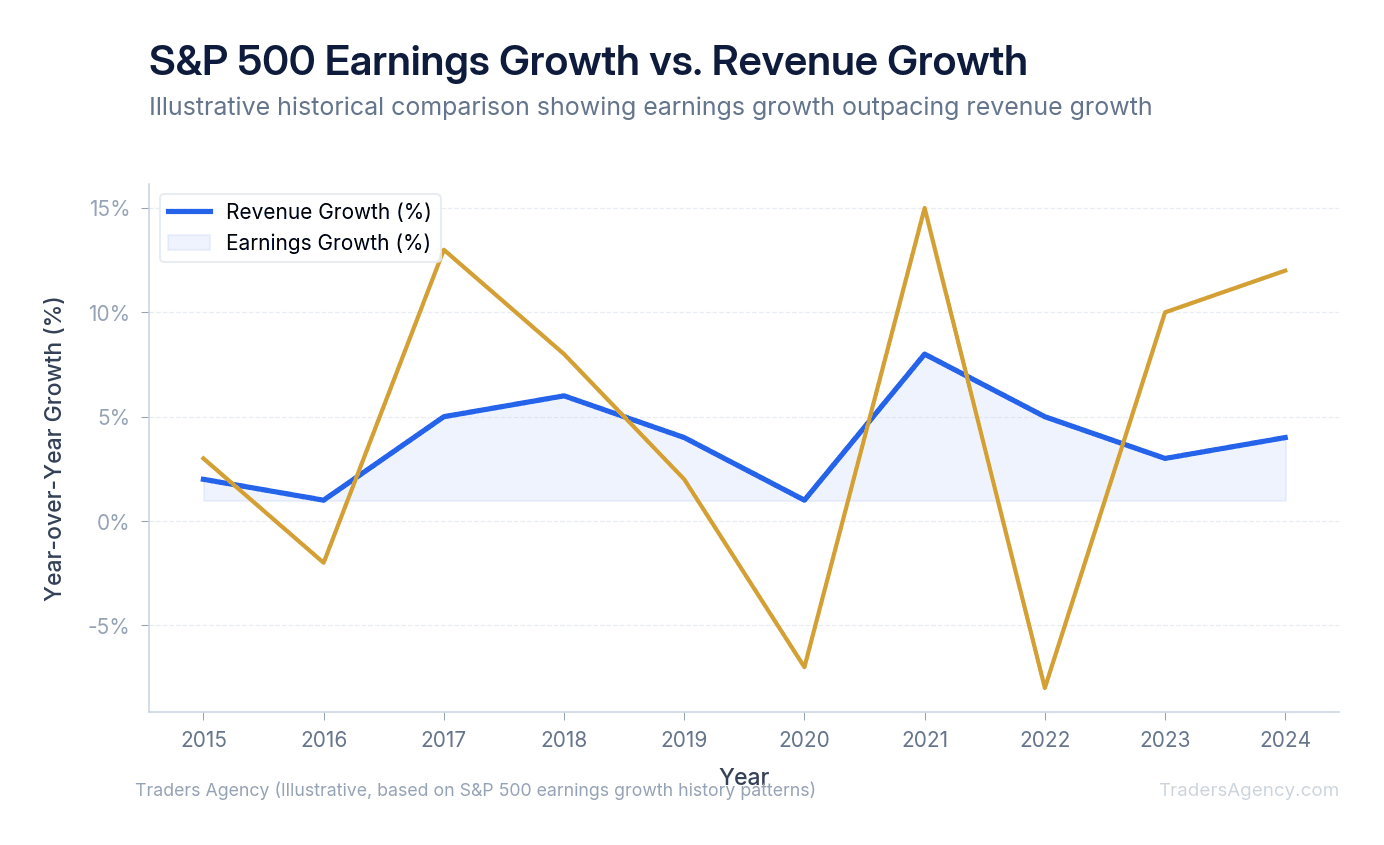
Looking at S&P 500 earnings growth history, we can see clear cycles of expansion and contraction. During economic booms, both sales and profits rise together. During recessions, sales drop, and companies scramble to cut costs to protect their profit margins.
When you study S&P 500 earnings growth by year, you'll notice periods where earnings growth dramatically outpaces revenue growth. This usually happens at the end of a bull market. Companies have exhausted their natural customer base and resort to financial engineering to keep their stock prices elevated.
As analysts project corporate earnings growth for 2025, our team is watching the revenue numbers closely. If the broader market shows rising earnings but flat sales across the board, we view that as a bearish signal. It means current profit levels are unsustainable without a resurgence in actual consumer demand.
How Do You Analyze Revenue and Earnings Growth in Practice?
Now we'll walk you through exactly how to run this analysis on a real stock. You don't need to be an accountant to do this. You just need to know where to look.
We recommend pulling official financial statements directly from the SEC EDGAR database. This is the authoritative source for all public company filings. You'll want to look at the quarterly 10-Q report or the annual 10-K report.
- Locate the Top Line: Open the Income Statement. The very first line will be labeled "Revenue" or "Total Sales." Write down the number for the current quarter and the same quarter from the previous year.
- Calculate the Sales Expansion: Subtract the old revenue from the new revenue. Divide that result by the old revenue, then multiply by 100. If last year was $200 million and this year is $220 million, the growth rate is 10%.
- Check the Bottom Line: Scroll down to the bottom of the Income Statement. Find the line labeled "Net Income." Perform the exact same percentage calculation you did for the sales figures.
- Compare the Two Metrics: This is where the actual trading strategy comes in. You're looking for the relationship between the two numbers.
If revenue is growing at 15% and net income is growing at 18%, you've found a very healthy company. They're selling more products and becoming slightly more efficient at doing so. This is a prime candidate for a long position.
If revenue is growing at 2% but net income is growing at 25%, you need to investigate further. Look at the "Shares Outstanding" line. Did the company buy back a massive amount of stock? Look at "Operating Expenses." Did they lay off thousands of workers? This stock might be a value trap.
| Scenario | Revenue Growth | Earnings Growth | Signal |
|---|---|---|---|
| Healthy Expansion | 15% | 18% | Strong buy candidate: real demand + improving efficiency |
| Potential Value Trap | 2% | 25% | Investigate: likely cost-cutting or buybacks inflating EPS |
| Growth at Any Cost | 30% | -10% | Acceptable for early-stage companies burning cash to scale |
| Deteriorating Business | -5% | -15% | Avoid: declining demand and shrinking profits |
Does It Matter Whether a Company Is in a Growth Stage or Mature?
Our team applies this revenue growth vs earnings growth framework differently depending on the lifecycle of the business.
For young, disruptive companies, we almost entirely ignore earnings. Amazon famously operated at a loss for years while growing its sales exponentially. If you demanded positive earnings from Amazon in 1999, you would have missed one of the greatest trades in history. For these stocks, accelerating sales growth is the only metric that matters.
For mature, dividend-paying companies, the opposite is true. If a legacy telecommunications company suddenly shows a massive spike in sales, we're skeptical. They likely acquired a competitor, taking on massive debt in the process. For these mature stocks, we want to see slow, steady sales growth matched by highly consistent profit margins.
Key Concept: Match your analysis to the company's lifecycle. For early-stage growth stocks, prioritize revenue acceleration. For mature blue chips, prioritize the consistency of the relationship between revenue and earnings over time.
Practical Application and Risk Management
Fundamental analysis tells you what to buy, but risk management dictates how you trade it. Even if a company has perfect financial statements, the stock can still drop.
We never allocate more than 5% of our total portfolio to a single fundamental idea. The market can remain irrational longer than you can remain solvent. A company with stellar sales and profit growth might get dragged down by a broad market selloff.
Always use technical analysis to time your entries. We prefer to wait for a stock with strong fundamentals to pull back to a major moving average before buying. If the stock breaks below our technical stop loss, we exit the trade immediately. We don't hold losing positions just because the SEC filings look good.
The best traders combine fundamental quality with technical timing. By verifying that a company is actually growing its core business, you eliminate the weakest stocks from your watchlist. You're left with a curated list of high-quality targets, ready for your technical entry signals.
Risk Warning: Strong fundamentals do not guarantee short-term price appreciation. Always define your position size, entry criteria, and stop-loss level before placing any trade. Fundamental analysis is one tool in a complete trading plan, not a standalone strategy.
Want expert trading insights delivered daily?
Join thousands of traders who rely on Traders Agency for market analysis and trade ideas.
Join Traders AgencyKey Takeaways
- Revenue growth measures total sales increases before expenses, while earnings growth measures net profit after all costs, taxes, and interest are deducted. Conflating the two leads to misreading a company's actual financial health.
- A stock can drop 10% on strong earnings news when institutional investors recognize that profit gains came from cost-cutting or accounting adjustments rather than genuine top-line business expansion.
- Revenue is considered harder to manipulate than earnings because it reflects real customer demand, while earnings can be inflated through one-time items, tax benefits, or aggressive accounting choices.
- Growth-stage companies often show strong revenue growth with little or no earnings, which is not automatically a red flag. The stage of the business determines which metric deserves more weight in your analysis.
- Strong fundamentals are a filter for building a high-quality watchlist, not a trade trigger. Fundamental analysis must be paired with technical entry signals, defined position sizing, and a stop-loss level before any trade is placed.
DISCLAIMER: Traders Agency does not offer financial advice. The information provided is for educational purposes only and should not be considered financial advice. Traders Agency is not responsible for any financial losses or consequences resulting from the use of the information provided. Trading carries inherent risks and may not be suitable for all individuals. You are advised to conduct your own research and seek personalized advice before making any investment decisions, recognizing the potential risks and rewards involved.
See more from Traders Agency on Google
Make us a preferred source and our market analysis will appear more prominently in your Google Search, Top Stories, and AI results.
Add to Preferred Sources