The NASDAQ just flashed a stock market buy signal I've only seen a handful of times all year. Each of the last few times it showed up, stocks rallied in the weeks that followed.
This isn't a hunch or a gut feeling. It's a specific, measurable indicator that just hit the exact same level it reached right before the April and May rally, and right before the end-of-year bounce last year.
The last couple of weeks have been ugly. The market chopped sideways all summer, sold off, recovered, and went nowhere. The indicator just hit its extreme, and when it does, it has historically marked some of the better buying windows of the year.
I'm putting money to work in two mining stocks right now. Below is the reasoning, the entry, the stop loss, and the math behind each trade.
What Counts as a Stock Market Buy Signal?
Bottom Line: A NASDAQ indicator called NCFD just hit an extreme level that has preceded rallies earlier this year and last year. That signal is being paired with two mining stock trades, Kinross Gold and Hecla Mining, each with a defined entry and stop loss to manage risk if the bounce does not happen.
Measurable data, not a feeling
A stock market buy signal is a measurable piece of data, usually a chart pattern or a technical indicator, that suggests stocks are oversold and due for a bounce. It doesn't predict the future with certainty. It identifies moments when selling has probably been overdone and a rally is more likely than not.
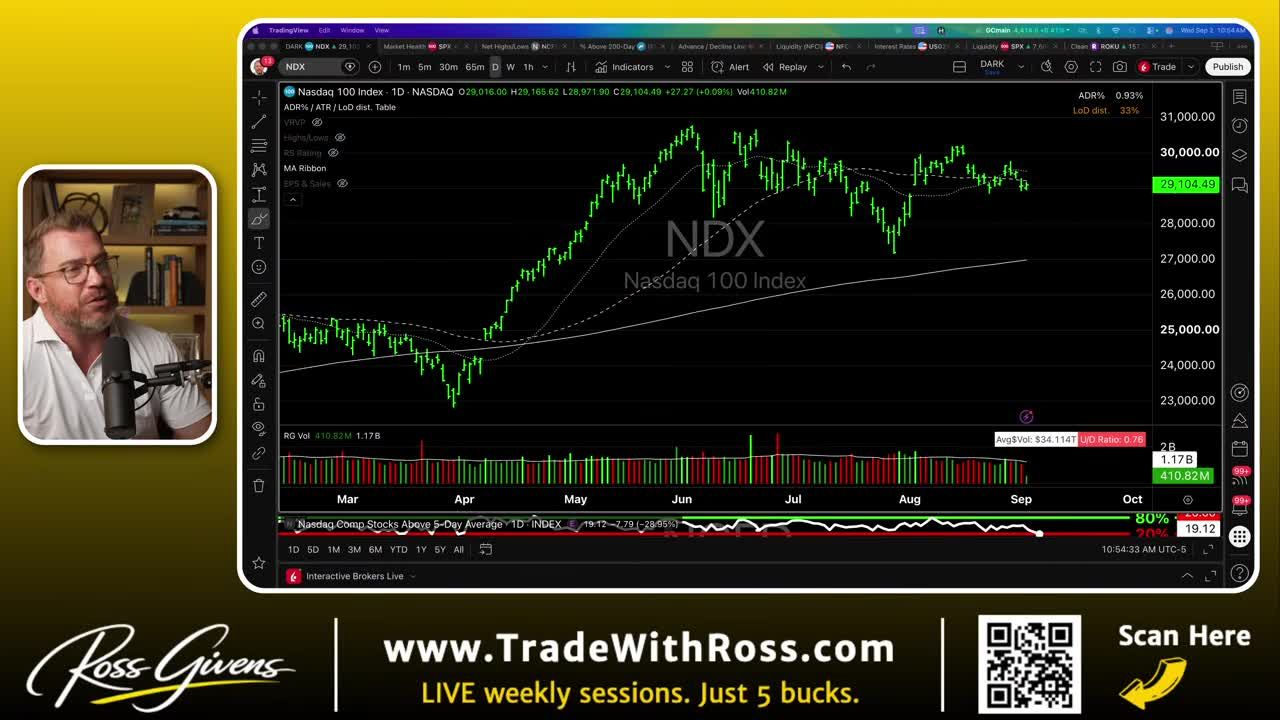
The market started the year flat to ugly, then went parabolic in April and May, led by the semiconductors and the broader NASDAQ. Then summer hit and the index went nowhere. Chopping, selling off, recovering, chopping again. No real progress in either direction.
That kind of environment is exactly when a reliable signal earns its keep. You're not trying to catch the precise bottom. You're trying to identify a zone where the odds tilt in your favor.
The Indicator: NCFD
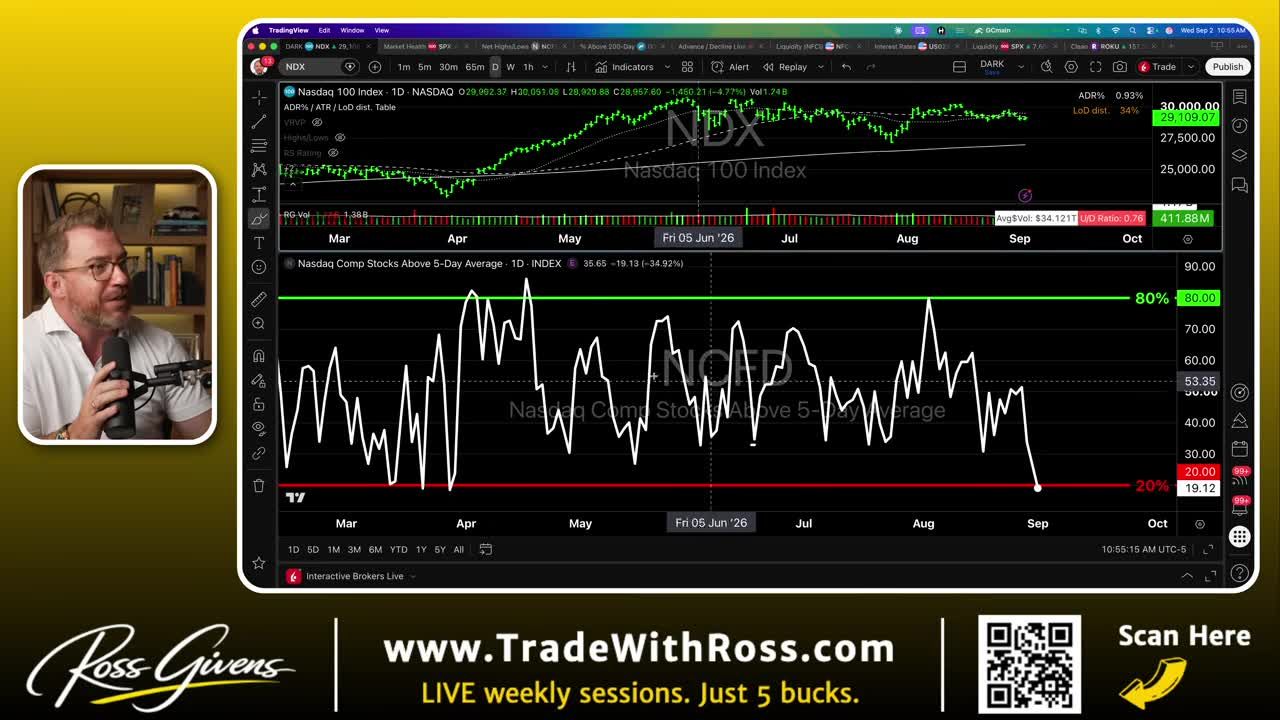
The ticker is NCFD, and you can plot it on TradingView. It tracks the percentage of NASDAQ composite stocks trading above their five-day moving average.
A five-day average flips all over the place. But that's the point. It's a fast read on whether stocks are overbought or oversold in the short term.
- When most stocks are below their five-day average, selling has usually been exaggerated, and dip buyers tend to step in.
- When most stocks are above it, buying has already pushed prices past their short-term norms, which raises pullback risk.
I draw two lines on the chart: green at 80% and red at 20%. Hitting the red line is no guarantee of a bottom. It has, however, marked some of the better buying opportunities of the year.
Three Reads, Three Rallies
At the very end of last year, the indicator hit that 20% red line right at a market low. The market didn't go up 8,000% from there. It produced a clean three to five percent rally over the following week or two. Not life changing on its own, but repeatable.
The next time it hit that level was during the spike tied to the war with Iran. We got a couple of spikes in a row, and that period still turned into a great buying opportunity right before the huge rally in April and May.
Since the end of March, the indicator hadn't touched the red line again. The end of March was the best time to buy stocks all year.
Not a guarantee. Nobody wins 100% of the time on a single signal. But if you believe the market carries a long-term upward bias, and that buying dips historically beats waiting for perfect entries, this is one legitimate way to measure when a dip is worth buying.
Three separate instances of the same signal producing the same general outcome isn't noise. That's pattern recognition.
Get an entire year of live weekly mentoring sessions, my newsletter, indicators, bonus reports, tons more. Click the link and I'll see you in the next live session.
Join my Black Ops Trading ClubWhy Are Gold and Silver Attractive Right Now?
I'm extremely bullish on gold and silver, even copper and the broader industrial metals, over the next couple of years. Central banks are buying gold by the tonnage. Gold is now the number one asset held by central banks, ahead of treasuries.
I won't get into the weeds on inflation and money printing. I'll say it plainly: I like gold.
Gold broke out in early August, forming that classic rounded bottom pattern you see when a stock or commodity consolidates before it runs. I bought gold futures on that breakout and sold a bit before the peak. The trade did fine. Now we have a pullback, which is the kind of setup worth buying.
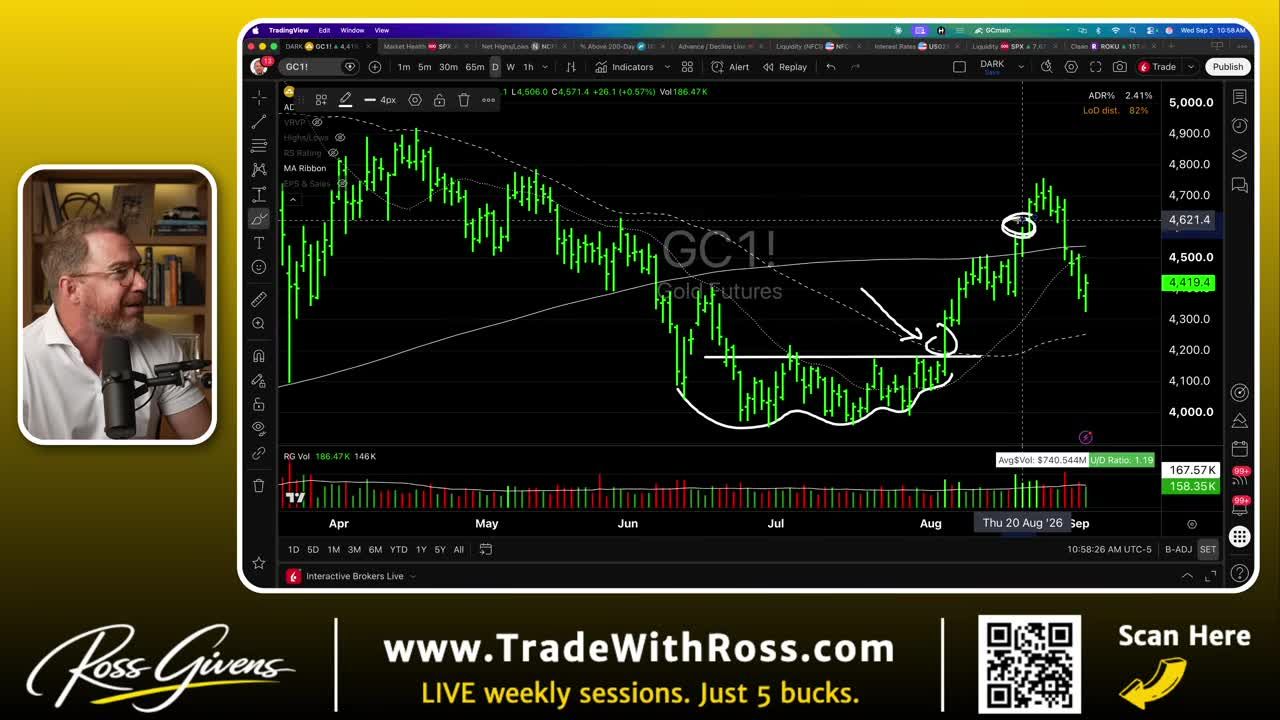
There are two ways to play a move like this. Futures or GLD, the gold ETF, which move lock, stock, and barrel with the metal. Or mining stocks, which give you a leveraged move on the underlying price.
I'm buying two miners. Here's the case for each.
Trade One: Kinross Gold (KGC)
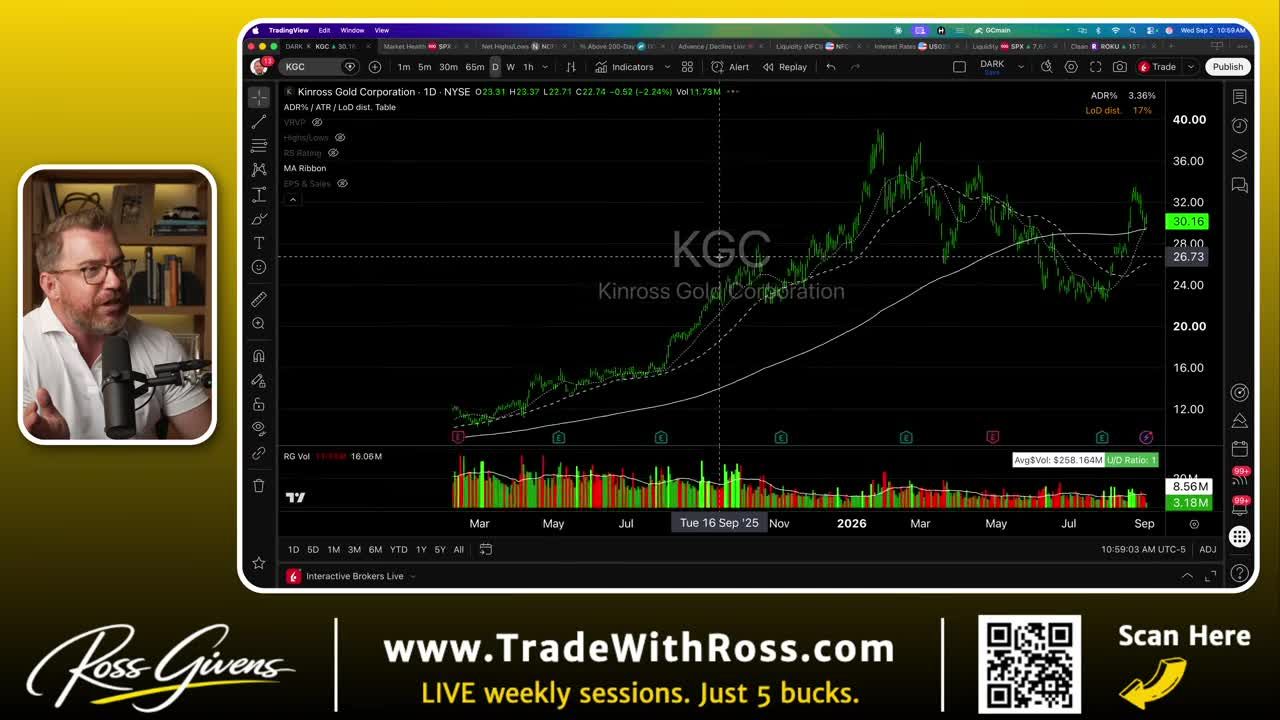
The first stock I'm buying is Kinross Gold, ticker KGC. One of my favorite gold stocks. I bought it back in 2024 around $6 and change and rode it from $6 to $38. An absolute monster.
This company is a cash machine. The stock trades at just 10 times forward earnings. Management has executed $520 million in buybacks so far this year and is committed to returning 40% of free cash flow to investors. Company filings are available through SEC EDGAR.
The Case for the Miner Over the Metal
Two words: operational leverage. From the August breakout to the peak, gold itself moved 13.5%. Kinross moved 32% over the same stretch. Double the move in the metal.
The reason is simple math. A miner's profit is the gap between what it costs to pull an ounce out of the ground and what they sell it for. Kinross reports an all-in sustaining cost (AISC) of roughly $1,800 an ounce.
That's why these stocks move in a multiple of the underlying price.
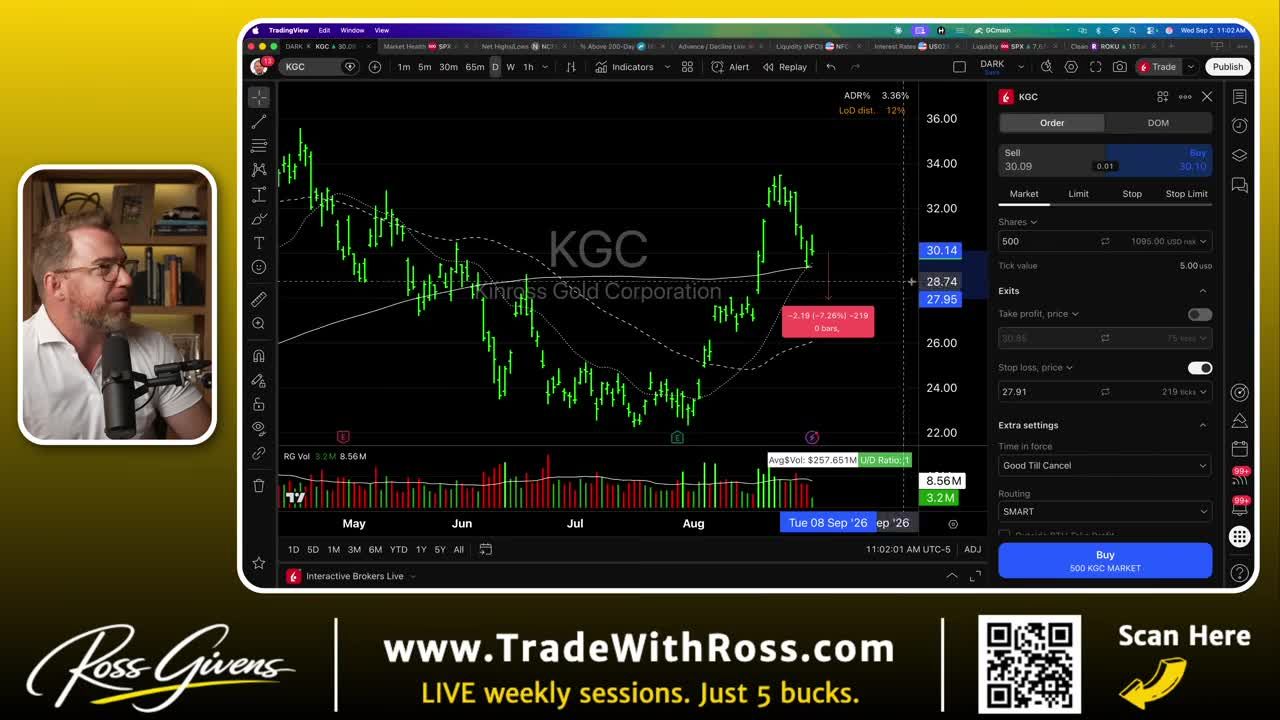
Kinross ran hard off the low, then pulled back with the rest of the metals into a supply and demand zone where we've seen a lot of buying, right on the 200-day moving average. That's the setup.
The trade: 500 shares at the market, stop loss around $28, below that spike low. Risk is roughly 7%.
Trade Two: Hecla Mining (HL)
The other side of the gold coin is silver, and silver runs even higher beta. More volatile, which means bigger up moves and bigger down moves.
For silver exposure I like Hecla Mining, ticker HL. America's oldest and largest primary silver miner, with operations going back to the 1890s.
It trades at a higher earnings multiple than Kinross, and the reason is simple: zero debt. None. No company in the history of the world has ever gone bankrupt without any debt, which makes this one a little safer long term.
Margins That Are Hard to Believe
Hecla's all-in sustaining cost on silver, straight from their report, is $6.70 per ounce. That's after byproduct credits from the zinc, lead, and gold they pull out alongside the silver. Net net, cost lands around $6 an ounce.
No debt plus margins like that is exactly why it commands a premium multiple.
Technically, Hecla ripped off the early August breakout and ran to the top of its range. Around $21 a share, you had a level that was support, then flipped to resistance repeatedly. It has since pulled back into the meat of that range and is bouncing off the 200-day moving average again.
The trade: 700 shares, stop loss at $18.80 below the low of that sell-off. Risk is roughly 7%, the same as the Kinross position.
How to Trade This Stock Market Buy Signal
Four rules that keep it a trade instead of a gamble
1. Confirm the Signal, Don't Chase the Headline
Wait for the actual reading, NCFD at its 20% threshold, rather than buying because prices dropped or a headline sounded scary.
2. Pick Assets You're Already Bullish On
A buy signal tells you when conditions favor buying. It doesn't tell you what to buy. I'm applying it to gold and silver miners because I'm fundamentally bullish on the metals over the next couple of years, not because the indicator picked these tickers.
3. Set the Stop Before You Enter
Both trades carry roughly 7% risk. Kinross at $28, Hecla at $18.80. Define the number before you buy, not after the position starts moving against you.
4. Respect the Leverage
Mining stocks amplify moves in the underlying metal. That cuts both ways: bigger gains on rallies, bigger losses on pullbacks. Size accordingly.
Is This the Best Indicator?
No indicator gives the best buy and sell signals in every environment. But tracking the percentage of stocks above their five-day moving average has produced a consistent read at market extremes this year, and you can plot it on TradingView.
NCFD isn't magic. It won't win every time, and it isn't built to catch the exact bottom. What it does well is flag zones where selling has probably been overdone.
Act on It, Don't Just Watch It
The indicator just hit 20% for the first time since the end of March, and the end of March turned out to be the best buying window of the year. That's not a coincidence worth ignoring.
A stock market buy signal only matters if you act on it with a plan. Two positions today, Kinross Gold and Hecla Mining, each with a defined entry, a defined stop, and a clear fundamental reason behind the pick.
The signal told me when to look. My view on gold and silver told me where. The stop losses tell me exactly how much I'm willing to lose if I'm wrong.
That's the whole framework. Watch for the extreme reading, pair it with assets you understand and believe in, and define your risk before you click buy.
Get an entire year of live weekly mentoring sessions, my newsletter, indicators, bonus reports, tons more. Click the link and I'll see you in the next live session.
DISCLAIMER: Traders Agency does not offer financial advice. The information provided is for educational purposes only and should not be considered financial advice. Traders Agency is not responsible for any financial losses or consequences resulting from the use of the information provided. Trading carries inherent risks and may not be suitable for all individuals. You are advised to conduct your own research and seek personalized advice before making any investment decisions, recognizing the potential risks and rewards involved.
See more from Traders Agency on Google
Make us a preferred source and our market analysis will appear more prominently in your Google Search, Top Stories, and AI results.
Add to Preferred Sources