
Hey, Ross here:
The market weakness we’ve been watching is starting to spread.
But another piece of data has been moving sharply in the opposite direction.
Take a look:
Chart of the Day
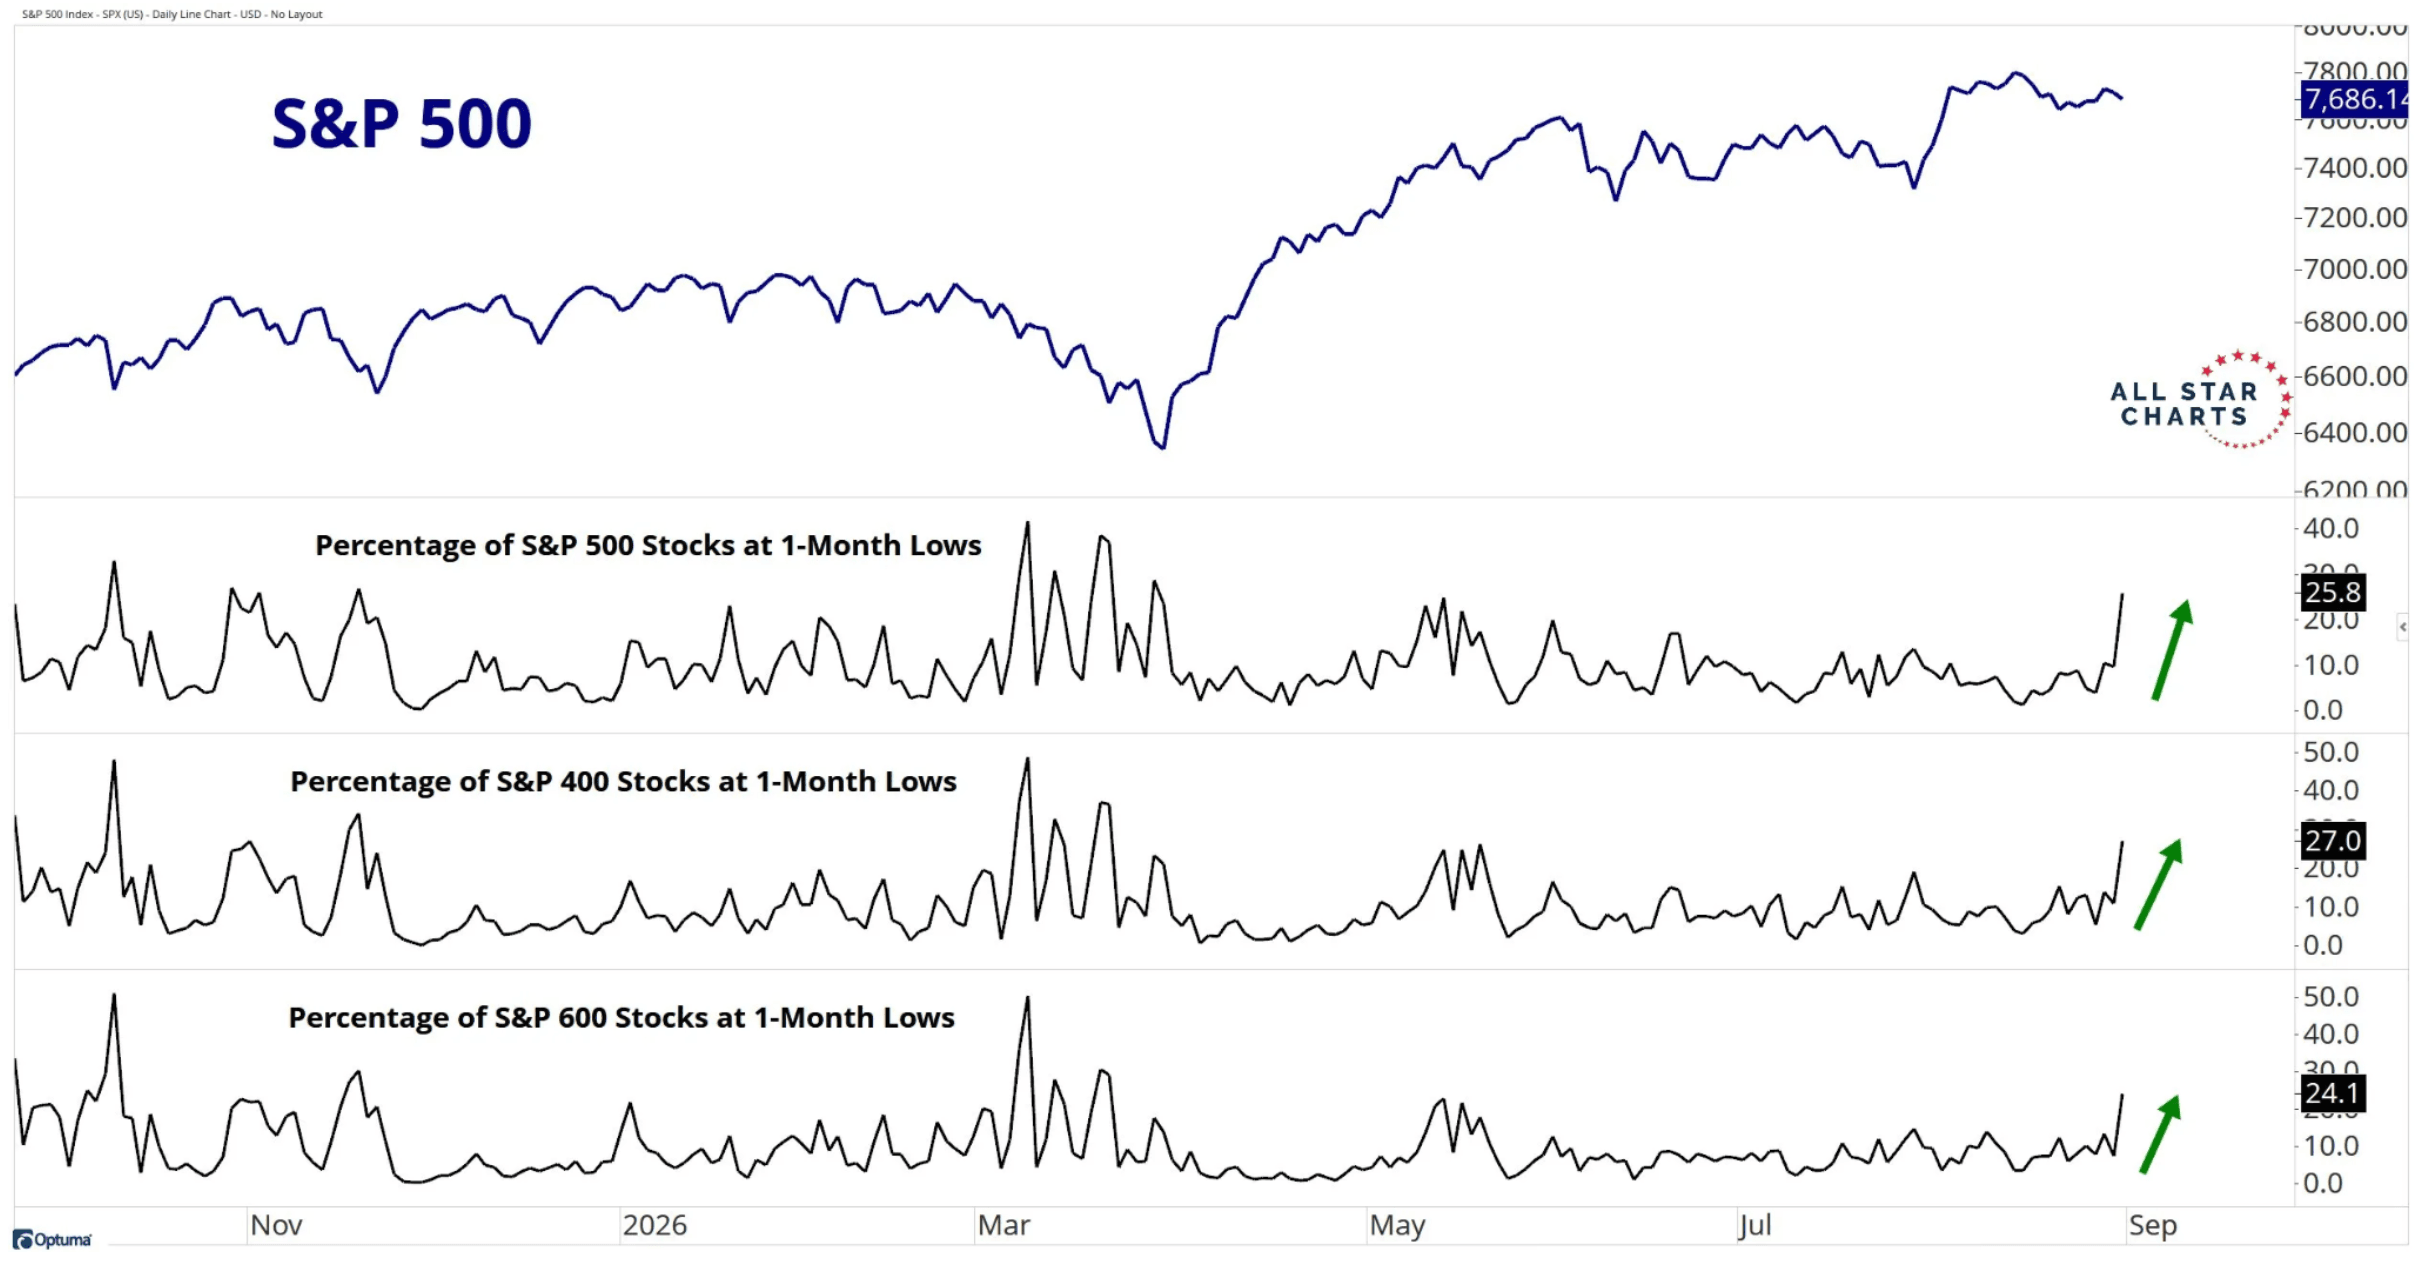
This chart shows the percentage of stocks sitting at one-month lows across three different parts of the market.
Right now:
- 25.8% of S&P 500 stocks are at one-month lows.
- 27.0% of S&P 400 stocks are there.
- 24.1% of S&P 600 stocks are there too.
All three have jumped sharply.
So unlike earlier in this pullback, the weakness is no longer confined to a handful of stocks or sectors.
It’s spreading.
That tells me this pullback has more teeth than you’d guess from the S&P 500 alone.
But now look at what has happened at the same time:
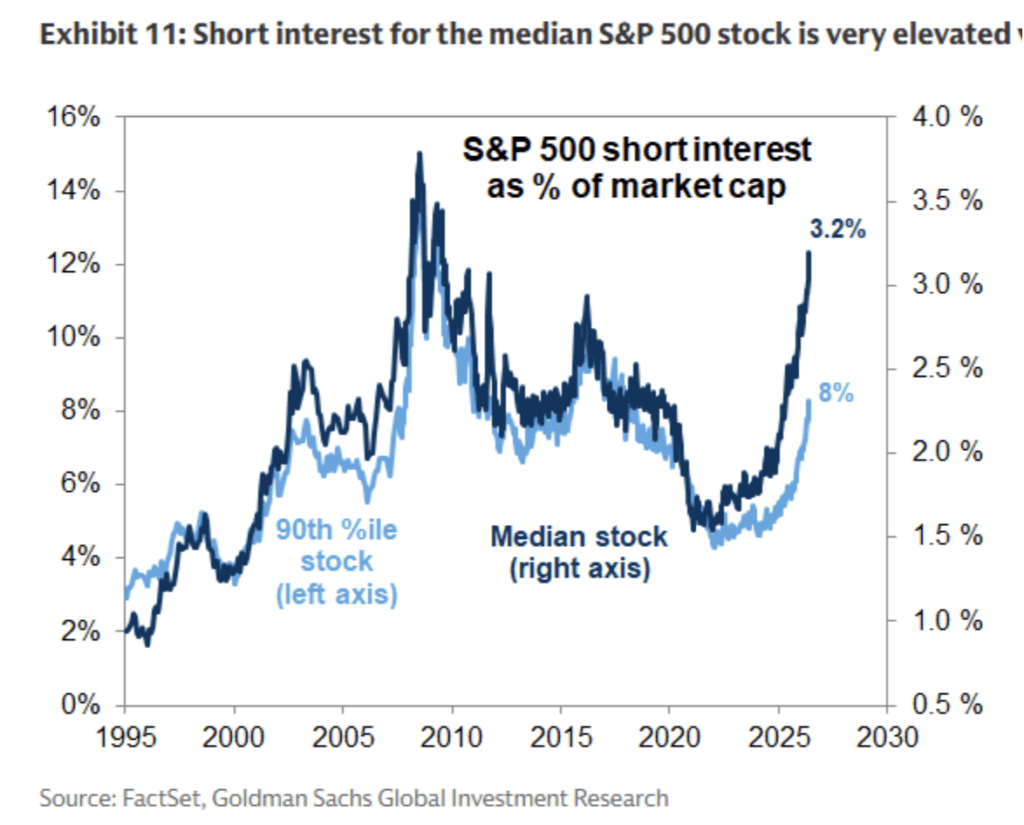
Short interest has surged.
For the median S&P 500 stock, short interest is now around 3.2% of market cap.
That’s around the highest level we’ve seen in a decade.
So the weakness is spreading at the same time traders are getting more aggressive betting on even more weakness.
That sounds bearish.
And right now, it is.
But there’s a catch.
Insight of the Day
Bearish positioning can quickly flip into buying pressure.
Every short sale creates a future buy order
When you buy a stock, you can sit on it for years.
A short position works differently.
At some point, the trader has to buy those shares back to close the trade.
As long as the stock keeps falling, the shorts are happy.
They’re making money.
There’s no reason to rush for the exit.
The fun starts when price turns against them.
Say a heavily shorted stock pushes up through a level that’s been capping it for weeks.
Now the traders waiting for the breakout start buying…
While the shorts suddenly have a decision to make.
Hold on and hope the stock rolls back over…
Or start buying shares to get out.
If the stock keeps running, that second group can get bigger in a hurry.
That’s how bearish positioning can turn into buying pressure.
And with short interest already this elevated across the market…
I’m paying very close attention to stocks that start breaking through key levels…
It’s not because I think every heavily shorted stock is about to squeeze. Most won’t.
I’m looking for the ones where price starts telling us the bears may be losing control…
Because that’s when a stock can get explosive fast.
And the #1 thing I scan for is my trademark “FIRE Pattern”.
This is a pattern that spotted Rhythm Pharmaceuticals before it surged 163% in seven weeks…
Nine Energy Service before it shot up 270% in 10 weeks…
And Iris Energy before it ripped 148% in just 2 days.
That’s why later today at 3 p.m. Eastern…
I’m going LIVE to show you exactly how this pattern works – and how you can apply it to your own trading.
I’ll show you why it’s ranked my number-one chart pattern for both bull and bear markets…
Exactly what I look for before it triggers…
And the name and ticker of one of my top targets setting up in this pattern right now.
So click here to lock in your free seat if you haven’t yet…
And I’ll see you this afternoon at 3 p.m. ET.
P.S. If you’re planning to attend on a mobile device, make sure you download the presentation app now so you don’t miss anything when it starts. See you there.
iOS: https://apps.apple.com/us/app/goto/id1465614785
Android: https://play.google.com/store/search?q=goto&c=apps
Customer Story of the Day
“I have been trading since 1999 and follow both technical and fundamental analysis. Ross is very knowledgeable and shares his insights into current trends. You will learn how to look at charts and rinse and repeat for your own low risk trades.”

Ross Givens
Editor, Stock Surge Daily
See more from Traders Agency on Google
Make us a preferred source and our market analysis will appear more prominently in your Google Search, Top Stories, and AI results.
Add to Preferred Sources