
Revenue growth vs. profit margins is one of the most important comparisons in fundamental analysis. Revenue tells you how much money enters a business. Profit margin tells you whether that money creates actual economic value. You've probably seen this exact scenario play out during earnings season: a popular company reports a massive 40% jump in quarterly sales, retail traders rush in to buy, and the stock price crashes the next morning. Why? The company grew their sales, but their operating costs grew by 60%. They destroyed their own profitability to get those sales. We're going to walk you through exactly how to evaluate these two financial metrics. By the end of this guide, you'll know how to read income statements, spot efficiency trends, and decide whether a high-growth company is actually worth your trading capital. Our team relies on these exact principles to separate sustainable businesses from cash-burning traps.
What Is the Difference Between Profit Margin and Revenue Growth?
The difference between profit margin and revenue growth comes down to volume versus efficiency. Revenue growth measures the percentage increase in total sales over a specific period. Profit margin measures the percentage of those sales that remain as profit after paying expenses. Both metrics drive stock prices differently.
Our team looks at revenue as the engine of a business. It shows market demand, customer adoption, and brand strength. Profit margin, on the other hand, acts as the transmission. It dictates how much of that engine power actually reaches the wheels to drive shareholder value. You can have a massive engine, but if the transmission is broken, the car goes nowhere.
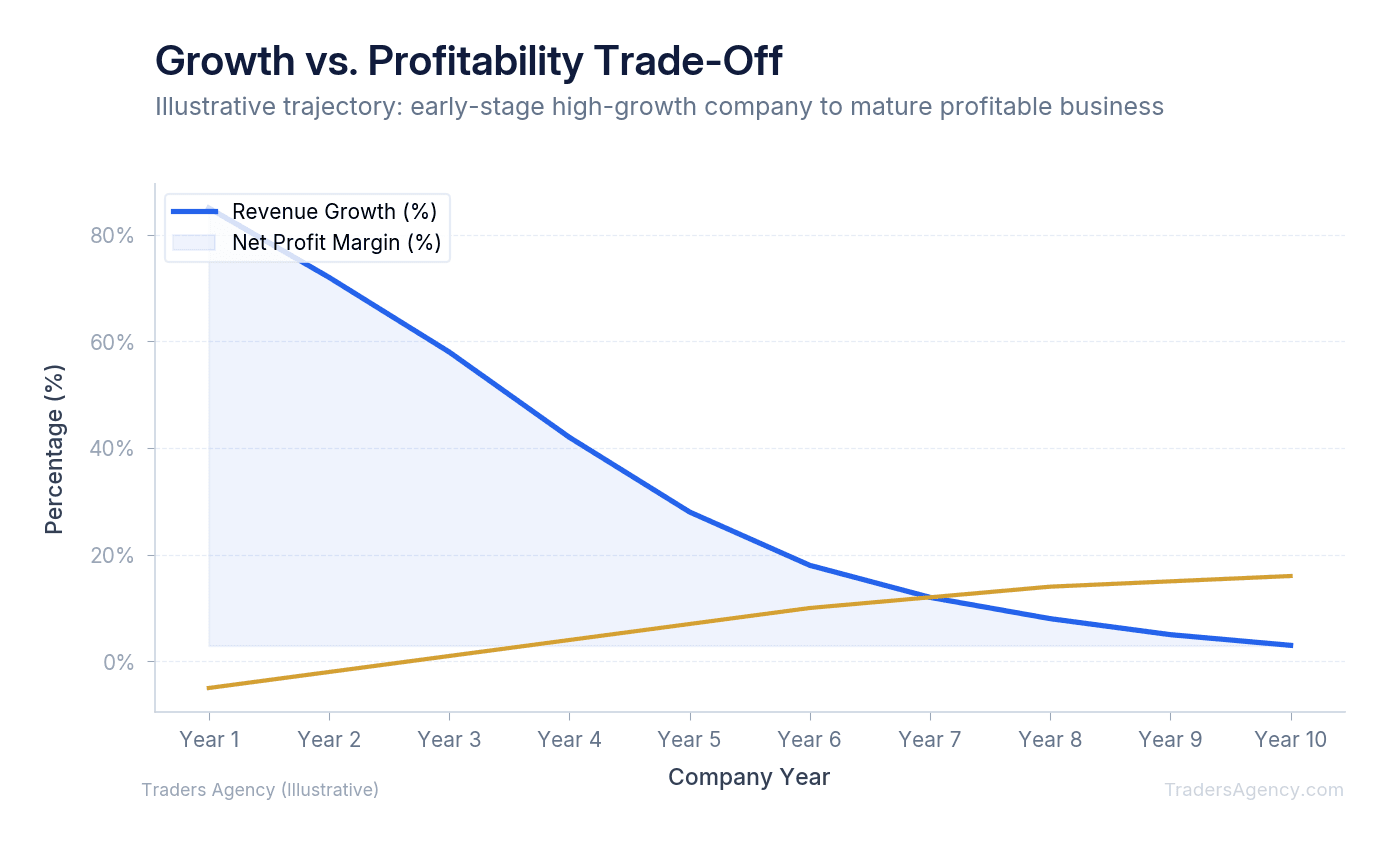
When analyzing stocks, we prefer to see both metrics moving higher simultaneously. But in the real world, management teams usually trade one for the other. A young tech company might slash prices and double their marketing budget to boost sales. They willingly sacrifice immediate profits to capture market share.
Conversely, a mature company might raise prices to improve their margins. This action increases their profitability per item sold, but it often slows down their overall revenue growth. Understanding the revenue growth vs. profit margins tradeoff helps you determine exactly what stage of the business lifecycle a company is currently in.
Key Concept: Revenue growth measures how fast a company's sales are expanding. Profit margin measures how efficiently those sales convert into actual profit. A healthy business eventually needs both, but the priority shifts depending on the company's stage of growth.
What Are the 4 Levels of Profitability?
The four levels of profitability are gross margin, operating margin, pre-tax margin, and net margin. Each level strips away another layer of corporate expenses. Tracking all four levels helps traders pinpoint exactly where a company is losing money or gaining operational efficiency.
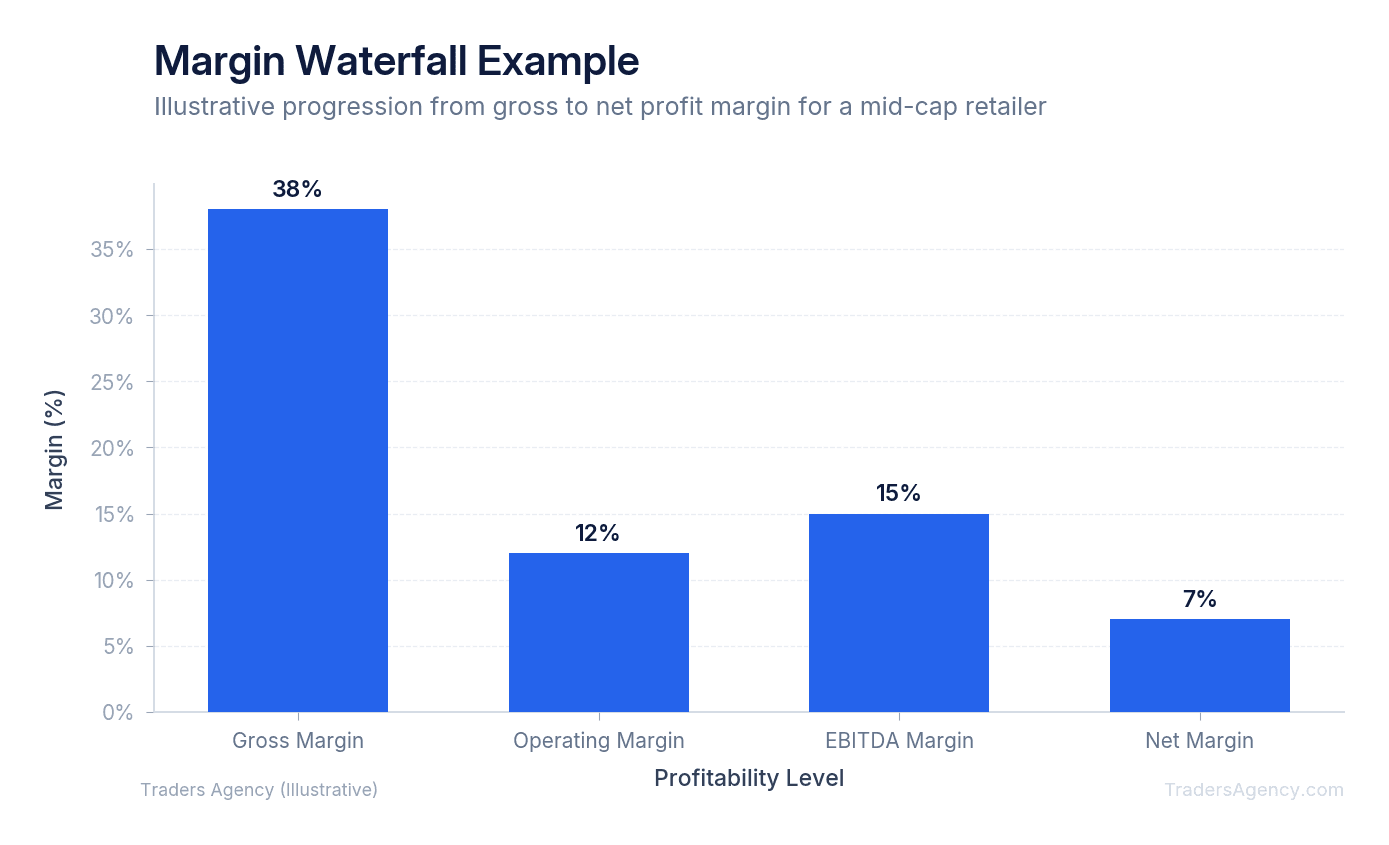
We can look at a concrete profit margin example using a hypothetical publicly traded software company called TechCorp (TCORP). Last year, they generated exactly $100 million in total revenue. We'll apply the standard profit margin formula to each level: (Profit / Revenue) x 100.
1. Gross Margin
This first level measures revenue minus the direct cost of goods sold (COGS). For a software company, COGS includes server hosting and third-party software licenses. If TCORP spends $20 million on these direct costs, their gross profit is $80 million. Using our formula, ($80M / $100M) x 100 gives them an 80% gross margin. This tells us their core product is highly scalable.
2. Operating Margin
Next, we subtract operating expenses (OpEx). These are the costs of running the business, including marketing, research and development, and administrative salaries. If TCORP spends $50 million on these overhead costs, their operating profit drops to $30 million. This leaves them with a 30% operating margin. A declining operating margin often indicates a company is spending too much on advertising just to maintain their sales.
3. Pre-Tax Margin
This third level accounts for non-operating items. The most common non-operating expense is interest payments on corporate debt. If TCORP carries heavy debt and pays $5 million in interest, their pre-tax profit becomes $25 million. This results in a 25% pre-tax margin. We watch this metric closely when central banks raise interest rates, as higher borrowing costs will quickly compress this margin.
4. Net Margin
Finally, we deduct corporate taxes. If TCORP pays $5 million in taxes, their final net income is $20 million. Their final net margin is 20%. This is the ultimate bottom line. This specific number directly drives the earnings per share (EPS) metric that Wall Street analysts use to value the stock.
| Profitability Level | What It Subtracts | TCORP Example | Margin |
|---|---|---|---|
| Gross Margin | Cost of Goods Sold (COGS) | $80M profit | 80% |
| Operating Margin | Operating Expenses (OpEx) | $30M profit | 30% |
| Pre-Tax Margin | Interest & Non-Operating Costs | $25M profit | 25% |
| Net Margin | Taxes | $20M profit | 20% |
What Is a Good Net Profit Margin Across Different Sectors?
A good net profit margin depends entirely on the industry. Software companies often maintain margins above 20% due to low production costs. Conversely, grocery stores operate on massive volume with razor-thin margins around 2% to 3%. You must compare stocks against their direct sector peers.
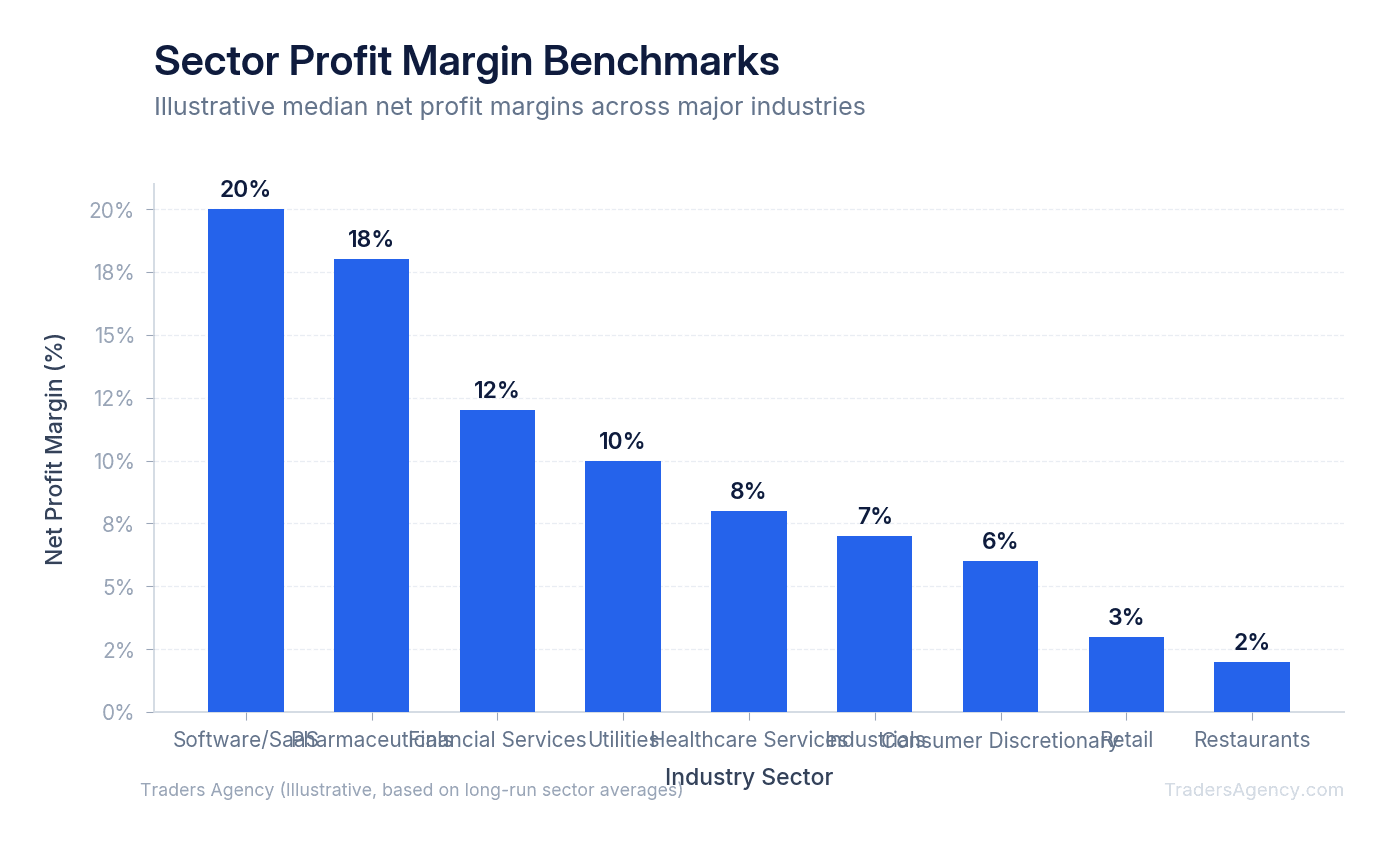
We teach our members never to compare apples to oranges. A 5% net margin would be disastrous for a cloud computing stock. It would indicate severe mismanagement or pricing pressure from competitors. However, that exact same 5% net margin would be considered excellent for a massive retail chain like Target (TGT) or Walmart (WMT).
When evaluating smaller companies, traders often ask what is a reasonable profit margin for a small business entering the public markets. For newly public micro-cap stocks, we usually look for gross margins above 40%. They need this thick top-line padding to ensure they can eventually reach net profitability once they scale up their operations. A local retail chain might target a 10% net margin, while a small tech startup might intentionally run at a negative margin for years to fund aggressive expansion.
You can find long-term industry averages published on the SEC's educational portal or through standard financial data providers. Always benchmark a company against its specific sector average before deciding if its profitability is healthy. A company outperforming its sector average by just two or three percentage points often commands a massive premium in its stock price.
Key Concept: Never judge a company's profit margin in isolation. A 5% net margin is excellent in retail and terrible in software. Always compare against the company's direct industry peers to get an accurate read on financial health.
Want expert trading insights delivered daily?
Join thousands of traders who rely on Traders Agency for market analysis and trade ideas.
Join Traders AgencyHow Do You Spot Expanding vs. Compressing Margins in SEC Filings?
Professional traders don't just look at current static numbers. They look at the trajectory of the data over time. Margin expansion happens when profitability grows faster than revenue. Margin compression occurs when costs rise faster than sales.
Here is the exact step-by-step process our team uses to find and calculate this data:
- Access the SEC EDGAR Database: Go to the official SEC EDGAR website and search for your target company's ticker symbol.
- Pull the Latest 10-Q Report: Open the company's most recent quarterly filing (10-Q) or annual filing (10-K).
- Locate the Income Statement: Scroll down to the section titled "Consolidated Statements of Operations." This document lists total revenue and all categorized expenses.
- Calculate the Percentages: Don't just look at the raw dollar amounts. Use a free online profit margin calculator or a simple spreadsheet to convert the gross, operating, and net income figures into percentages of total revenue.
- Compare Year-Over-Year Trends: Compare the current quarter's margins to the exact same quarter from the previous year. This removes seasonal variations from your analysis.
If revenue grew by 15% but operating expenses grew by 25%, the company is suffering from margin compression. They are working harder just to make less money per transaction. This is a massive red flag for stock buyers. We generally avoid buying shares in companies showing consecutive quarters of severe margin compression.
Watch Out: A single quarter of margin compression doesn't always signal trouble. Seasonal spending spikes or one-time investments can temporarily distort the numbers. Look for two or more consecutive quarters of declining margins before treating it as a structural problem.
How to Use Margin Trends in an Actual Investment Decision
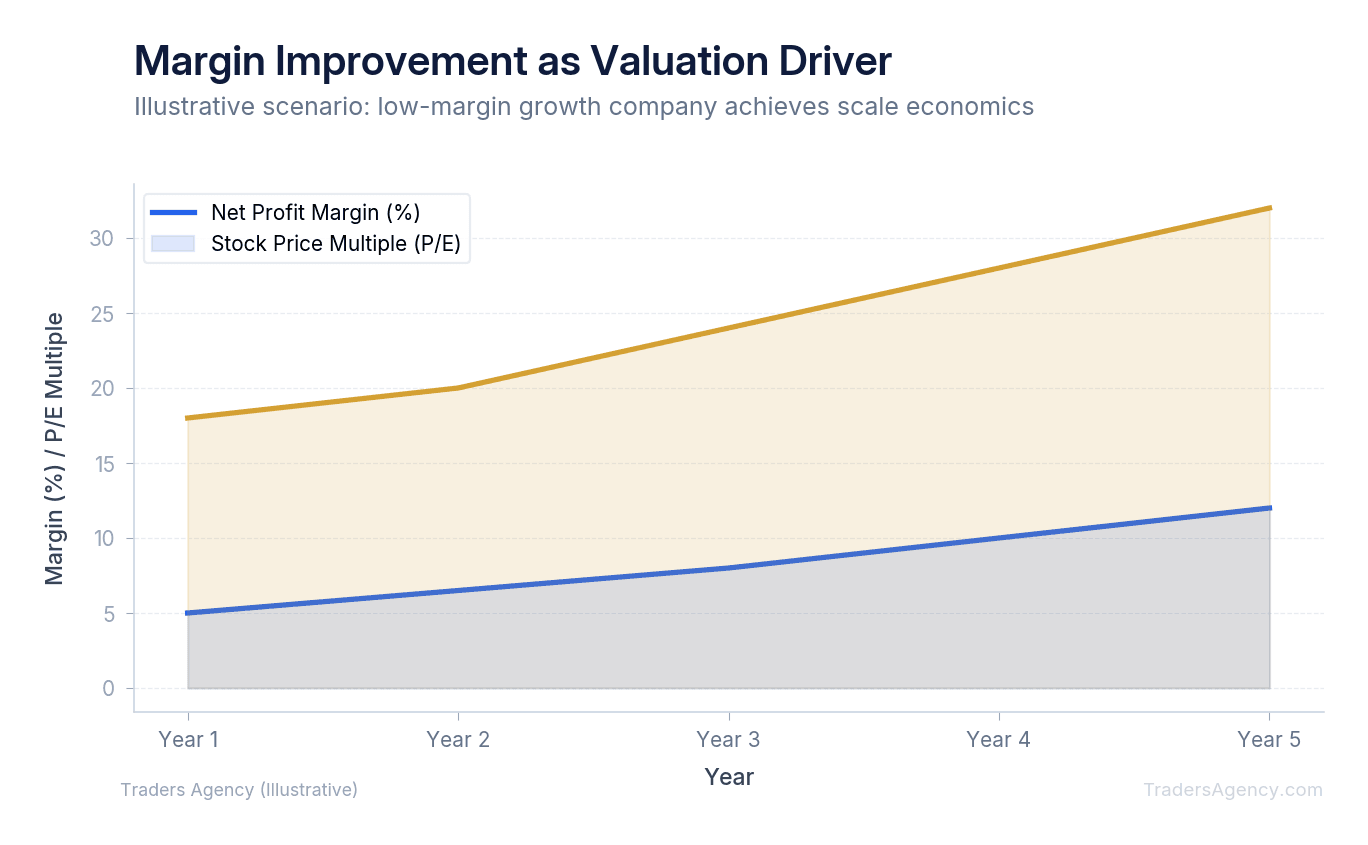
Let's walk through a practical trading scenario. We'll look at how margin expansion acts as a primary driver for stock price appreciation. This concept is known as operational scale.
Imagine you're researching a mid-cap cybersecurity stock, CyberDefend (CDEF). You want to know if their current growth justifies a long position.
The Setup
CDEF currently trades at $50 per share. Last year, they generated $500 million in revenue with a tight 5% net margin. This resulted in $25 million in net income. The broader market currently values them at a price-to-earnings (P/E) ratio of 40. You need to determine if they can grow into this high valuation.
The Execution
You pull their SEC filings and notice a distinct trend in their last three earnings reports. Their revenue is growing at a steady 10% per year. However, their operating costs are staying completely flat. Because their core software platform is already built, it costs them almost nothing to add new customers.
You project that next year, revenue will hit $550 million. Because their fixed costs remain stable, that extra $50 million in sales flows largely to operating profit. After accounting for taxes at a similar effective rate, their net income could roughly double from $25 million to around $50 million. Their net margin would expand from 5% to approximately 9%. That is a dramatic improvement in profitability from just a 10% bump in revenue.
The Outcome
If Wall Street maintains that same 40 P/E ratio, the stock price would theoretically double because the underlying earnings doubled. Even if the market cools down and the P/E ratio compresses to 20, the stock still climbs to around $50 per share, holding its value despite a halved multiple.
| Scenario | P/E Ratio | Net Income | Implied Stock Price |
|---|---|---|---|
| Current State | 40 | $25M | $50 |
| Margin Expansion (Bull Case) | 40 | $50M | ~$100 |
| Margin Expansion (Conservative) | 20 | $50M | ~$50 |
This is exactly why we prioritize margin expansion over raw revenue growth. A small, focused increase in business efficiency creates outsized shareholder value. You don't need a company to double its sales to make a great trade. You just need them to improve their margins.
What Are the Most Common Mistakes Investors Make When Analyzing Growth vs. Profitability?
Knowing when to prioritize revenue growth vs. profit margins requires market context. Many intermediate traders make critical errors by applying rigid, inflexible rules to dynamic market environments.
Here's a quick checklist our team uses to avoid fundamental value traps:
- Compare top-line revenue growth directly against operating expense growth.
- Check if gross margins are shrinking despite rising total sales.
- Verify that debt interest payments are not wiping out operating profits.
Beyond that checklist, we teach our members to avoid these specific analytical traps:
Punishing Early-Stage Growth Stocks
Don't demand high net margins from young, hyper-growth companies. If a software firm is growing revenue at 50% year-over-year, they should be aggressively reinvesting every available dollar back into sales and marketing. Taxing their own growth just to show Wall Street a tiny net profit is actually bad capital allocation. We accept negative margins in early-stage companies as long as their revenue growth remains explosive.
Ignoring the Cost of Customer Acquisition
Sometimes pure revenue growth is a mirage. If a company spends $200 in marketing to acquire a new customer who only generates $150 in lifetime revenue, their growth is actively destroying the business. Always check the income statement to see if sales and marketing expenses are growing faster than top-line revenue. If marketing costs are spiraling out of control, the revenue growth is artificial and unsustainable.
Failing to Implement Risk Management
Never base a trade solely on a single fundamental metric. Even if a company shows beautiful, consistent margin expansion, a broader market selloff can easily drag the stock down. We prefer to combine fundamental margin analysis with strict technical entry points.
Always use predetermined position sizing and place stop losses at defined technical support levels. We rarely allocate more than 2% to 5% of our total trading portfolio to a single fundamental growth play. Fundamentals tell you what to buy, but risk management dictates how long you get to stay in the game.
Risk Warning: No single metric, whether it's revenue growth, margin expansion, or earnings beats, guarantees a profitable trade. Always pair fundamental analysis with proper position sizing and defined exit strategies. Protect your capital first.
Want expert trading insights delivered daily?
Join thousands of traders who rely on Traders Agency for market analysis and trade ideas.
Join Traders AgencyKey Takeaways
- Revenue growth measures total sales volume, but profit margin reveals whether that growth actually creates economic value. A company can grow revenue 40% while destroying profitability if operating costs grow faster, like 60%.
- Retail traders frequently misread earnings reports by focusing on headline revenue beats while ignoring margin compression, which is why stocks sometimes crash after reporting strong sales growth.
- Profit margin acts as the transmission of a business: revenue is the engine, but margins determine whether that engine converts fuel into forward motion or just burns cash.
- When analyzing SEC filings, tracking margin trends over multiple quarters matters more than any single data point. Expanding margins signal improving efficiency; compressing margins signal a business scaling the wrong way.
- Position sizing discipline applies even to high-conviction fundamental plays. Limiting exposure to 2% to 5% of total portfolio capital per trade is a core risk management principle when trading growth stocks.
DISCLAIMER: Traders Agency does not offer financial advice. The information provided is for educational purposes only and should not be considered financial advice. Traders Agency is not responsible for any financial losses or consequences resulting from the use of the information provided. Trading carries inherent risks and may not be suitable for all individuals. You are advised to conduct your own research and seek personalized advice before making any investment decisions, recognizing the potential risks and rewards involved.
See more from Traders Agency on Google
Make us a preferred source and our market analysis will appear more prominently in your Google Search, Top Stories, and AI results.
Add to Preferred Sources