
You have probably watched a stock climb steadily for months, only to suddenly lose momentum and reverse course. Catching these major trend changes is a primary goal for many traders, but timing the exact top can be incredibly difficult. Fortunately, the market often leaves structural clues before a major selloff occurs. The head and shoulders pattern is one of the most widely recognized visual clues available to technical traders, and our team relies on this specific formation to identify when buyers are losing control and sellers are taking over. We'll walk you through exactly how to spot this setup, confirm it with volume, and execute a trade with precise risk management.
What Is a Head and Shoulders Pattern in Trading?
Bottom Line: The head and shoulders pattern gives traders a structured, repeatable way to identify when an uptrend is failing before the full selloff unfolds. Reliable execution comes down to confirming the neckline break with volume, checking RSI divergence, and placing a stop loss above the right shoulder. Higher timeframes produce the most dependable signals, making this one of the few chart patterns worth building a complete trade plan around.
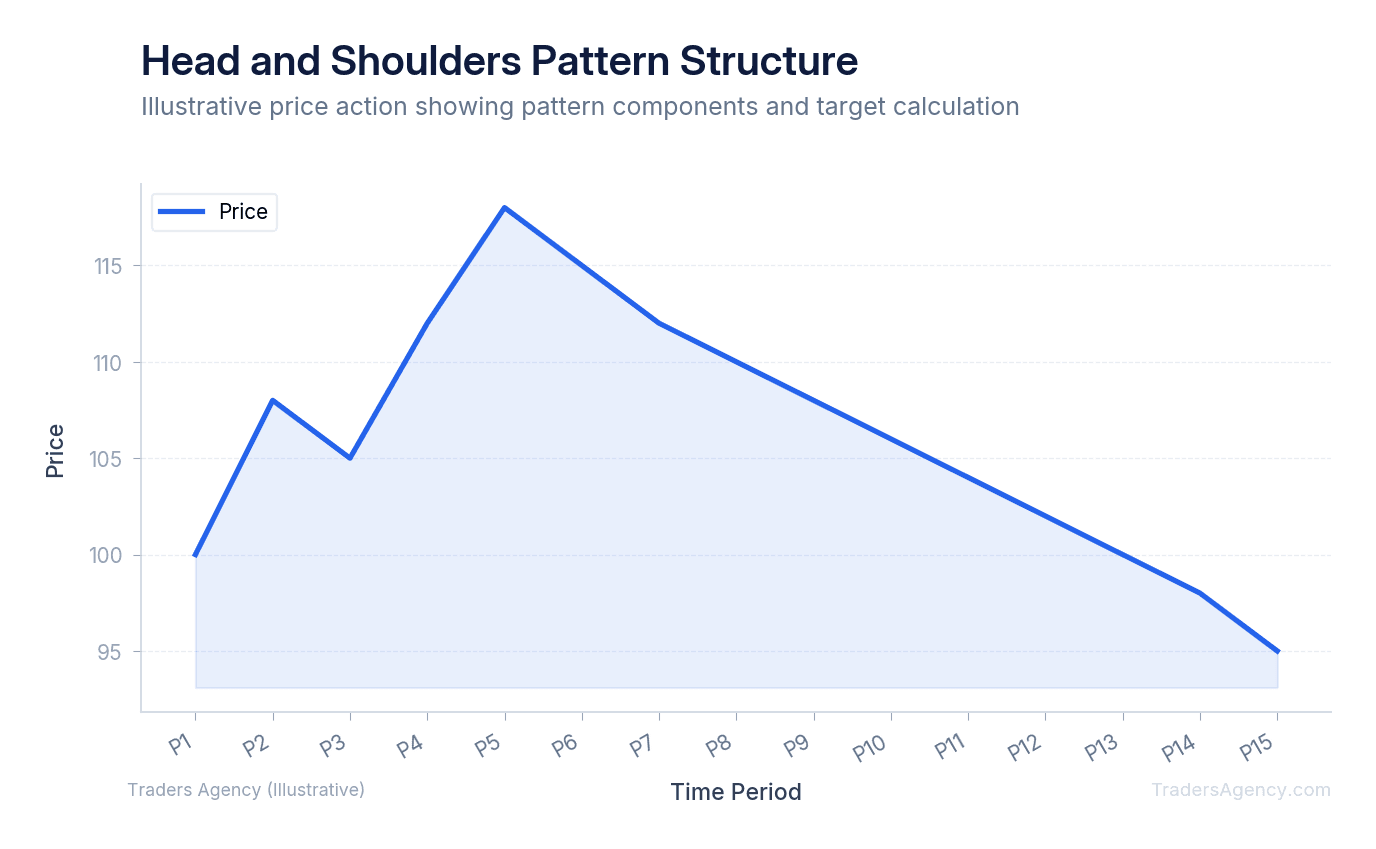
A head and shoulders pattern is a technical analysis chart formation that signals a potential reversal from a bullish uptrend to a bearish downtrend. It consists of three distinct peaks: a left shoulder, a higher central peak called the head, and a lower right shoulder. All three peaks rest on a support line that we call the neckline.
This pattern shows us exactly how an uptrend dies. During the left shoulder, buyers push the price to a new high. The head forms when buyers make one final push to an extreme high, but sellers quickly force the price back down. When the right shoulder forms, it reveals a critical shift in power: buyers attempt to rally the price again, but they fail to reach the previous high. This lower high tells our team that bullish momentum is exhausted. The entire structure rests on the neckline, which connects the lows between the three peaks.
Key Concept: The head and shoulders pattern is a three-peak reversal formation. The middle peak (head) is the highest, flanked by two lower peaks (shoulders), all sitting on a support line called the neckline. A break below the neckline signals the trend reversal.
How Do You Identify a Head and Shoulders Pattern on a Chart?
To trade this setup successfully, you must identify its components in the correct order. We prefer to look for these elements on a clean chart without too many overlapping indicators. The structure should be obvious to the naked eye.
Here is what we look for when scanning for a valid setup:
- Prior Uptrend: The stock must be in an established uptrend before the pattern forms.
- Left Shoulder: A strong price peak followed by a pullback to a support area.
- The Head: A second peak that rises significantly above the left shoulder, followed by a drop back to the same general support area.
- Right Shoulder: A third peak that is lower than the head and roughly equal in height to the left shoulder.
- The Neckline: A trendline drawn across the bottom of the two troughs that separate the shoulders from the head.
The neckline does not have to be perfectly horizontal. In fact, an upward-sloping neckline is common and still valid. However, a downward-sloping neckline often indicates severe weakness and can lead to a more aggressive breakdown.
How Do You Confirm a Head and Shoulders Pattern?
You confirm a head and shoulders pattern by observing declining trading volume during the formation of the right shoulder, followed by a significant volume spike when the price breaks below the neckline. Without this volume expansion on the breakdown, the pattern carries a high risk of being a false signal.
Volume is the fuel that drives market moves. When we teach our members about the head and shoulders pattern, we always emphasize that price action alone is not enough. You need to see institutional participation to validate the reversal.
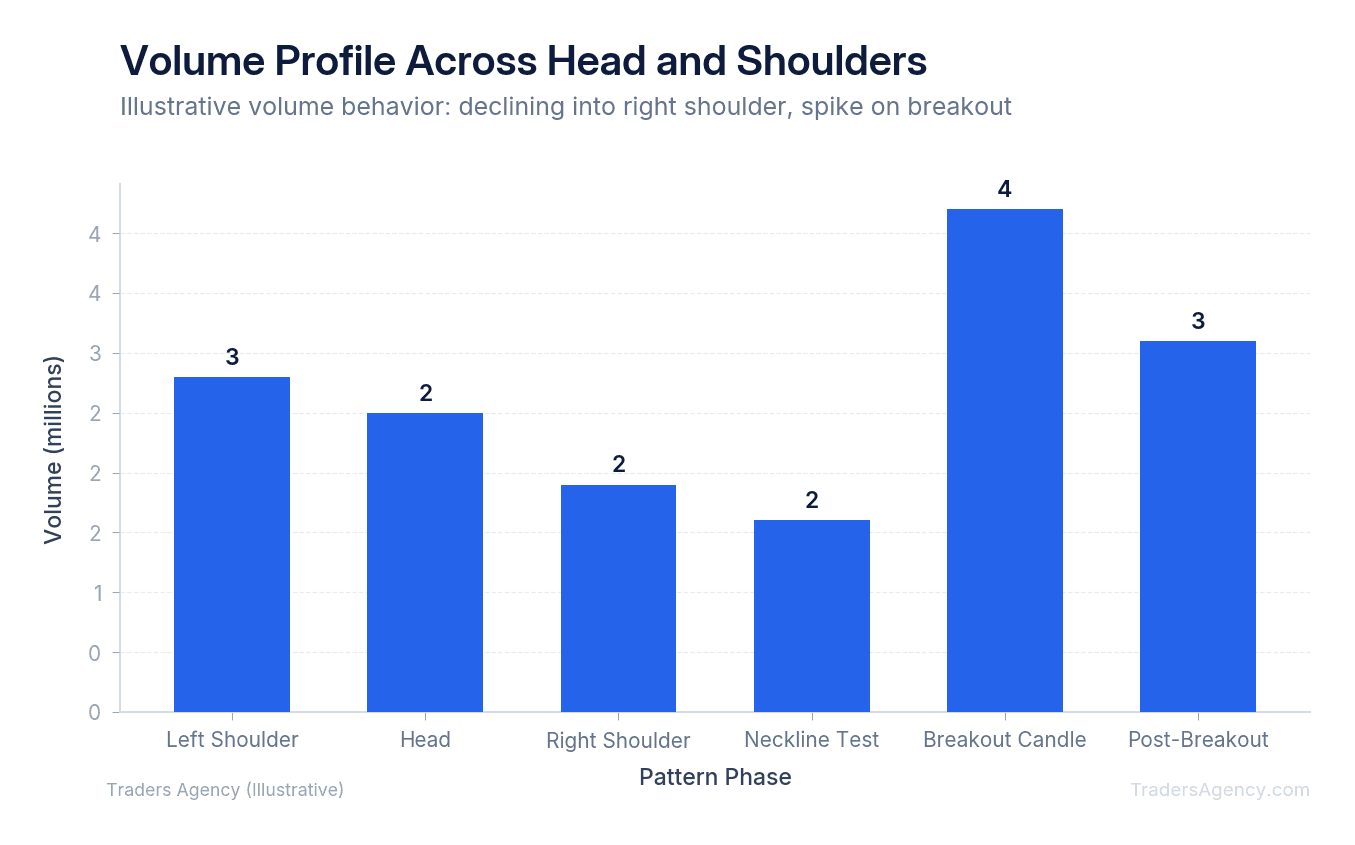
Volume is typically highest during the left shoulder as buyers aggressively push the price up. By the time the head forms, volume often begins to taper. When the right shoulder forms, volume should be noticeably lighter. This declining volume proves that buyers are losing interest. Finally, when the price drops below the neckline support, we want to see a massive surge in volume. This confirms that sellers are actively dumping the stock.
Watch Out: If volume does not expand on the neckline break, treat the signal with extreme caution. Low-volume breakdowns are one of the most common traps in this pattern, and they can lead to sharp reversals that punish short sellers.
How Do You Set a Price Target With the Head and Shoulders Pattern?
You set a price target by measuring the vertical distance from the top of the head down to the neckline. You then subtract this exact dollar amount from the breakout point on the neckline to establish your measured move target. This calculation provides a highly objective way to plan your exit. We don't guess where the stock might stop falling. Instead, we use the measured move target to secure profits systematically.
Here's how we walk through it step by step:
- Calculate the Pattern Height: Imagine you are tracking stock XYZ. The peak of the head reaches $150. The neckline sits directly below it at $140. Subtract $140 from $150 to get a pattern height of $10.
- Project the Target: Identify the exact price where the stock breaks below the neckline. If the neckline is perfectly horizontal at $140, subtract your $10 pattern height from that breakout point. Your official measured move target is $130.
- Execute the Trade Plan: When XYZ closes below $140 on heavy volume, enter a short position or buy put options. Place your stop loss just above the right shoulder (perhaps at $146) to protect your capital. Set your limit order to take profits at your $130 target.
| Parameter | Value |
|---|---|
| Stock | XYZ |
| Head Peak | $150 |
| Neckline / Entry Trigger | $140 |
| Pattern Height | $10 |
| Measured Move Target | $130 |
| Stop Loss (Above Right Shoulder) | $146 |
| Risk per Share | $6 |
| Reward per Share | $10 |
| Risk-to-Reward Ratio | 1 : 1.67 |
This gives you a clear, mathematical framework for the entire trade. Every variable is defined before you risk a single dollar.
Want expert trading insights delivered daily?
Join thousands of traders who rely on Traders Agency for market analysis and trade ideas.
Join Traders AgencyWhen Does This Pattern Fail, and How Do You Avoid False Breakdowns?
A head and shoulders pattern fails when the price drops below the neckline but quickly reverses back upward, trapping short sellers in a false breakdown. This is the most common trap traders face with this setup. The price might dip below the neckline intraday, triggering short sellers, only to rally furiously by the closing bell.
You can reduce your exposure to these traps by following a few protective rules:
- Wait for a daily candle close below the neckline. Intraday dips are not enough. We require the stock to close below support on the daily chart before considering an entry.
- Confirm with volume. A genuine breakdown is accompanied by a clear surge in selling volume. If volume is thin on the break, stay on the sidelines.
- Check for RSI divergence. If the price is breaking the neckline but the Relative Strength Index (RSI) is making higher lows, this creates a bullish divergence. That divergence warns you that downside momentum is actually weak, despite the scary-looking price action.
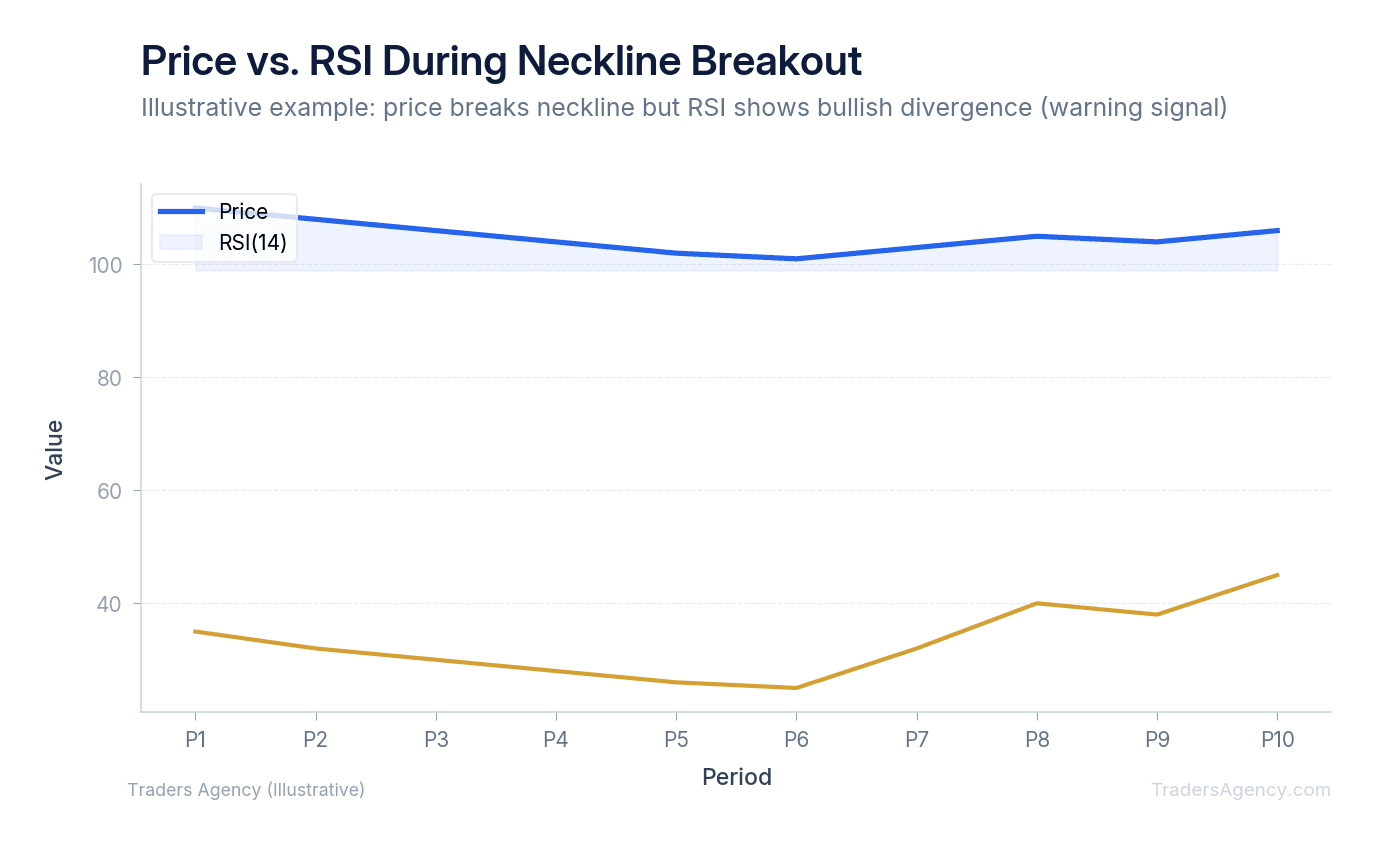
When we see this conflict between price and momentum, we skip the trade entirely. No single pattern works 100% of the time, and protecting your capital from false signals is just as important as catching the real ones.
Watch Out: A false breakdown can trigger a violent short squeeze. If you enter a short position without waiting for a confirmed daily close below the neckline, you risk getting caught in a rapid reversal that can erase your account gains quickly.
Timeframe-Specific Guidance: Where Does This Pattern Work Best?
The head and shoulders pattern works best on higher timeframes like the daily and weekly charts, where institutional trading volume creates more reliable support and resistance levels. While you can spot this pattern on a one-hour chart, intraday noise significantly increases the likelihood of false breakouts and failed reversals.
We always teach our members to respect the hierarchy of timeframes. A head and shoulders reversal on a weekly chart can dictate a stock's trend for the next year. A similar pattern on a five-minute chart might only influence the price for an hour.
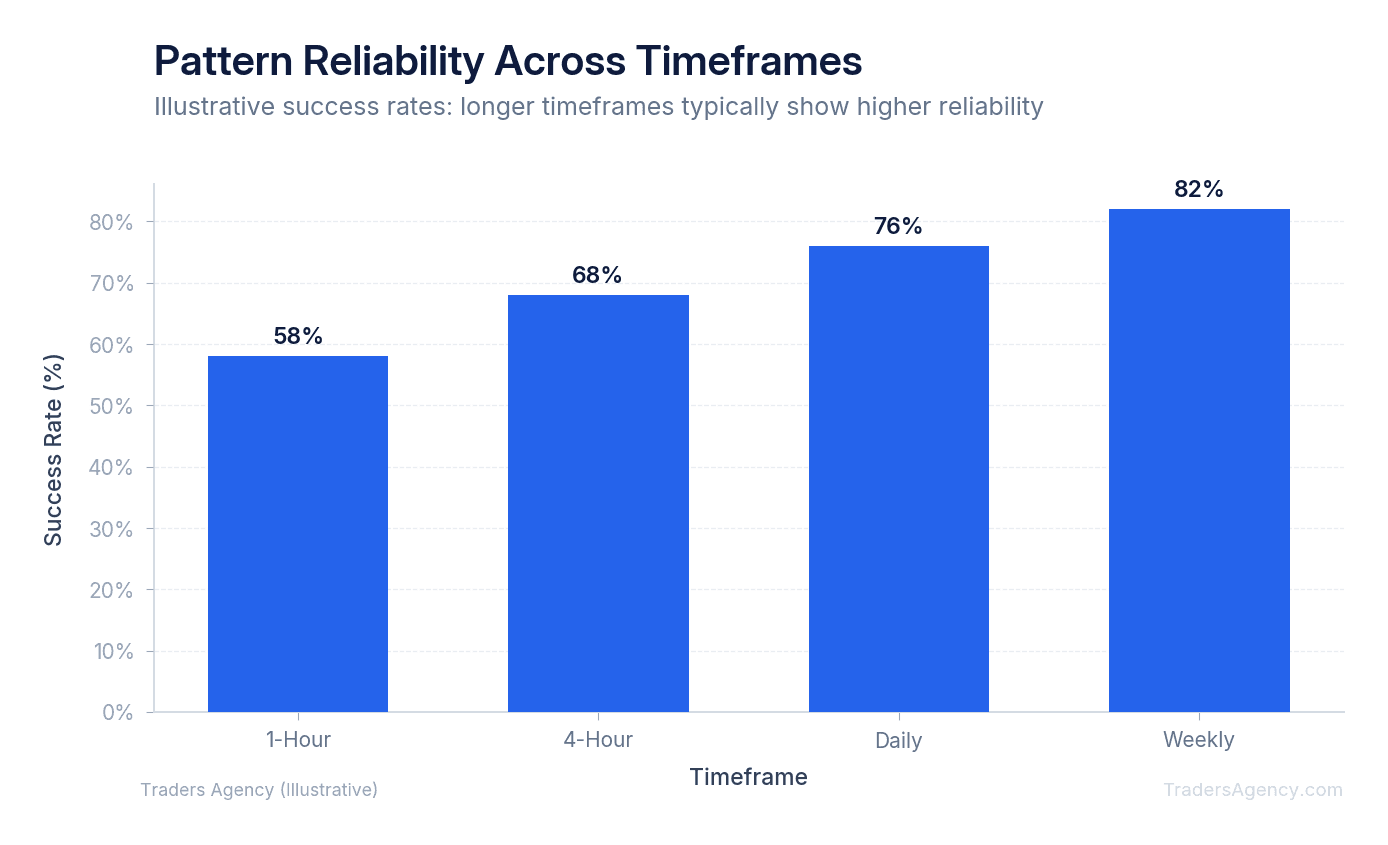
For intermediate traders, we highly recommend sticking to the daily chart for your primary analysis. The daily timeframe filters out the erratic price spikes caused by news algorithms and day traders. If you spot a valid setup on the daily chart, you can then zoom into a 4-hour or 1-hour chart to fine-tune your exact entry price, but the core decision should always come from the higher timeframe.
| Timeframe | Best Use | Reliability |
|---|---|---|
| Weekly | Major trend reversals, position trades | Highest |
| Daily | Swing trades, primary analysis | High |
| 4-Hour | Entry refinement, short-term swings | Moderate |
| 1-Hour | Intraday setups only | Lower (more noise) |
What Is an Inverse Head and Shoulders Pattern?
Everything we have discussed so far applies to market tops. However, the exact same psychology works in reverse at market bottoms. This is called the inverse head and shoulders pattern, and it is one of our favorite setups for buying stocks that are ready to start a new uptrend.
The inverse pattern looks exactly like a standard head and shoulders flipped upside down. You will see a left shoulder (a low), a head (a lower low), and a right shoulder (a higher low). The neckline resistance sits above the pattern.
When trading the inverse setup, volume confirmation is even more essential. Markets can fall under their own weight on low volume, but it takes aggressive buying power to reverse a downtrend. We demand to see massive volume on the breakout above the neckline before committing capital to a long position. You calculate your profit target the exact same way: measure from the bottom of the head to the neckline, and project that distance upward from your breakout point.
Key Concept: The inverse head and shoulders is the bullish mirror image of the standard pattern. Look for three troughs (with the middle trough being the deepest), a neckline resistance above, and a high-volume breakout above that neckline to confirm the reversal from a downtrend into a new uptrend.
For additional reading on how chart patterns reflect market psychology and investor behavior, the SEC's investor education resources provide useful background on understanding technical analysis within the broader context of informed trading.
The head and shoulders pattern gives you a structured, repeatable way to identify trend reversals before they fully develop. Whether you are trading the standard bearish version at market tops or the inverse bullish version at market bottoms, the process is the same: identify the three peaks (or troughs), draw the neckline, confirm with volume, calculate your measured move target, and manage your risk with a stop loss above the right shoulder. Stick to higher timeframes for the most reliable signals, and always check for RSI divergence before committing to a trade. This is how our team approaches every head and shoulders setup, and it is a framework you can start applying to your own charts today.
Want expert trading insights delivered daily?
Join thousands of traders who rely on Traders Agency for market analysis and trade ideas.
Join Traders AgencyKey Takeaways
- The head and shoulders pattern signals a bearish reversal through three peaks: a left shoulder, a higher central head, and a lower right shoulder, all resting on a shared neckline support level.
- The right shoulder is the critical confirmation point: when buyers fail to reach the previous high set by the head, it signals that bullish momentum is exhausted and sellers are taking control.
- Volume behavior matters at each stage: volume should be highest on the left shoulder, lighter on the head, and lowest on the right shoulder, with a surge confirming the neckline break.
- The measured move price target is calculated by subtracting the distance from the head to the neckline from the neckline breakout point, giving traders a concrete downside objective.
- The inverse head and shoulders applies the same framework to market bottoms, with three troughs instead of peaks, and signals a potential reversal from a downtrend to an uptrend.
DISCLAIMER: Traders Agency does not offer financial advice. The information provided is for educational purposes only and should not be considered financial advice. Traders Agency is not responsible for any financial losses or consequences resulting from the use of the information provided. Trading carries inherent risks and may not be suitable for all individuals. You are advised to conduct your own research and seek personalized advice before making any investment decisions, recognizing the potential risks and rewards involved.
See more from Traders Agency on Google
Make us a preferred source and our market analysis will appear more prominently in your Google Search, Top Stories, and AI results.
Add to Preferred Sources