
You have probably seen this happen in the market. Two companies in the exact same sector report identical profit margins, yet one stock consistently outperforms the other year after year. We see traders struggle with this disconnect all the time. The secret often lies in understanding return on equity ROE and how efficiently a company uses its capital to generate those profits. We will walk you through exactly how to calculate these metrics, where to find the data, and how to use them to find high-quality stocks. By the end of this guide, you will know how to spot true economic moats and avoid companies artificially inflating their numbers with debt. Our team relies on these fundamental analysis tools to separate mediocre businesses from compounding wealth machines.
What Is Return on Equity (ROE)?
Return on equity (ROE) is a fundamental profitability ratio calculated by dividing a company's net income by its average shareholders' equity. This metric tells investors how much profit a company generates for every dollar of shareholder capital invested. A higher percentage generally indicates more efficient management and stronger financial health.
When you buy a stock, you are buying a fractional ownership stake in a business. You want the management team to generate a high return on your equity. If a company cannot generate a return higher than your basic cost of capital, it is destroying shareholder value.
Key Concept: Return on Equity (ROE) measures how much profit a company generates for every dollar shareholders have invested. It directly connects corporate profitability to shareholder value creation.
Many beginners ask us why is return on equity important for active traders. It matters because a business that consistently generates high returns on its equity can fund its own growth without constantly diluting shareholders or taking on excessive debt. This self-funding capability often leads to sustained uptrends in the stock price.
How Do You Calculate Return on Equity (ROE)?
You calculate return on equity by taking a company's net income and dividing it by its shareholders' equity (or average shareholders' equity for greater accuracy). You can find both of these figures on a company's standard financial statements filed with regulators through the SEC's EDGAR database.
You pull net income from the bottom line of the income statement. You pull shareholders' equity from the bottom section of the balance sheet. Shareholders' equity is simply a company's total assets minus its total liabilities. This is how to calculate return on equity from balance sheet data combined with the income statement.
Here is a concrete example using a hypothetical software business, TechCorp. We will walk through the exact steps we teach our members.
- Locate Net Income: Pull the company's annual income statement. Assume TechCorp reports a net income of $10 million for the fiscal year. This is the profit left over after all expenses, taxes, and interest are paid.
- Locate Shareholders' Equity: Pull the company's balance sheet. Assume TechCorp has $50 million in shareholders' equity. This represents the net worth of the company belonging to the shareholders.
- Apply the Formula: Divide the $10 million in net income by the $50 million in equity. This gives you 0.20, or a 20% ROE.
| Component | Value |
|---|---|
| Net Income | $10 million |
| Shareholders' Equity | $50 million |
| ROE Calculation | $10M / $50M = 0.20 |
| ROE Percentage | 20% |
For every dollar of equity, TechCorp generates 20 cents in pure profit. Instead of doing this manually for hundreds of stocks, we recommend using a reliable return on equity calculator or a stock screener to filter the market for specific percentages.
How Does the DuPont Formula Break Down ROE?
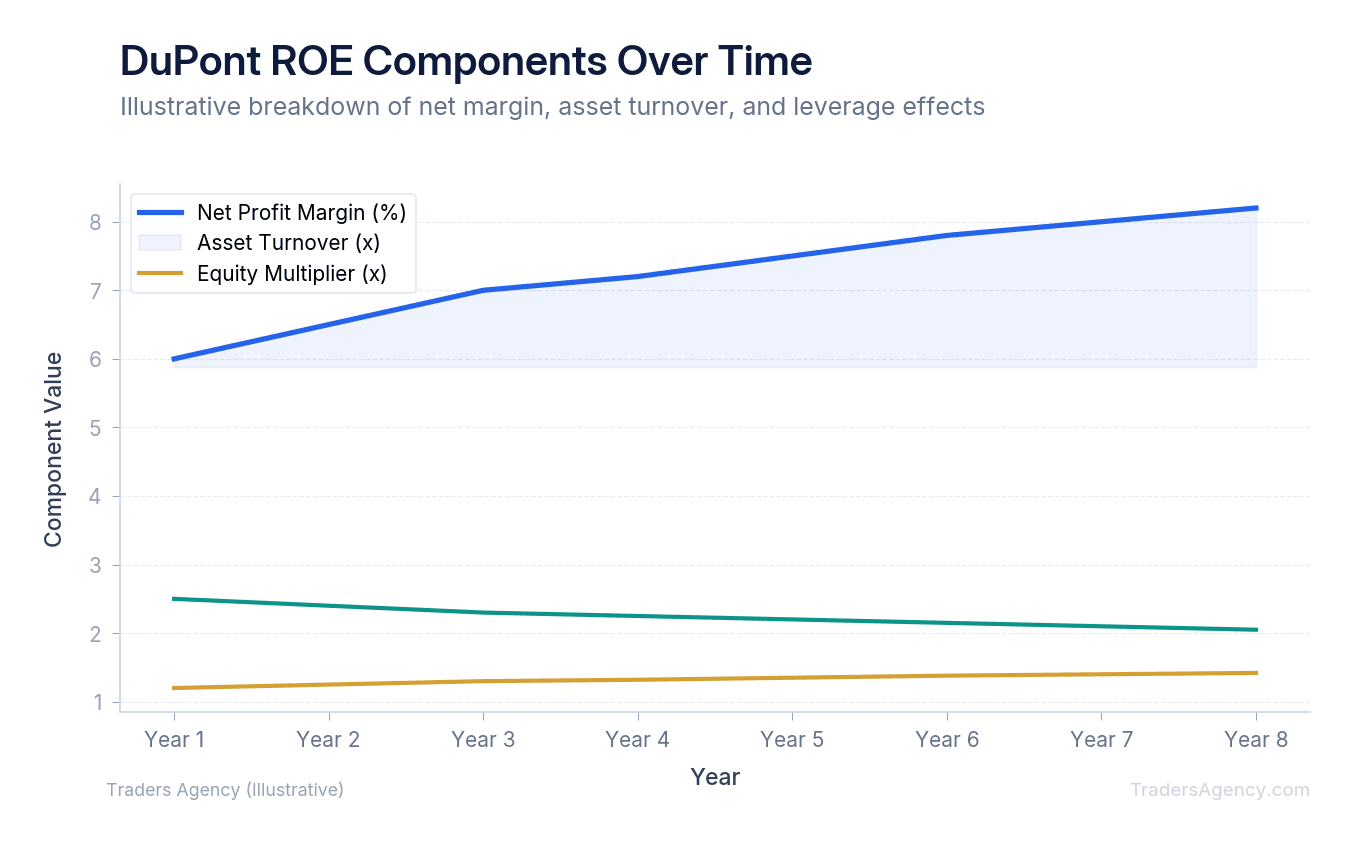
The DuPont formula breaks return on equity into three distinct components: net profit margin, asset turnover, and the equity multiplier. This decomposition helps investors understand exactly what is driving a company's profitability. It reveals whether high returns come from operational efficiency, asset utilization, or excessive corporate borrowing.
We teach our members to always look under the hood of a high ROE. A company can artificially boost its numbers simply by taking on massive amounts of debt. The DuPont method protects you from this trap by splitting the calculation into three specific parts.
- Net Profit Margin (Net Income / Revenue): This measures pricing power and cost control. A rising profit margin means the company is keeping more pennies from every dollar of sales.
- Asset Turnover (Revenue / Average Total Assets): This measures how efficiently the company uses its factories, inventory, and equipment to generate sales. High-volume retailers often have low profit margins but massive asset turnover.
- Equity Multiplier (Average Total Assets / Average Shareholders' Equity): This metric measures financial leverage. If a company takes on more debt to buy assets, this multiplier increases.
Watch Out: If a company reports a 25% ROE, but the DuPont breakdown shows declining profit margins and a skyrocketing equity multiplier, that is a massive red flag. The company is masking operational weakness with debt.
What Is a Good Return on Equity (ROE)?
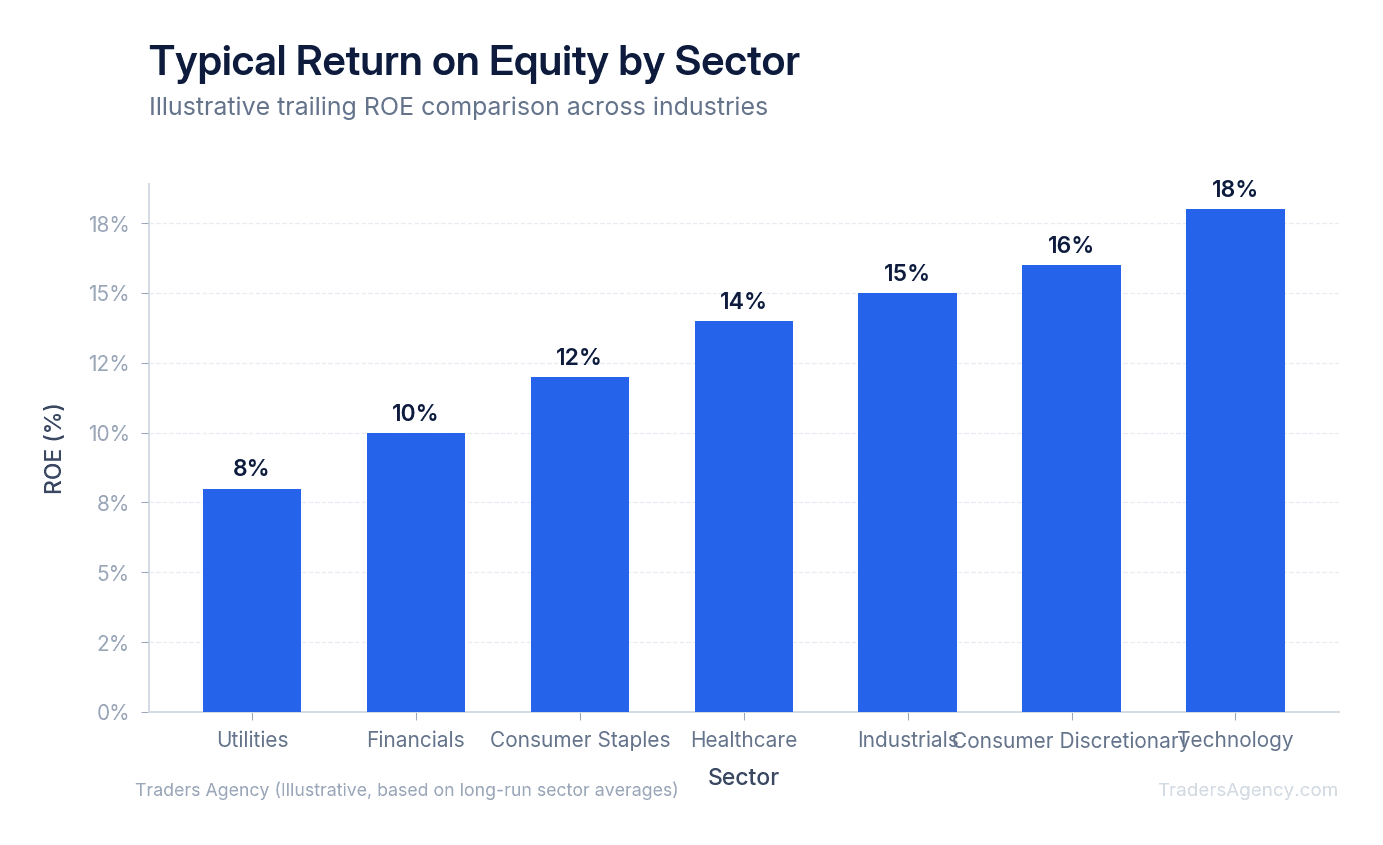
A good return on equity typically ranges between 15% and 20%, but this varies significantly by industry. Capital-intensive sectors like utilities might average 8% to 10%, while technology or consumer staples companies often see averages above 18%. You must always compare a company's ROE to its direct sector peers.
We prefer to look for companies consistently generating an ROE above 15% over a five-year period. Consistency is far more valuable than a single blowout year.
Context is everything in fundamental analysis. A 10% ROE might be excellent for a regional bank operating in a low-interest-rate environment. That same 10% would be terrible for a software-as-a-service provider with low capital requirements. When evaluating what is a good return on equity for a specific stock, always check the industry average. Comparing a steel manufacturer to a cloud computing company will give you useless data.
Want expert trading insights delivered daily?
Join thousands of traders who rely on Traders Agency for market analysis and trade ideas.
Join Traders AgencyWhat Is ROIC and Why Is It Better Than ROE for Comparing Companies?
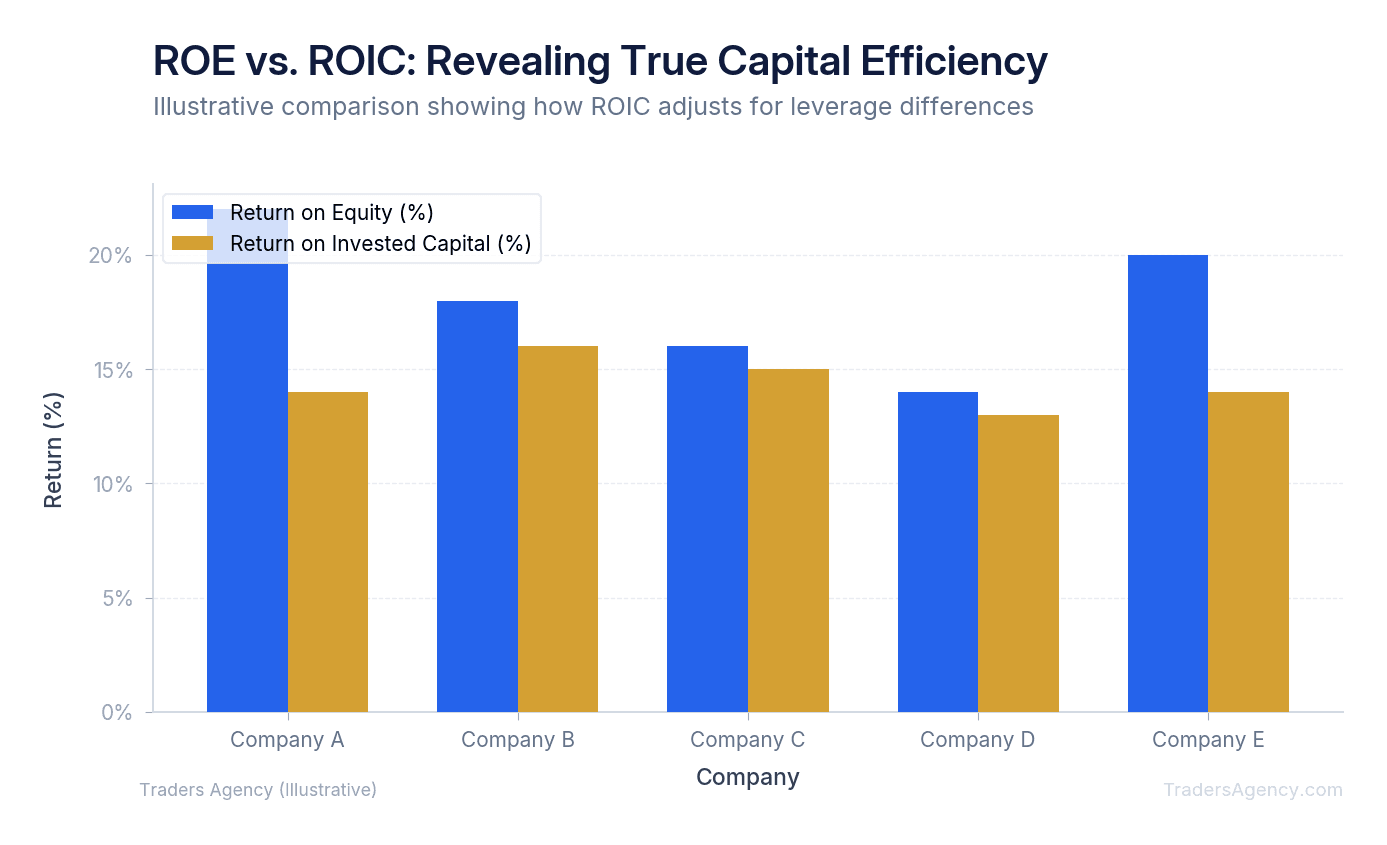
Return on Invested Capital (ROIC) measures how efficiently a company allocates all the capital under its control, including both equity and debt. ROIC is often better than ROE for comparing companies because it removes the distortion of corporate borrowing. This provides a clearer picture of true operational profitability and capital efficiency.
While we love ROE, it has a major blind spot: it completely ignores debt. This is exactly where ROIC fills the gap.
To calculate ROIC, you divide Net Operating Profit After Tax (NOPAT) by Invested Capital. Invested capital is generally total debt plus total equity minus excess cash and equivalents. Here is a comparison of two hypothetical retailers to show why this matters.
- The High-Debt Illusion: Retailer A has a 25% ROE. Retailer B has a 15% ROE. On the surface, Retailer A looks like the superior business.
- The Balance Sheet Reality Check: We dig deeper into the balance sheet data. Retailer A has $500 million in debt. Retailer B has zero debt. Retailer A is funding its operations with borrowed money.
- The True Winner: When we calculate ROIC, Retailer A drops to an 8% ROIC, while Retailer B maintains a 15% ROIC. Retailer B is actually the better business. Retailer A is just using heavy borrowing to juice its equity returns.
| Metric | Retailer A | Retailer B |
|---|---|---|
| ROE | 25% | 15% |
| Total Debt | $500 million | $0 |
| ROIC | 8% | 15% |
| True Winner? | No | Yes |
Key Concept: ROIC strips away the effects of debt financing to reveal how well a company's core operations generate returns on all capital deployed. When ROE and ROIC diverge significantly, debt is distorting the picture.
How Do You Use ROE and ROIC Together to Identify Economic Moats?
Our team recommends using both metrics together to find companies with durable competitive advantages. In the financial world, this advantage is often called an economic moat. A moat protects a business from competitors trying to steal its market share and eat into its profits.
When a company sustains a high ROIC over many years, it proves competitors cannot easily replicate its success. Capitalism dictates that high profits attract competition. If a company can maintain high returns for a decade, they have a true moat.
Here is the exact screening criteria we prefer to use when hunting for high-quality stocks:
- Consistent ROE above 15% for the past five consecutive years.
- Consistent ROIC above 12% for the past five consecutive years.
- A stable or expanding return on assets to confirm physical asset efficiency.
- A debt-to-equity ratio below 1.0 to ensure borrowing is not driving the returns.
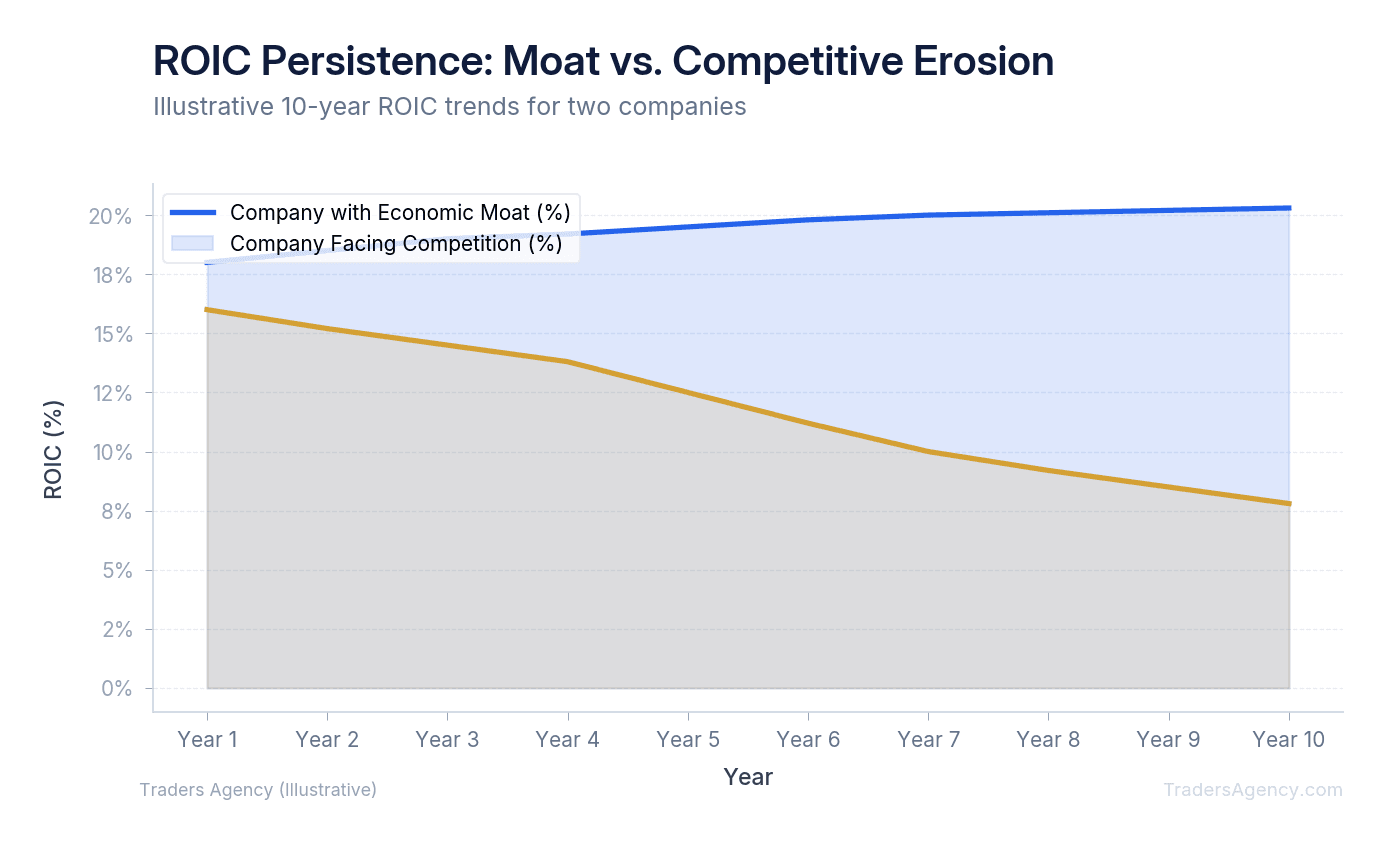
Companies that meet these strict criteria rarely stay cheap for long. They compound capital efficiently. Over a ten-year horizon, stock prices generally follow the trajectory of a company's ROIC.
What Are the Most Common Mistakes Investors Make When Using ROE?
Even experienced traders trip up when analyzing profitability metrics. Fundamental analysis requires attention to detail. Here are the primary traps to avoid when you are evaluating a company's returns.
1. Ignoring Share Buybacks
When a company buys back its own stock, it reduces total shareholders' equity. Because equity is the denominator in the return on equity formula, a massive buyback program will artificially spike the ROE. The company might not be getting more profitable at all. Always check the cash flow statement to see if stock buybacks are inflating the numbers.
2. Overlooking Cyclical Earnings
A commodity company might show a 40% ROE at the absolute peak of an economic cycle. That does not mean it is a great long-term hold. The return will crash the moment commodity prices fall. We teach our members to look at average returns across a full five-to-seven-year business cycle.
3. Falling for One-Time Charges
Sometimes a great company will report a terrible ROE for a single year because of a one-time write-down or legal settlement. This temporarily depresses net income. If the core business remains strong, this temporary dip can actually provide a great entry point for a trade.
4. Forgetting Risk Management
Never buy a stock based on a single financial metric. A high ROE does not protect you from broader market selloffs, sector rotation, or sudden management changes. We prefer to combine fundamental quality filters with strict technical risk management. Limit your position sizing to 2% to 5% of your total portfolio per trade, and always know your exact stop-loss exit point before you enter the position.
Risk Warning: No single metric tells the whole story. Always combine ROE and ROIC analysis with proper position sizing, stop-loss discipline, and broader market awareness. A fundamentally strong company can still decline significantly during market-wide corrections.
Our education team publishes new strategy guides and market analysis every week. If you found this breakdown of ROE and ROIC useful, put these screening criteria to work on your watchlist today. The difference between average traders and great ones often comes down to understanding the quality of the businesses behind the ticker symbols.
Want expert trading insights delivered daily?
Join thousands of traders who rely on Traders Agency for market analysis and trade ideas.
Join Traders AgencyKey Takeaways
- ROE is calculated by dividing net income by average shareholders' equity, showing how much profit is generated per dollar of shareholder capital invested.
- A high ROE driven by excessive debt can be misleading. ROIC strips out the distortion of leverage by measuring returns on all invested capital, not just equity.
- Companies that consistently generate ROE and ROIC above their cost of capital are compounding shareholder value. Those that fall below it are destroying it.
- Using ROE and ROIC together helps identify genuine economic moats, separating businesses with durable competitive advantages from those inflating returns through financial engineering.
- Even fundamentally strong companies with high ROE and ROIC can decline sharply during broad market corrections, so these metrics must be paired with position sizing and stop-loss discipline.
DISCLAIMER: Traders Agency does not offer financial advice. The information provided is for educational purposes only and should not be considered financial advice. Traders Agency is not responsible for any financial losses or consequences resulting from the use of the information provided. Trading carries inherent risks and may not be suitable for all individuals. You are advised to conduct your own research and seek personalized advice before making any investment decisions, recognizing the potential risks and rewards involved.
See more from Traders Agency on Google
Make us a preferred source and our market analysis will appear more prominently in your Google Search, Top Stories, and AI results.
Add to Preferred Sources



