
You've probably watched a stock drop 10% on earnings day even though revenue went up. That disconnect between price and value is exactly what intrinsic value calculation models are designed to explain. We're going to walk you through how to calculate a company's true worth using a Discounted Cash Flow (DCF) model. By the end of this guide, you'll know how to build a basic model, apply it to real stocks, and avoid the common traps that catch intermediate traders. Our team relies on these models every day to separate overpriced hype from genuine market opportunities.
What Is Intrinsic Value in a DCF Model?
Bottom Line: A DCF model is not a crystal ball, it is a structured way to pressure-test whether a stock's price reflects its actual cash-generating potential. The real edge comes from pairing it with relative valuation, sector-specific assumptions, and technical context. Master the inputs, stress-test the outputs, and use the model as one disciplined lens rather than the final word.
Intrinsic value in a DCF model represents the total present value of all expected future cash flows a company will generate. It calculates what a business is worth today by estimating its future profits and discounting them back to current dollars using a specific rate of return.
The core logic is straightforward. A dollar today is worth more than a dollar tomorrow because you can invest today's dollar to earn interest. We teach our members to view buying a stock as buying a stream of future cash. If you know exactly how much cash a business will produce over the next ten years, you can calculate exactly what you should pay for it today.
You can find the raw data needed for these calculations in official company 10-K filings. The SEC's EDGAR database provides the exact free cash flow numbers required to start your analysis. Intrinsic value calculation models rely entirely on the accuracy of this historical data to project future performance.
Key Concept: Intrinsic value is what a company is actually worth based on its future cash-generating ability, not what the market says it's worth on any given day. The gap between intrinsic value and market price is where trading opportunities live.
How to Build a Simple Two-Stage DCF Model
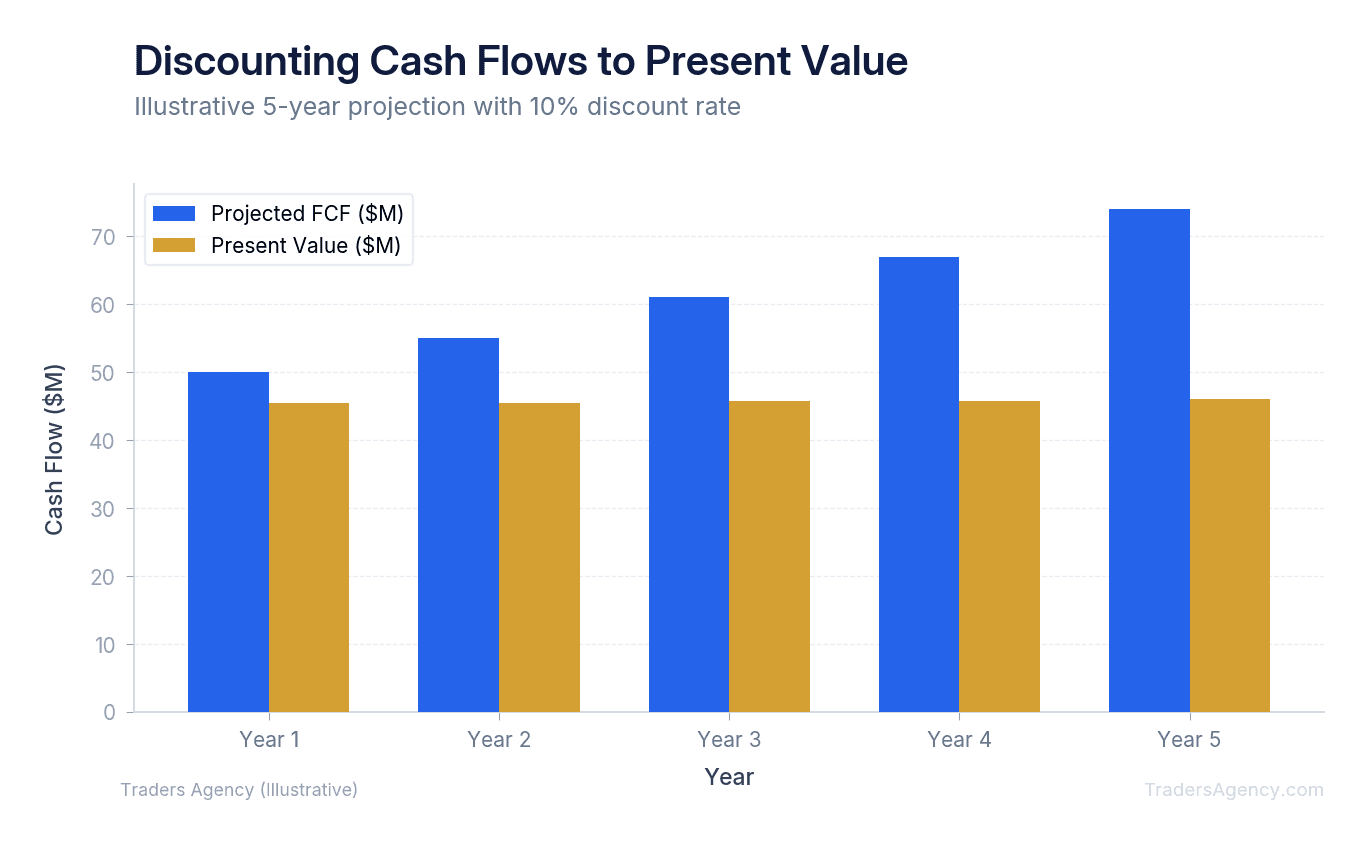
Building a two-stage DCF model requires projecting free cash flows for an explicit forecast period (usually five to ten years) and then calculating a terminal value for all years after. You then discount both stages back to present value to find the total intrinsic value.
We prefer the two-stage approach because it balances detail with practicality. You cannot accurately predict year-by-year cash flows for the next fifty years. Instead, you project the near term in detail and use a stable growth rate for the long term.
Here are the three core steps:
- Project Free Cash Flow: Start with the company's current Free Cash Flow (FCF). Estimate a growth rate for the next five years. If a company generated $100 million in FCF this year and grows at 10%, next year's FCF is $110 million. Repeat this projection for each year in your forecast window.
- Determine the Discount Rate: You need a discount rate to bring those future millions back to today's value. Most analysts use the Weighted Average Cost of Capital (WACC). This represents the minimum return an investor expects for taking on the risk of buying the stock. A higher WACC means more risk and a lower present value.
- Calculate Terminal Value: This represents the value of the company from year six into infinity. Because you can't forecast individual years forever, you apply a stable long-term growth rate to the final year's cash flow and discount the result back to today. We'll show you the exact formula in the next section.
How Do You Calculate Terminal Value in a DCF Model?
You calculate terminal value using the Gordon Growth Model, which grows the final year's cash flow by (1 + g) and then divides by the discount rate minus the long-term growth rate. This gives you the company's perpetual value as of the final forecast year.
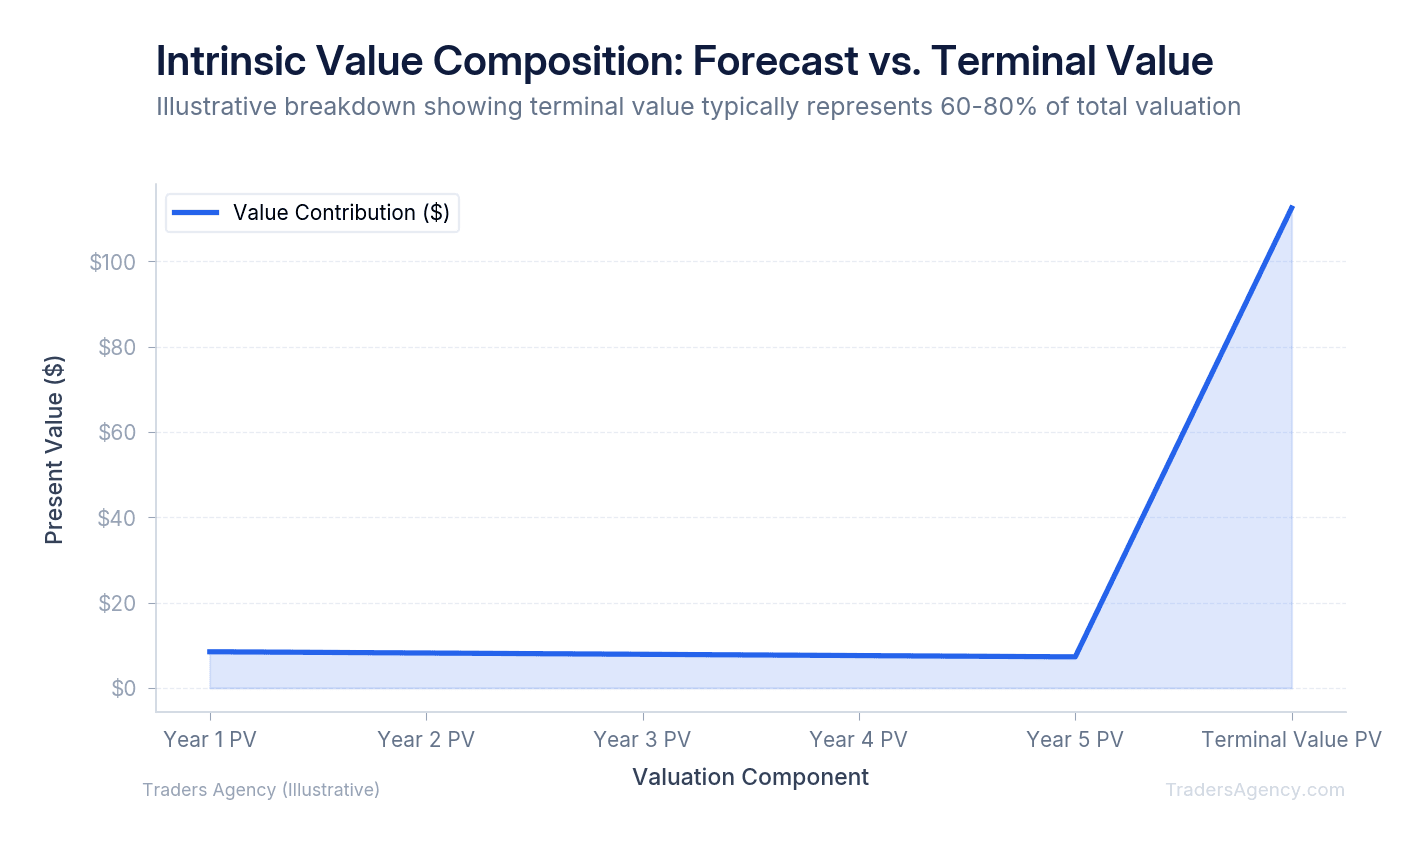
The terminal value often makes up 70% to 80% of your total intrinsic value. Because it carries so much weight, a small error here ruins your entire model. We recommend using a long-term growth rate that matches the overall economy's growth.
A terminal growth rate of 2% to 3% is realistic for most mature businesses. If you assume a company will grow at 8% forever, your DCF model will output an impossibly high price target. That's a red flag, not a buying signal.
Watch Out: Terminal value dominates your DCF output. If you use an aggressive long-term growth rate, you'll inflate the entire model and trick yourself into overpaying for a stock. Stick to 2% to 3% for mature companies.
Want expert trading insights delivered daily?
Join thousands of traders who rely on Traders Agency for market analysis and trade ideas.
Join Traders AgencyWhat Does a DCF Model Look Like Step by Step?
We'll work through a concrete example using a hypothetical technology stock, TechCorp. We'll assume TechCorp currently generates $500 million in free cash flow. Our goal is to find its fair value before buying shares.
Step 1: Project Cash Flows for Years 1 Through 5
We assume a 12% growth rate for the initial stage:
| Year | Projected Free Cash Flow |
|---|---|
| Year 1 | $560 million |
| Year 2 | $627 million |
| Year 3 | $702 million |
| Year 4 | $787 million |
| Year 5 | $881 million |
Step 2: Discount to Present Value
We apply a WACC of 9% as our discount rate. Each year's cash flow gets divided by (1 + 0.09)^n, where n is the year number. The present value of these five years totals roughly $2.7 billion.
Step 3: Calculate Terminal Value
We take the Year 5 cash flow of $881 million, grow it by a 2.5% terminal rate to get $903 million, and divide by our 9% discount rate minus the 2.5% growth rate (6.5%). This gives us a terminal value of approximately $13.9 billion.
Step 4: Find the Intrinsic Value Per Share
We discount the terminal value back to today, which equals roughly $9.0 billion. Adding the two stages together, TechCorp has an enterprise value of approximately $11.7 billion. If TechCorp has 100 million shares outstanding and no debt, the intrinsic value per share is approximately $117.
| Component | Value |
|---|---|
| Present Value of 5-Year Cash Flows | $2.7 billion |
| Discounted Terminal Value | $9.0 billion |
| Total Enterprise Value | $11.7 billion |
| Shares Outstanding | 100 million |
| Intrinsic Value Per Share | $117 |
Many traders build a DCF spreadsheet in Excel to automate this math. Once you set up the formulas, you can easily plug in different growth rates to see how the final price changes.
Practical Sensitivity Analysis: Testing Your Assumptions
Sensitivity analysis tests how sensitive your final valuation is to changes in your initial assumptions. By adjusting the discount rate and terminal growth rate up or down by small increments, you create a range of possible intrinsic values rather than relying on one single price target.
No one can predict the future perfectly. That's why we teach our members to use a margin of safety. If your model says a stock is worth $117, you don't buy it at $115. You wait until it drops to $90 or lower to protect your capital from unforeseen errors.
To find your buying zone, run different scenarios. What if interest rates rise and your discount rate jumps to 11%? What if a recession hits and short-term growth drops to 6%?
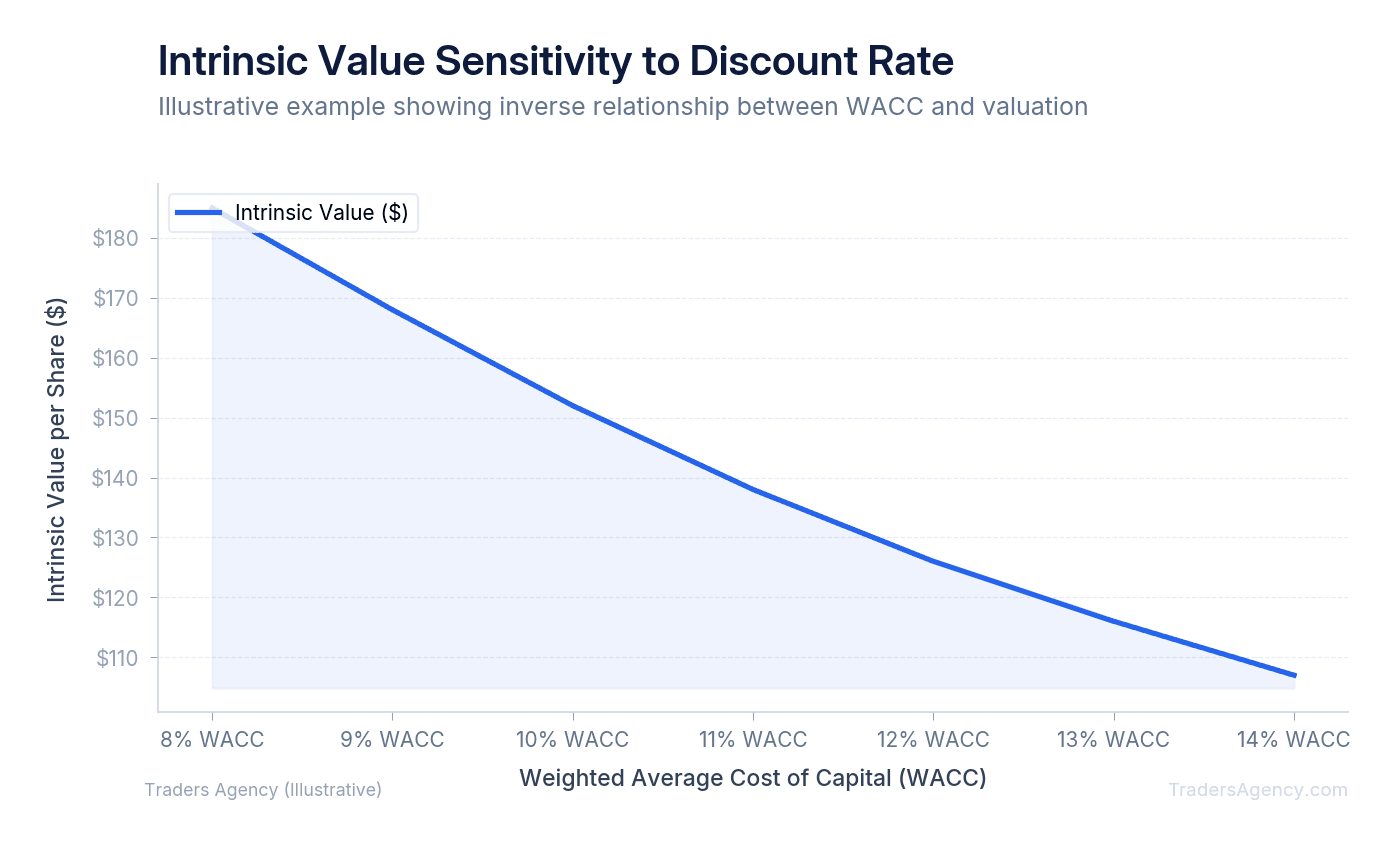
Good DCF models always include a sensitivity table. This shows you the best-case, worst-case, and base-case scenarios side by side. A simple 1% increase in your discount rate can easily drop your final intrinsic value by 15% or more.
Key Concept: A margin of safety is the difference between your calculated intrinsic value and the price you actually pay. We recommend a minimum 20% to 25% discount to your intrinsic value estimate before entering a position.
Do DCF Assumptions Change Depending on the Sector?
You cannot evaluate a high-growth software company using the same assumptions as a mature grocery chain. Different sectors require entirely different inputs to produce accurate valuations. Applying a generic formula across the board is a guaranteed way to lose money.
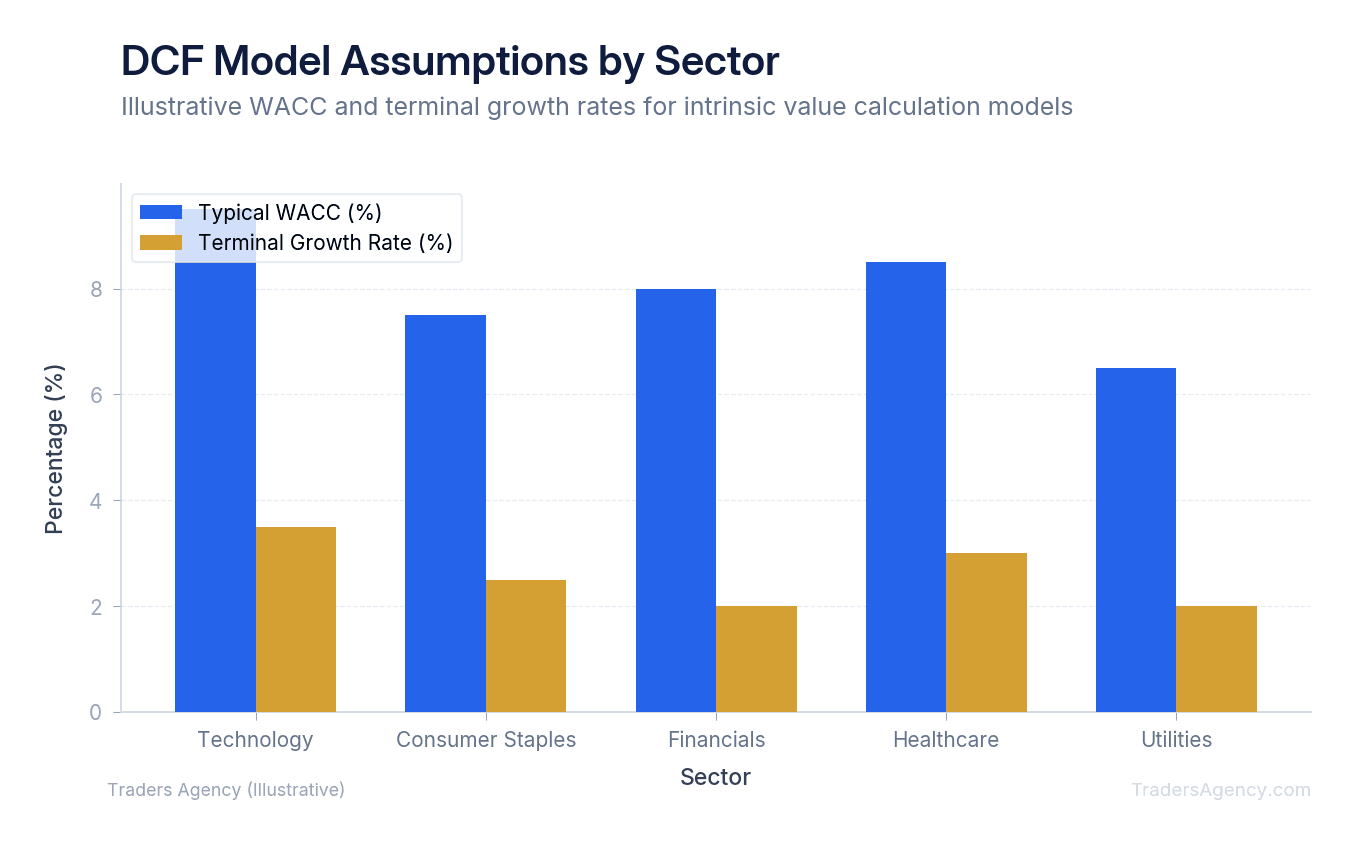
Here's how our team adjusts assumptions based on industry:
| Sector | Short-Term Growth Rate | Discount Rate (WACC) | Notes |
|---|---|---|---|
| Technology | 15% to 25% | 10% to 12% | Higher discount rate accounts for rapid innovation risk and shifting consumer preferences |
| Consumer Staples | 4% to 6% | 7% to 8% | Stable demand regardless of economic conditions. People always buy food and household goods |
| Financials | Varies | Varies | Standard DCF often fails here. Banks use debt as raw material. We recommend a Dividend Discount Model instead for names like JPM or BAC |
When Should You NOT Use a DCF Model?
You should not use a DCF model for early-stage startups with negative cash flows, financial institutions, or companies with highly unpredictable revenue streams. These models rely heavily on predictable future cash generation, making them unreliable for businesses that are currently losing money.
Recognizing when a strategy fails is just as important as knowing how it works. Intrinsic value calculation models are highly sensitive to small input changes. We see intermediate traders make several common mistakes when running these calculations.
Here are the primary pitfalls to avoid:
- Ignoring debt: You must subtract total debt and add cash to your final enterprise value to find the true equity value. A company worth $10 billion with $4 billion in debt only has $6 billion in equity value.
- Double-counting growth: Don't assume a company will grow at 20% for ten years and then assign it a high terminal growth rate. Growth always slows down as companies get larger and capture more market share.
- Garbage in, garbage out: If you input unrealistic growth projections, the model will justify buying an overpriced stock. Your outputs are only as reliable as your inputs.
Watch Out: Always compare your DCF output with other valuation metrics like the Price-to-Earnings (P/E) ratio. If your model says a stock is incredibly cheap but the P/E ratio is 85, you likely made an error in your growth assumptions. Cross-referencing keeps your trading grounded in reality.
The best use of a DCF model is as one tool in a broader toolkit. Pair it with relative valuation, technical analysis, and a clear understanding of the company's competitive position. That combination gives you the confidence to act when a real opportunity appears.
Want expert trading insights delivered daily?
Join thousands of traders who rely on Traders Agency for market analysis and trade ideas.
Join Traders AgencyKey Takeaways
- A DCF model calculates intrinsic value by estimating future free cash flows and discounting them back to today's dollars, because a dollar today is worth more than a dollar in the future.
- Raw inputs for a DCF model come from official 10-K filings available on the SEC's EDGAR database, specifically the free cash flow figures.
- A two-stage DCF model separates the forecast period (typically 10 years) from the terminal value, which captures all cash flows beyond that window.
- Sensitivity analysis is essential: small changes in your growth rate or discount rate assumptions can swing your intrinsic value estimate dramatically, which is why testing multiple scenarios matters.
- Always cross-reference your DCF output against relative metrics like the P/E ratio. If your model shows a stock as deeply undervalued but the P/E sits at 85, revisit your growth assumptions before acting.
DISCLAIMER: Traders Agency does not offer financial advice. The information provided is for educational purposes only and should not be considered financial advice. Traders Agency is not responsible for any financial losses or consequences resulting from the use of the information provided. Trading carries inherent risks and may not be suitable for all individuals. You are advised to conduct your own research and seek personalized advice before making any investment decisions, recognizing the potential risks and rewards involved.
See more from Traders Agency on Google
Make us a preferred source and our market analysis will appear more prominently in your Google Search, Top Stories, and AI results.
Add to Preferred Sources