
You find an exciting new technology stock, pull up its financial data, and see a blank space next to the Price-to-Earnings (P/E) ratio. The company spends all its cash on growth, generates no net profit, and the standard P/E metric becomes completely useless. So how do you value a company that isn't profitable yet? We'll show you exactly how to use the price to sales ratio to evaluate these early-stage businesses, where to find reliable data, and how to apply this metric to your own trading strategy.
How Do You Calculate the Price-to-Sales Ratio?
Bottom Line: The price to sales ratio fills a real gap in fundamental analysis: it gives you a way to value companies that have no earnings to measure. But its usefulness depends entirely on context, specifically industry benchmarks, margin trends, and balance sheet health. Think of it as a starting point for deeper research, not a standalone verdict.
The Price-to-Sales ratio compares a company's stock price to its total revenue. This calculation helps you determine how much the market values every dollar of a company's sales. To calculate it, divide the company's total market capitalization by its trailing twelve months (TTM) of revenue. You can also divide the current stock price by sales per share. Both methods yield the exact same valuation multiple.
Key Formula: Market Capitalization ÷ Total Revenue = P/S Ratio. This tells you how many dollars investors are willing to pay for every one dollar of sales the company generates.
Our team recommends using the market capitalization method. The data is readily available on any standard stock screener, and it avoids rounding errors that sometimes occur with per-share calculations.
Here's a quick example: if a company has a $10 billion market cap and generates $2 billion in annual sales, its P/S ratio is 5.0. That means investors are paying five dollars for every one dollar of revenue.
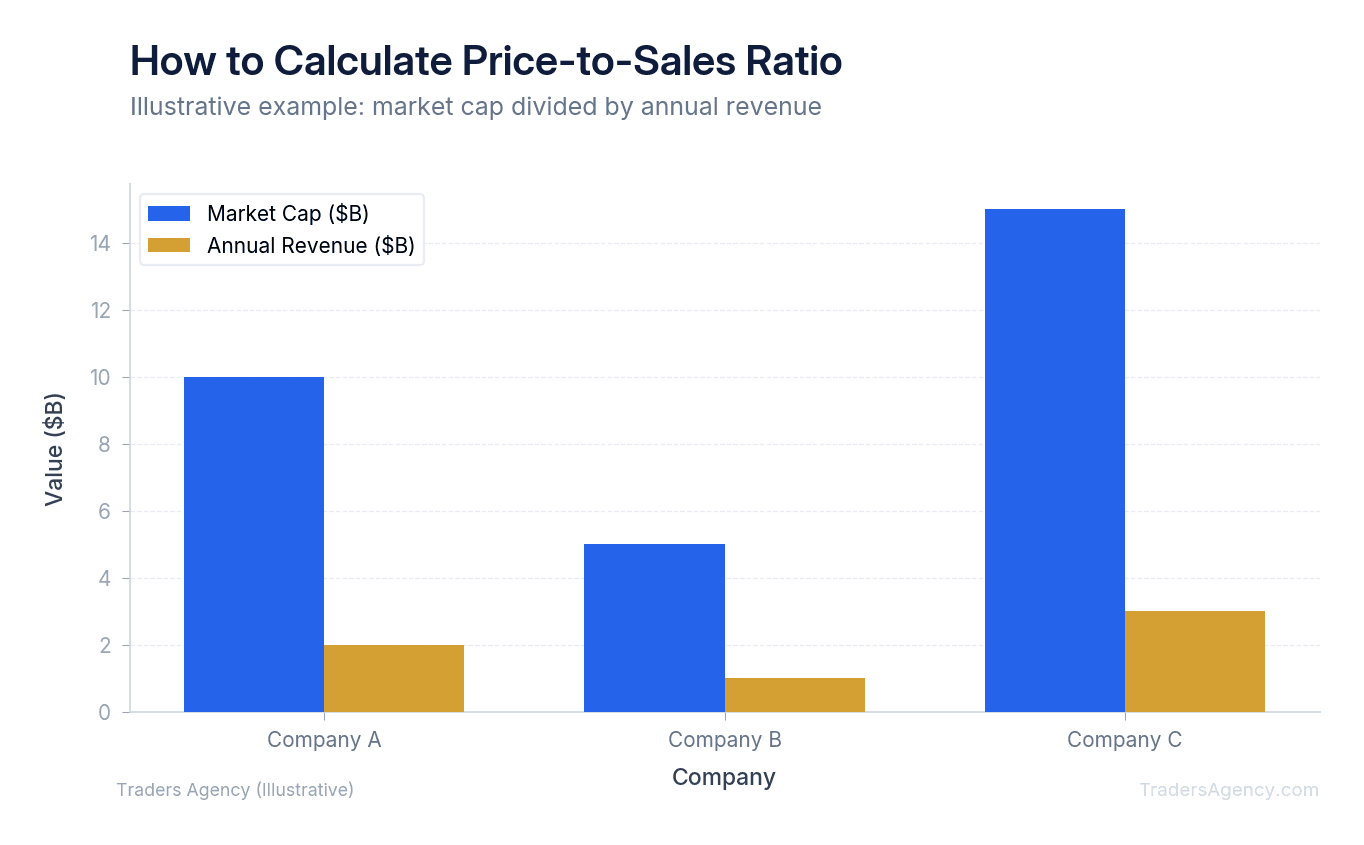
You can also use the per-share method. If a stock trades at $50.00 per share and generates $10.00 in revenue per share, the ratio is still 5.0. We prefer the total market cap approach simply because it prevents rounding errors that sometimes occur with per-share data.
Where to Find Reliable Revenue Data
You cannot calculate an accurate ratio without reliable data. We teach our members to go directly to the source whenever possible.
The most accurate revenue figures come from the company's official SEC filings. Look at the annual 10-K report or the quarterly 10-Q report filed with the Securities and Exchange Commission. These documents contain audited income statements.
For quick screening, free financial websites provide trailing twelve months (TTM) revenue. TTM simply means the total sales from the past four consecutive quarters. Using TTM data ensures your calculation reflects the most recent business performance rather than outdated annual numbers.
How Does the P/S Ratio Compare to the P/E Ratio?
The P/S ratio measures a company against its total revenue, while the P/E ratio measures a company against its net income. The P/E ratio requires a company to be profitable to function, whereas the P/S ratio works perfectly for companies that operate at a loss.
When analyzing the Price-to-Sales ratio vs. P/E, you must understand that revenue is much harder to manipulate than earnings. Accounting practices can easily inflate or deflate net income through depreciation schedules, tax adjustments, or one-time write-offs. Sales figures represent actual money coming through the door.
| Characteristic | P/S Ratio | P/E Ratio |
|---|---|---|
| What it measures | Price relative to revenue | Price relative to net income |
| Works for unprofitable companies? | Yes | No |
| Susceptible to accounting manipulation? | Less so | More so |
| Accounts for profitability? | No | Yes |
| Best used for | Growth stocks, early-stage companies | Mature, profitable businesses |
However, ignoring profitability comes with significant risks. Two companies might generate $100 million in sales and share identical P/S ratios. If Company A keeps $40 million in gross profit and Company B keeps only $5 million, the P/S ratio alone will not reveal this massive difference in operational efficiency. This is why P/E remains the gold standard for mature, profitable businesses.
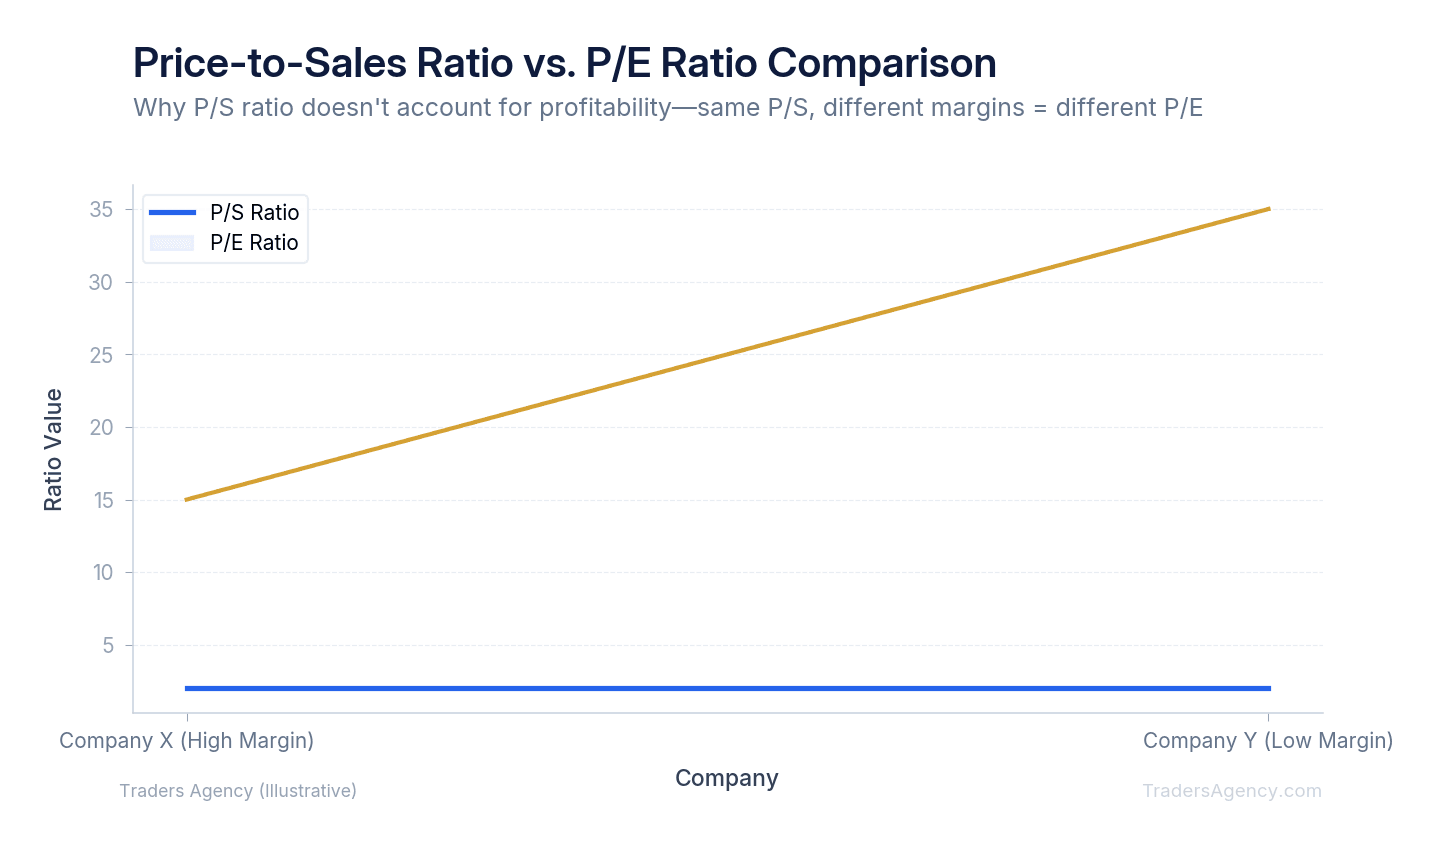
We use the P/S ratio primarily for growth stocks, biotechnology firms, and newly public companies. Once a company achieves consistent profitability, we transition to using the P/E ratio for our primary valuation.
What Is a Good Price-to-Sales Ratio?
A good Price-to-Sales ratio generally falls between 1.0 and 2.0 for the broader market, but this standard varies significantly depending on the specific sector. Value investors typically look for ratios under 1.0, which suggests the stock might be undervalued relative to its revenue generation.
When traders ask us what counts as a high Price-to-Sales ratio, we point to the context of the business model. A ratio above 10.0 is generally considered high and indicates aggressive growth expectations from the market. If the company fails to deliver that expected growth, the stock price usually drops significantly. High multiples leave very little room for error in execution.
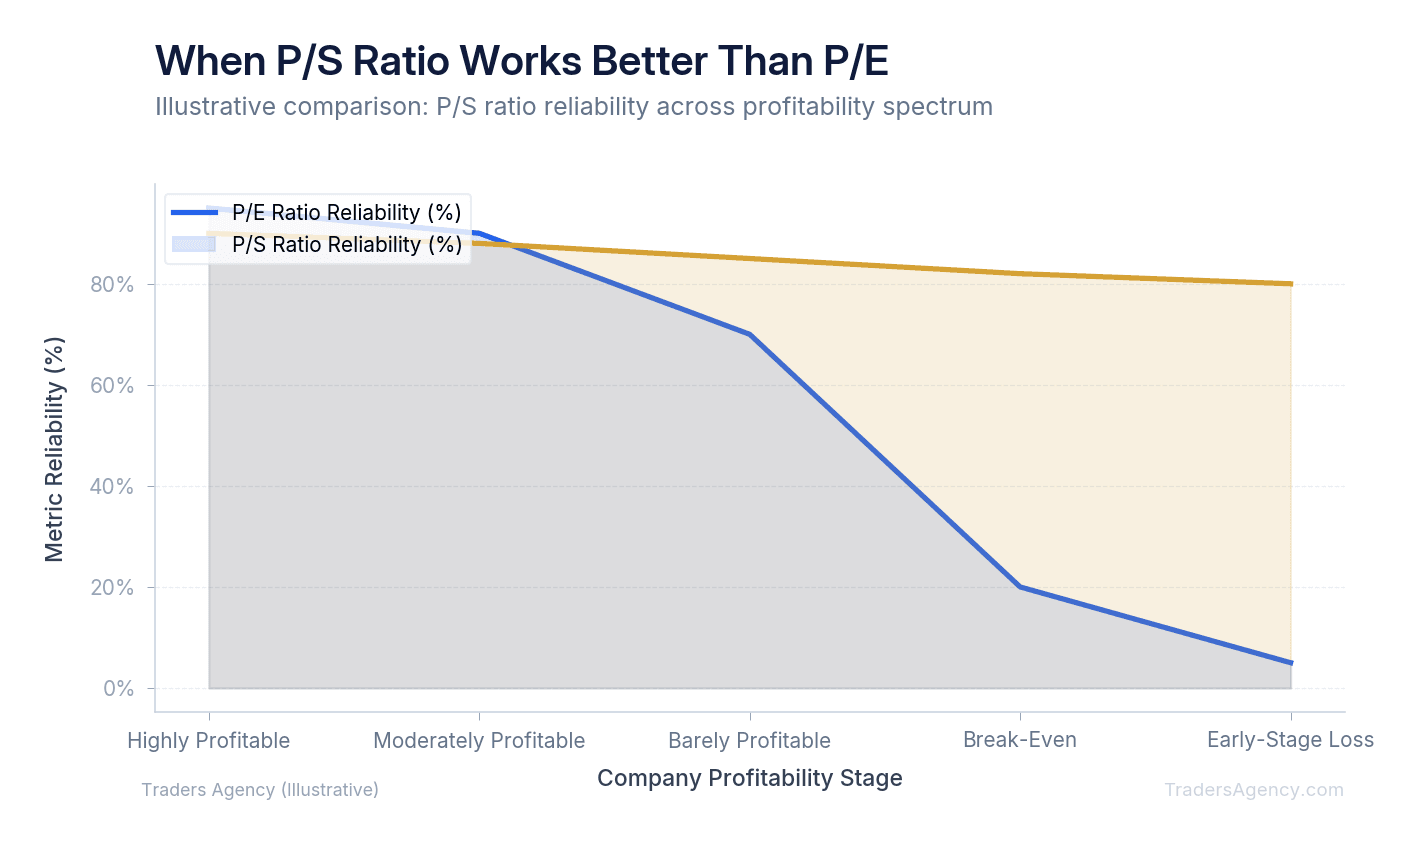
So, is a high or low P/S ratio better for your portfolio? We prefer to buy companies with lower multiples because they carry less valuation risk. A low multiple means you pay less for the company's revenue stream.
Watch Out: A very low P/S ratio can also indicate a dying business. If a company has a ratio of 0.1, the market is essentially saying its revenue is worthless because bankruptcy is likely. Always investigate why the multiple is low before buying.
Want expert trading insights delivered daily?
Join thousands of traders who rely on Traders Agency for market analysis and trade ideas.
Join Traders AgencyHow Do You Interpret the Price-to-Sales Ratio by Industry?
You cannot compare a grocery store to a software company. Different business models generate different profit margins, and this reality directly impacts the Price-to-Sales ratio by industry.
Software-as-a-Service (SaaS) companies often trade at P/S ratios between 8.0 and 15.0. These businesses have incredibly high gross margins, often keeping 80 cents of every dollar they make. The market rewards this efficiency with a higher valuation multiple.
Retail and grocery businesses operate on razor-thin margins. A grocery chain might keep only two cents of net profit for every dollar of sales. Because of this, retail stocks typically trade at P/S ratios between 0.2 and 0.5.
| Industry | Typical P/S Range | Gross Margin |
|---|---|---|
| SaaS / Cloud Software | 8.0 - 15.0 | ~80% |
| Biotechnology | 5.0 - 20.0+ | Varies widely |
| Manufacturing | 1.0 - 2.0 | ~30-40% |
| Utilities | 1.5 - 3.0 | ~40-50% |
| Retail / Grocery | 0.2 - 0.5 | ~25-30% |
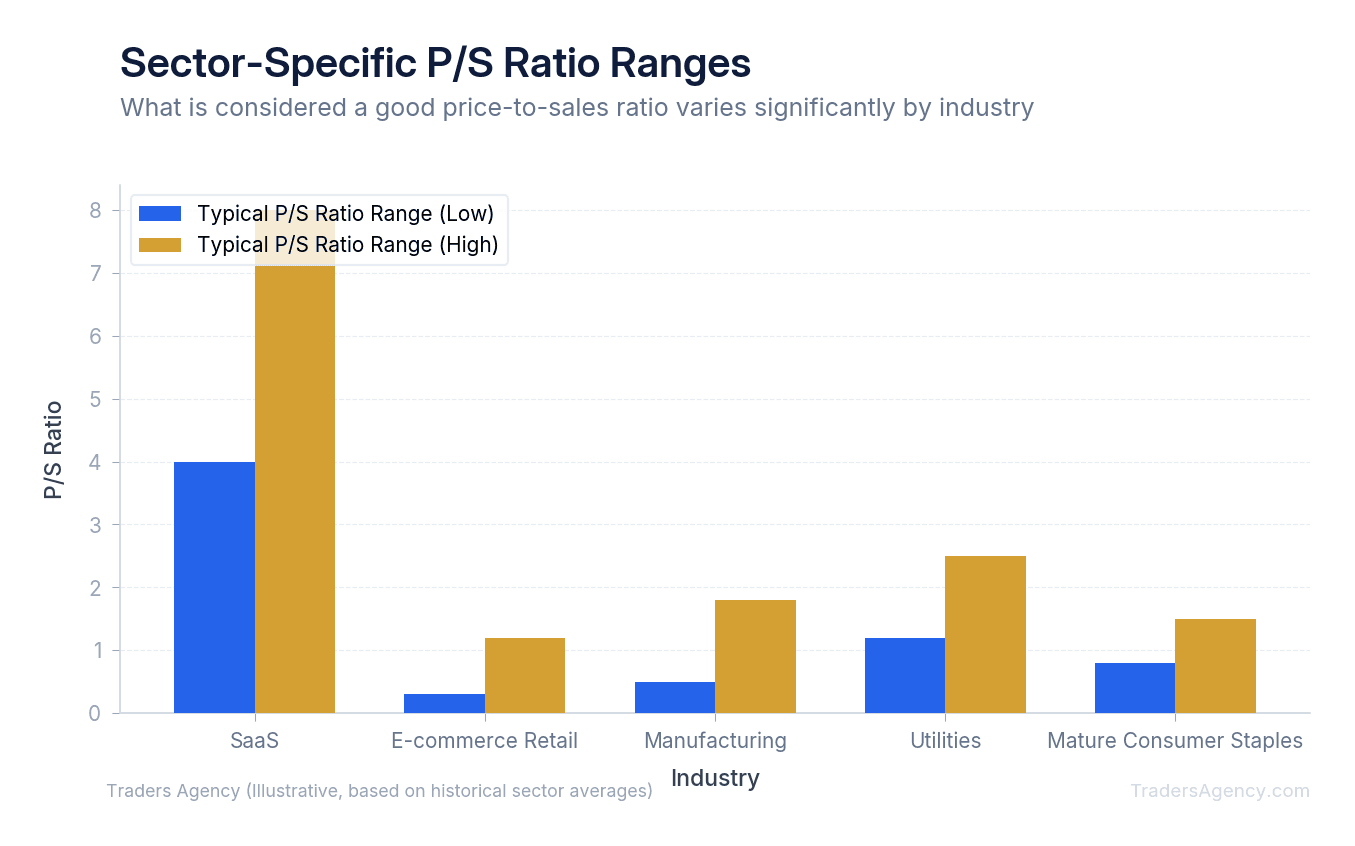
If you find a manufacturing company trading at a P/S of 6.0, that stock is likely overvalued. If you find a fast-growing cloud computing stock trading at a P/S of 6.0, it might be a bargain. You must always compare a stock to its direct competitors within the exact same sector.
Step-by-Step: A Price-to-Sales Ratio Example
We want to show you exactly how to apply this in the real world. Here's a concrete example using two hypothetical early-stage electric vehicle manufacturers. Both companies are unprofitable, so we cannot use the P/E ratio.
We'll compare VoltMotors (Ticker: VOLT) and SparkAuto (Ticker: SPRK).
- Gather the Financial Data: Pull the trailing twelve-month revenue and current market cap for both companies.
- VoltMotors Market Cap: $5 billion
- VoltMotors Revenue: $500 million
- SparkAuto Market Cap: $3 billion
- SparkAuto Revenue: $750 million
- Apply the Formula: Divide the market cap by the total revenue for each stock.
- VoltMotors: $5 billion ÷ $500 million = 10.0 P/S Ratio
- SparkAuto: $3 billion ÷ $750 million = 4.0 P/S Ratio
- Evaluate the Results: VoltMotors trades at a multiple of 10.0, while SparkAuto trades at a multiple of 4.0. On a purely revenue basis, SparkAuto is much cheaper. You're paying four dollars for every dollar of SparkAuto's sales, compared to ten dollars for VoltMotors.
- Investigate the Difference: We never stop at the calculation. We must ask why the market prices VoltMotors so much higher. Perhaps VoltMotors is growing sales at 50% per year, while SparkAuto is only growing at 10%. The P/S ratio highlights the valuation gap, but your fundamental analysis must explain it.
| Metric | VoltMotors (VOLT) | SparkAuto (SPRK) |
|---|---|---|
| Market Cap | $5 billion | $3 billion |
| TTM Revenue | $500 million | $750 million |
| P/S Ratio | 10.0 | 4.0 |
| Relative Value | Expensive on revenue basis | Cheaper on revenue basis |
How Do You Use the P/S Ratio in an Actual Investment Decision?
Finding the ratio is only the first step. You need a systematic way to apply this data to your actual portfolio. Here's the approach we use:
- Build a peer group: Compile a list of five to ten direct competitors operating in the exact same market. We never look at a single company's multiple in a vacuum.
- Chart P/S ratios alongside growth rates: A company growing sales at 40% annually deserves a higher multiple than a competitor growing at 5%. If we find a company with the fastest growth rate but the lowest P/S multiple in its peer group, we flag that stock for immediate research.
- Track historical P/S ratios: If a stock historically trades at a multiple of 3.0 but suddenly spikes to 8.0 without a major change in its business model, the stock is likely overbought. Waiting for the multiple to return to its historical average is a basic risk management practice.
- Confirm with additional metrics: Pair the P/S ratio with gross margin trends and balance sheet health before making a final decision.
What Are the Limitations of the P/S Ratio?
Every financial metric has blind spots. We teach our members never to use a single ratio in isolation to make an investment decision.
The biggest flaw of the price to sales ratio is that it completely ignores debt. A company could generate $1 billion in sales and trade at a low P/S ratio of 0.5. On the surface, this looks like an incredible value. However, if that same company carries $5 billion in high-interest debt, bankruptcy might be imminent. The P/S ratio will not warn you about a toxic balance sheet.
Key Concept: Professional traders often upgrade to Enterprise Value to Sales (EV/Sales). Enterprise value equals total market cap plus all outstanding debt minus cash on hand. Dividing enterprise value by total revenue gives you a much clearer picture of what it actually costs to buy the company's sales. If a stock has a low P/S ratio but a massive EV/Sales ratio, you immediately know debt is skewing the valuation.
To protect yourself, our team recommends combining the P/S ratio with gross margin trends. You want to see revenue growing while gross margins either remain stable or expand. If sales are increasing but margins are shrinking rapidly, the company is essentially buying its revenue through heavy discounting.
Always check the balance sheet for total liabilities. By pairing revenue valuation with a basic health check on debt, you greatly reduce your risk of buying a failing business.
Risk Warning: Never rely on the P/S ratio alone. A low multiple can mask dangerous levels of debt, declining margins, or a business model that will never achieve profitability. Always cross-reference with the balance sheet and cash flow statement before committing capital.
Want expert trading insights delivered daily?
Join thousands of traders who rely on Traders Agency for market analysis and trade ideas.
Join Traders AgencyKey Takeaways
- The P/S ratio is calculated by dividing market capitalization by trailing twelve months (TTM) revenue. A company with a $10 billion market cap and $2 billion in sales has a P/S ratio of 5.0, meaning investors pay $5 for every $1 of sales.
- Use the market cap method over the per-share method. It pulls cleaner data from standard stock screeners and avoids rounding errors in per-share calculations.
- P/S ratios only make sense within the same industry. A software company at 10x sales may be fairly valued while a grocery retailer at the same multiple would be wildly overpriced, because margins differ dramatically between sectors.
- A low P/S ratio is not automatically a buy signal. It can mask heavy debt loads, shrinking margins, or a business model that will never turn profitable. Always cross-reference with the balance sheet and cash flow statement.
- If a company's margins are shrinking rapidly, it may be buying revenue through heavy discounting, which inflates sales figures without building a sustainable business.
DISCLAIMER: Traders Agency does not offer financial advice. The information provided is for educational purposes only and should not be considered financial advice. Traders Agency is not responsible for any financial losses or consequences resulting from the use of the information provided. Trading carries inherent risks and may not be suitable for all individuals. You are advised to conduct your own research and seek personalized advice before making any investment decisions, recognizing the potential risks and rewards involved.
See more from Traders Agency on Google
Make us a preferred source and our market analysis will appear more prominently in your Google Search, Top Stories, and AI results.
Add to Preferred Sources



