
A sector rotation strategy is an active investment approach that involves moving capital from one industry sector to another based on the phases of the economic cycle. You have probably seen this happen in your own trading account. One month, technology stocks are breaking out to new highs, and the next month, they stall while utility stocks suddenly surge. Our education team sees many intermediate traders get caught off guard by these sudden shifts. We are going to walk you through how to anticipate these capital flows instead of chasing them. By the end of this guide, you will know how to track market cycles, identify leading sectors, and apply intermarket analysis to confirm your trading signals.
What Is a Sector Rotation Strategy and How Does It Work?
Bottom Line: Sector rotation is a repeatable framework built on the idea that institutional capital moves through market sectors in a sequence that roughly follows the economic cycle. Traders who combine relative strength analysis with intermarket confirmation signals may be better positioned to stay aligned with those flows, though no approach eliminates the risk of loss when exogenous shocks disrupt normal patterns.
A sector rotation strategy works by capitalizing on the predictable flow of institutional money across different market sectors as the economy expands and contracts. Traders use this method to overweight their portfolios in industries expected to outperform while reducing exposure to sectors that typically lag during the current economic phase.
To understand what sector rotation means in stock market terms, you have to look at how large institutions manage risk. They rarely sell all their stocks and move entirely to cash. Instead, they rotate their capital into different areas of the market. If they expect economic growth to slow, they sell high-growth technology stocks and buy defensive consumer staples.
Key Concept: Sector rotation is the movement of institutional capital from one market sector to another based on where we are in the economic cycle. The goal is to be positioned in sectors that benefit from current conditions, not yesterday's conditions.
The best sector rotation strategy aims to spot these institutional footprints early. We teach our members to follow the money rather than fighting the trend. If you own shares of a high-flying software company, but institutional money is rotating into utilities and healthcare, your software stock will likely struggle to gain ground regardless of its earnings reports. Understanding this flow of capital gives you a distinct edge in timing your entries and exits.
How Does the Business Cycle Affect Sector Performance?
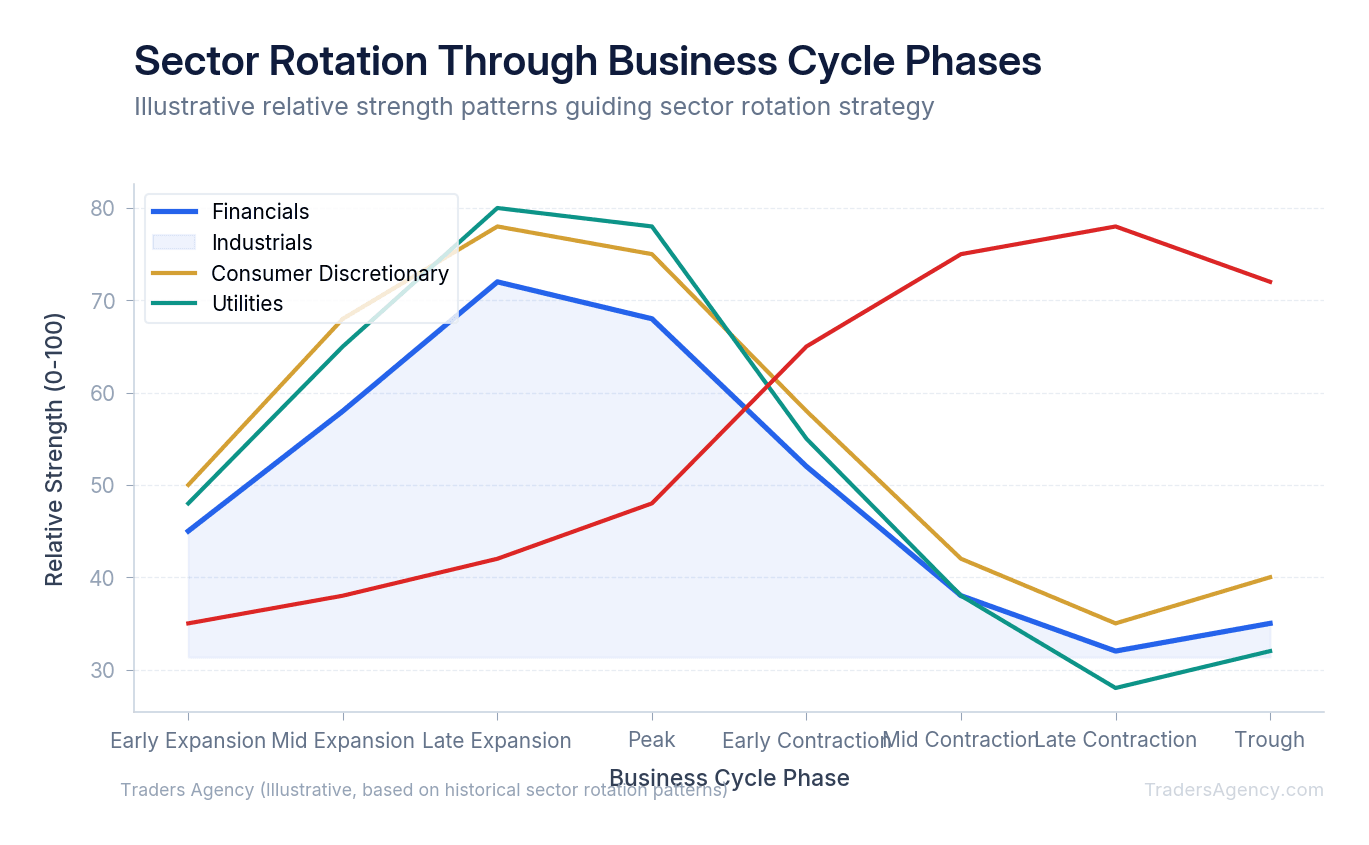
The economy moves through four distinct phases: early expansion, late expansion, early contraction, and late contraction. Each phase favors specific business models. We prefer to map our trades directly to these economic shifts.
- Early Expansion: Interest rates are low, and economic growth is accelerating. We look for strength in Financials, Consumer Discretionary, and Technology. Consumers are borrowing and spending, which drives revenues in these groups.
- Late Expansion: Growth peaks and inflation starts to rise. Capital typically rotates into Industrials, Basic Materials, and Energy. Companies in these sectors benefit from high demand and rising commodity prices.
- Early Contraction: The economy slows down, and interest rates often peak. Traders rotate heavily into defensive areas like Consumer Staples and Health Care. Consumers will always buy food, medicine, and basic household goods, even during a recession.
- Late Contraction: The economy bottoms out, and interest rates fall. Utilities and Telecom usually take the lead before the cycle resets. These sectors offer high dividend yields that become very attractive when interest rates drop.
How Intermarket Analysis Confirms Sector Rotation Signals
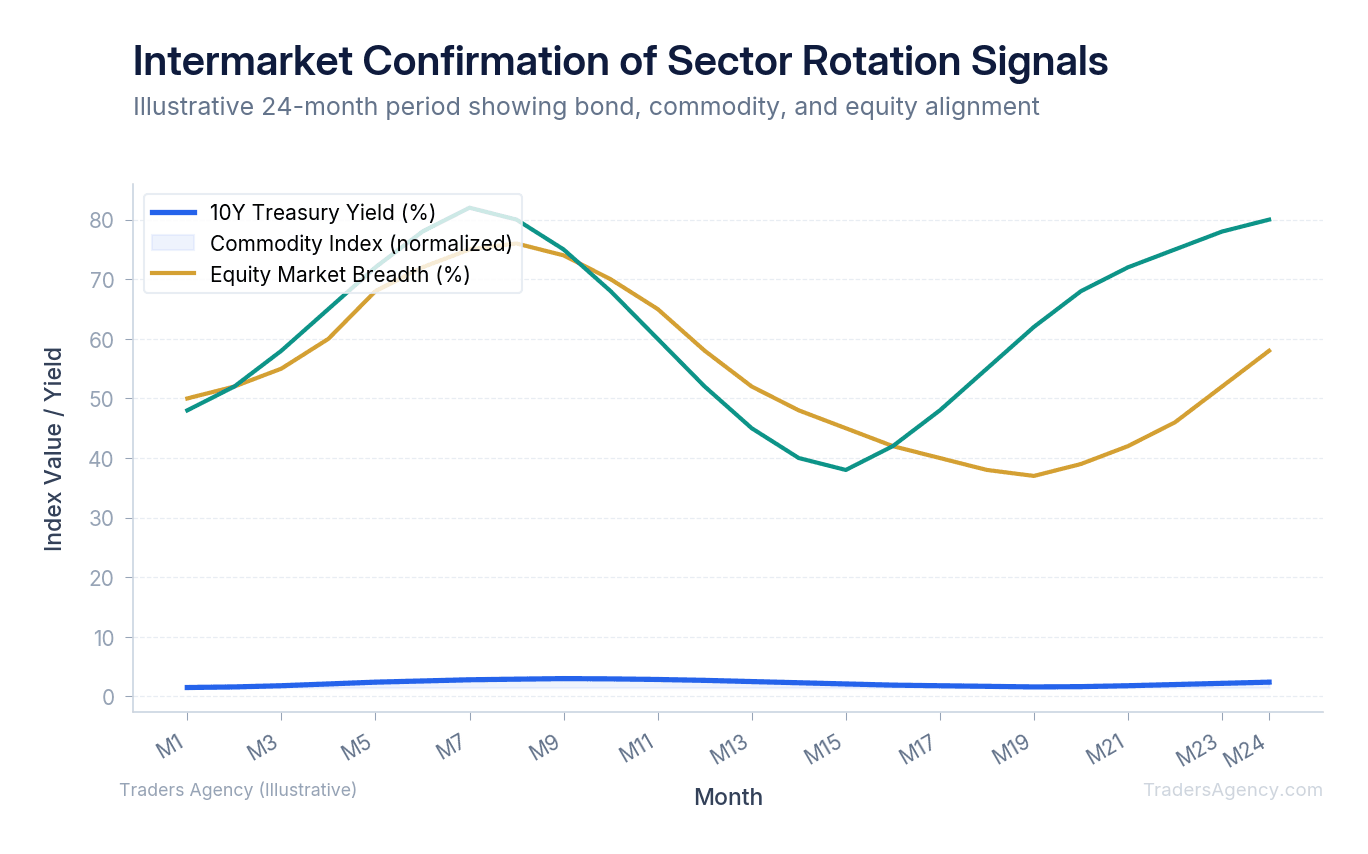
You cannot rely on stock charts alone to confirm an economic shift. Our team recommends using intermarket analysis to validate your sector rotation strategy. This means analyzing the relationship between bonds, stocks, and commodities to ensure they are all telling the same story.
The bond market usually leads the stock market, and the stock market usually leads the commodity market. For example, if we see 10-year Treasury yields dropping rapidly from 4.5% to 3.8%, bond prices are rising. This typically signals an upcoming economic contraction. If this bond market signal aligns with a sudden breakout in utility stocks, you have a high-probability confirmation that a rotation into defensive sectors is underway.
We always check commodity prices like copper and oil as well. Falling copper prices combined with rising bond prices provide strong evidence that industrial sectors will soon underperform. If you see industrial stocks rallying while copper falls, that is a divergence. We avoid trading sector breakouts when intermarket signals do not confirm the move.
Key Concept: Intermarket confirmation means bonds, stocks, and commodities are all pointing in the same direction. When these three asset classes align, your sector rotation trade has a much higher probability of success. When they diverge, stay cautious.
Want expert trading insights delivered daily?
Join thousands of traders who rely on Traders Agency for market analysis and trade ideas.
Join Traders AgencyHow Do You Track Sector Rotation Using Relative Strength Charts?
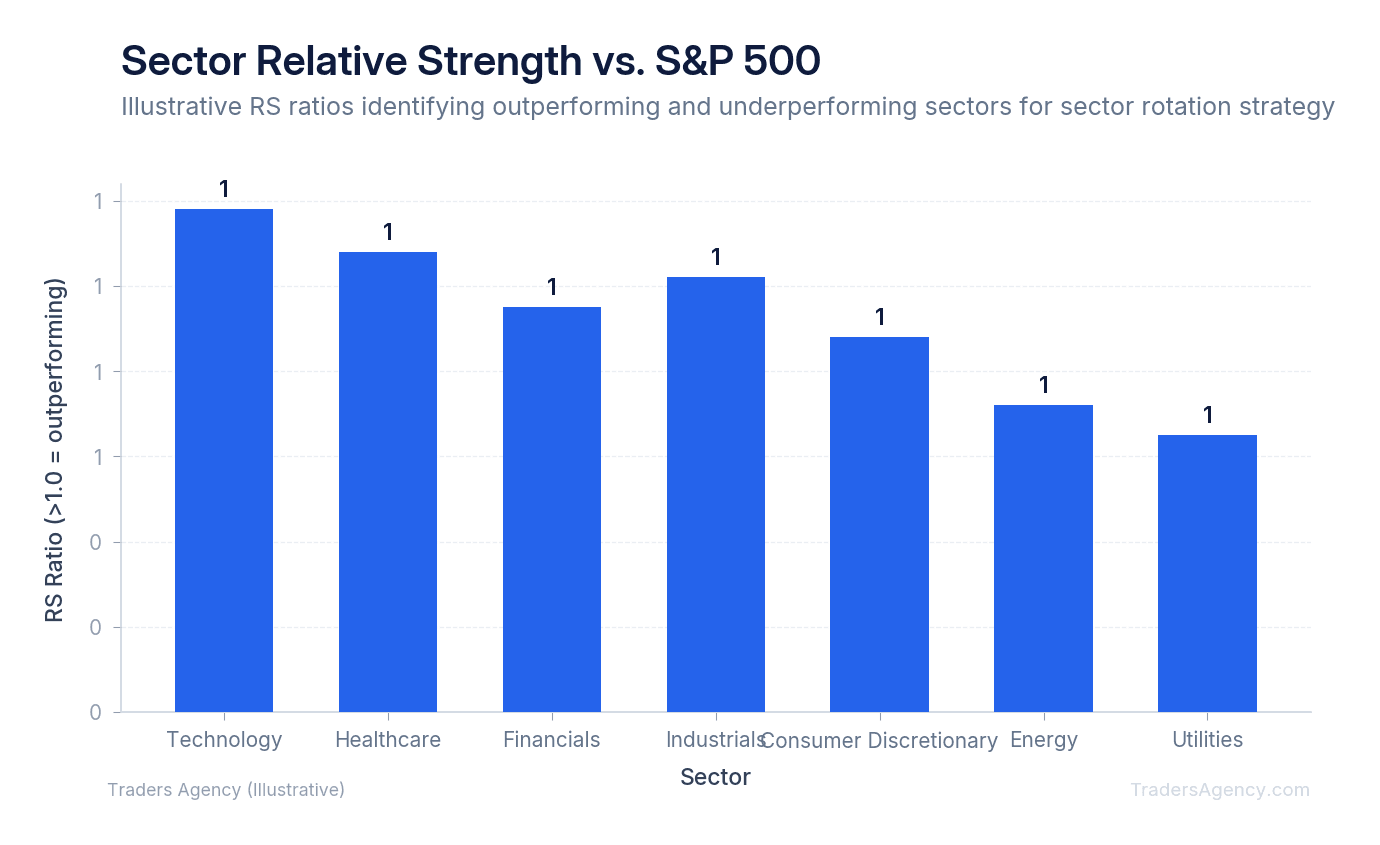
Identifying the rotation requires the right charting techniques. We rely heavily on relative strength analysis. This is different from the RSI indicator. Relative strength compares the price action of a specific sector directly against a benchmark index like the S&P 500.
Setting up a sector rotation layout on TradingView is straightforward. Here is exactly how we configure our charts to spot institutional buying:
- Open your charting platform and select a daily timeframe.
- Select a sector ETF, such as the Technology Select Sector SPDR Fund (XLK).
- Create the ratio chart by dividing the sector ETF price by the S&P 500 ETF price (type "XLK/SPY" into the ticker box).
- Apply a 50-day moving average to this new ratio line.
If the XLK/SPY ratio line is rising and crosses above its 50-day moving average, technology stocks are outperforming the broader market. This acts as your personal sector rotation tracker. We look for sectors where this ratio is breaking out of a long consolidation period. If you see the Financials sector ratio breaking out while the Technology sector ratio breaks down, you have a clear visual signal to adjust your positions.
Is There a Sector Rotation ETF?
Yes, there are several sector rotation ETFs available to traders who prefer an automated approach. These exchange-traded funds actively shift their holdings between different market sectors based on proprietary momentum indicators or macroeconomic models, allowing investors to gain exposure to sector rotation without manually managing individual trades.
Using a sector rotation strategy ETF can simplify your portfolio management. Funds like the SPDR SSGA US Sector Rotation ETF (XLSR) handle the rebalancing for you. Some traders also look at offerings from major brokers, researching sector rotation strategies through proprietary fund lineups to keep their accounts consolidated.
However, our team prefers a manual approach. When you buy a pre-packaged ETF, you lose control over your entry and exit timing. You also pay higher expense ratios for the active management. We recommend using these ETFs as research tools. You can look at their daily holdings to see where institutional money is flowing, then execute your own targeted trades using standard, low-cost sector ETFs. Understanding the underlying assets and management fees of any ETF is an essential step before investing your capital. The SEC's investor education resources provide a solid foundation for evaluating fund structures.
When Does a Sector Rotation Strategy Fail?
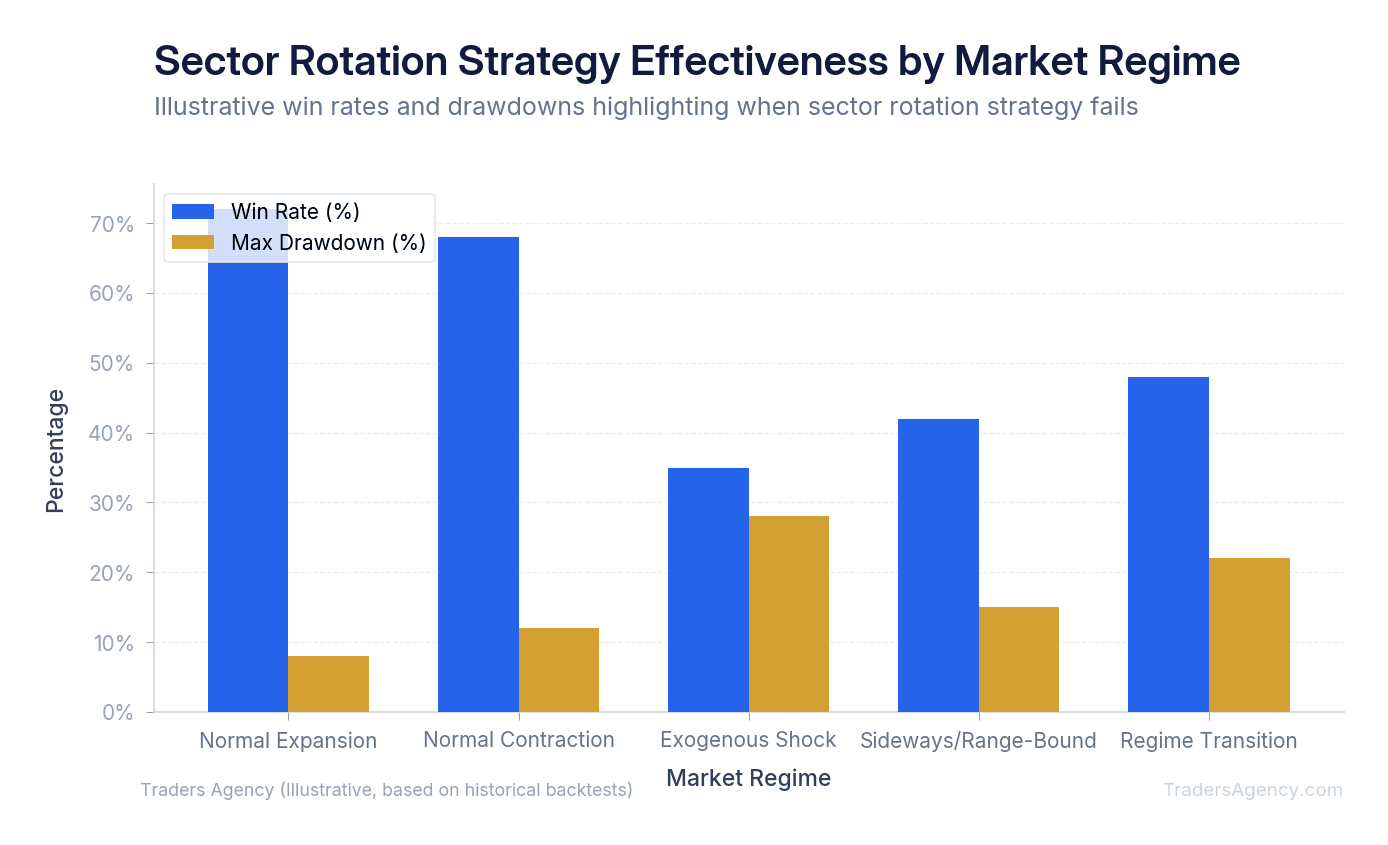
A sector rotation strategy typically fails during sudden exogenous shocks or prolonged sideways markets. When unexpected global events cause panic selling, correlations between all sectors go to one, meaning everything drops simultaneously. In these scenarios, historical business cycle models temporarily break down and rotation signals become highly unreliable.
Market cycles are not always perfectly sequential. Sometimes the economy skips a phase or gets stuck in a prolonged transition. A common mistake we see is traders blindly following the business cycle model without waiting for price confirmation. Just because the economy is entering a recession does not mean you should instantly buy utility stocks. You must wait for the relative strength charts to confirm the money is actually moving there.
Watch Out: Another failure point occurs during massive liquidity injections by central banks. When the Federal Reserve floods the market with capital, speculative sectors can continue to rally long after the economic data suggests they should fall. Always prioritize price action over economic theory. If the business cycle says technology should fall, but the XLK/SPY relative strength chart is hitting new highs, trust the chart.
How Should You Structure a Portfolio Around Sector Rotation?
Applying this strategy requires strict risk management. We teach our members to never allocate their entire portfolio to a single sector, no matter how strong the rotation signal appears. A practical approach is a core-and-satellite portfolio structure.
Keep 60% to 70% of your capital in broad market index funds. Use the remaining 30% to 40% to trade sector rotation signals. If your analysis shows energy and materials are leading, allocate your satellite capital to those two sectors in equal parts. This ensures you maintain general market exposure while seeking outperformance in the strongest industries.
Always use hard stop losses or defined-risk options strategies. If you want to rotate into the Energy Select Sector SPDR Fund (XLE) when it is trading at $85, you have two safe ways to execute the trade:
Option 1: Stock Purchase
| Parameter | Value |
|---|---|
| Entry Price | $85 |
| Stop Loss | $79 (below recent swing low) |
| Risk Per Share | $6 |
| Exit Trigger | Rotation fails or broader market drags sector down |
Option 2: Bull Call Spread
| Parameter | Value |
|---|---|
| Buy | 60-day $85 call |
| Sell | 60-day $90 call |
| Net Premium Paid | $2.00 ($200 per contract) |
| Maximum Loss | $200 (premium paid) |
| Maximum Gain | $300 (if XLE closes at or above $90 at expiration) |
| Breakeven | $87 |
We prefer to risk no more than 1% to 2% of our total account equity on any single sector trade. Sector rotation is about catching medium-term trends that last three to nine months. By keeping your position sizes reasonable and waiting for intermarket confirmation, you can trade these cycles with confidence.
Risk Warning: Never allocate your entire portfolio to a single sector rotation trade. Even the strongest signals can fail during exogenous shocks. Use a core-and-satellite structure, hard stop losses, and defined-risk options strategies to protect your capital.
Our education team publishes new strategy guides and market analysis every week. Sector rotation is one of the most powerful frameworks available to active traders, and when you combine it with intermarket confirmation and proper risk management, you have a repeatable process for staying on the right side of institutional money flows.
Want expert trading insights delivered daily?
Join thousands of traders who rely on Traders Agency for market analysis and trade ideas.
Join Traders AgencyKey Takeaways
- Institutional investors rarely move entirely to cash during slowdowns. Instead, they rotate capital between sectors, such as selling technology stocks and buying defensive consumer staples when growth is expected to slow.
- Sector rotation follows a predictable sequence tied to the business cycle, which means traders who track economic phases can anticipate capital flows rather than react to them after the move has already happened.
- Intermarket analysis, including signals from bond yields, commodities, and currency markets, can be used to confirm sector rotation signals before committing to a trade.
- Relative strength charts are a practical tool for identifying which sectors are leading and which are lagging, giving traders an objective way to track where institutional money is moving.
- A core-and-satellite portfolio structure, combined with hard stop losses and defined-risk options strategies, is recommended to manage the risk that even strong sector rotation signals can fail during unexpected market shocks.
DISCLAIMER: Traders Agency does not offer financial advice. The information provided is for educational purposes only and should not be considered financial advice. Traders Agency is not responsible for any financial losses or consequences resulting from the use of the information provided. Trading carries inherent risks and may not be suitable for all individuals. You are advised to conduct your own research and seek personalized advice before making any investment decisions, recognizing the potential risks and rewards involved.
See more from Traders Agency on Google
Make us a preferred source and our market analysis will appear more prominently in your Google Search, Top Stories, and AI results.
Add to Preferred Sources



