
You've probably seen this cycle play out before. Bitcoin rallies hard, stalls at a major resistance level, and suddenly smaller cryptocurrencies explode in value over a few weeks. Many traders watch from the sidelines, wondering how others knew exactly when to buy those smaller assets. The secret isn't luck. Professional traders track the flow of capital using specific dominance metrics, and we're going to show you exactly how it works.
Bitcoin dominance is a metric that measures Bitcoin's market capitalization as a percentage of the total cryptocurrency market cap. When traders analyze BTC dominance vs altcoins, they're looking for capital rotation patterns to time their market entries. This ratio acts as a macro indicator for the entire digital asset space.
We'll walk you through exactly how to track this capital flow. By the end of this guide, you'll know how to read dominance charts, identify rotation triggers, and execute a structured altcoin strategy. Our team relies on these exact principles to manage risk across the crypto ecosystem.
What Is Bitcoin Dominance and Why Does It Matter?
Bottom Line: Bitcoin dominance gives traders a measurable way to track capital rotation between Bitcoin and altcoins, which can help time exposure to higher-risk assets during potential altcoin seasons. The core discipline is reading the weekly dominance chart at key technical levels and managing risk on every rotation, rather than chasing moves after they have already happened.
Bitcoin dominance matters because it reveals where institutional and retail capital is flowing within the crypto market. When this metric rises, capital is concentrating in Bitcoin. When it falls, capital is rotating into smaller, higher-risk cryptocurrencies, often triggering an altcoin season where these smaller assets outperform Bitcoin.
To calculate this metric, data aggregators divide Bitcoin's market cap by the total global cryptocurrency market cap. If the total crypto market is worth $2 trillion and Bitcoin makes up $1 trillion of that, Bitcoin dominance sits at 50%. This percentage fluctuates daily based on buying and selling pressure.
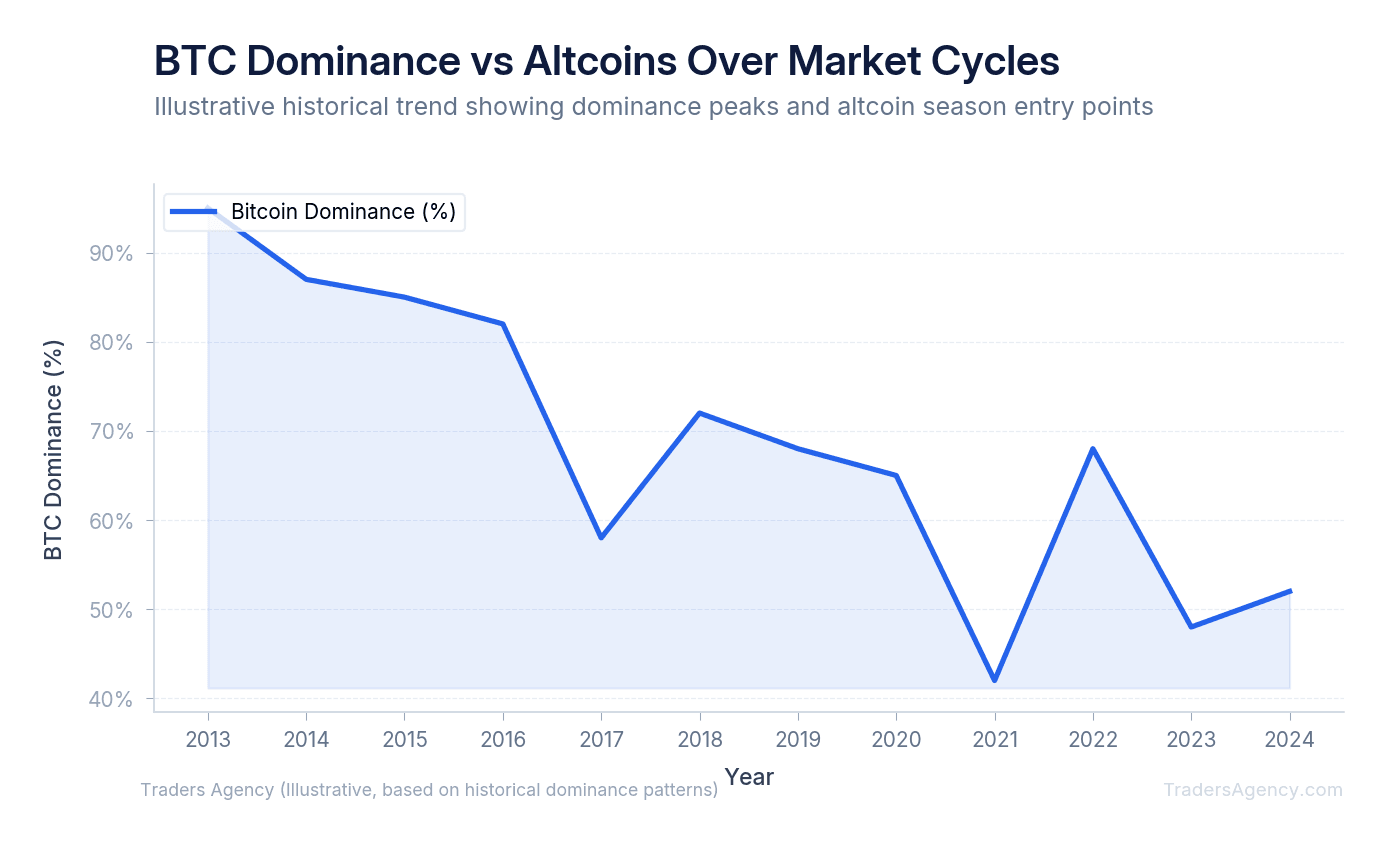
Key Concept: A rising dominance chart indicates a "risk-off" environment within crypto, where traders seek the relative safety of Bitcoin. A falling dominance chart signals a "risk-on" environment, where traders chase higher percentage returns in smaller, more volatile assets.
We teach our members to view this metric as a risk gauge. If you're searching for bitcoin dominance altcoin today, you're essentially asking whether the current market favors safety or speculation. That single question can shape your entire portfolio allocation.
What Happens When BTC Dominance Goes Down?
When Bitcoin dominance goes down, it means altcoins are growing in market capitalization faster than Bitcoin. This typically happens when traders take profits from Bitcoin and move that capital into Ethereum, large-cap altcoins, and eventually micro-caps, creating a speculative cycle known as an altcoin season.
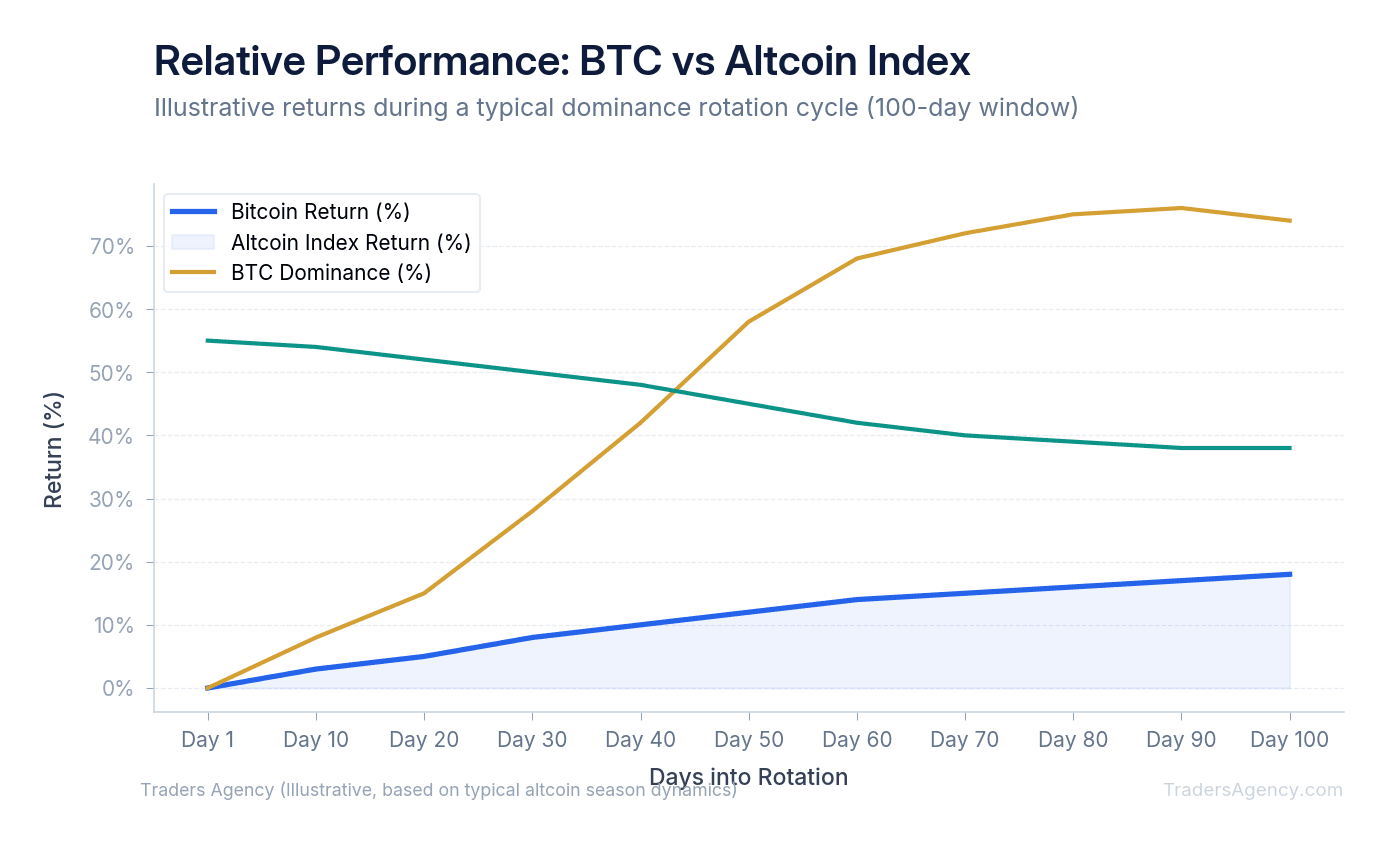
This capital rotation is driven by the wealth effect. When Bitcoin experiences a massive run, early investors sit on significant unrealized gains. Instead of cashing out to fiat currency, many prefer to keep their capital within the crypto ecosystem. They look for assets that haven't moved yet.
This creates a cascading effect down the market cap ladder. A 10% move in Bitcoin requires hundreds of billions of dollars. That same amount of capital flowing into a smaller altcoin can cause its price to double or triple in days. Tracking an altcoin season index can help you visualize this shift in momentum.
How Do You Read the BTC Dominance Chart as a Rotation Signal?
Trading BTC dominance vs altcoins requires a systematic approach to technical analysis. You cannot rely on gut feelings or social media hype. We prefer to use standard charting platforms like TradingView to analyze the dominance ticker (BTC.D) just like any other asset.
Here is the exact process our team uses to identify rotation signals:
Step 1: Set the Correct Timeframe
Dominance shifts are macro trends. They do not happen overnight. We always start our analysis on the weekly timeframe to filter out daily noise.
A daily chart might show a sharp drop in dominance, tricking you into buying altcoins early. The weekly chart provides the true trend direction. We look for a series of lower highs and lower lows on the weekly BTC.D chart to confirm a sustained rotation.
Step 2: Identify Key Support Breakdowns
We treat the dominance chart like a standard price chart. We draw horizontal support and resistance levels. When analyzing a bitcoin dominance altcoin chart, the most actionable signals occur when dominance breaks below a major multi-month support level.
For example, if BTC dominance ranges between 48% and 52% for six months, a weekly candle closing below 48% is a massive technical trigger. This breakdown tells us that capital is aggressively leaving Bitcoin for altcoins. We pair this with the Relative Strength Index (RSI) on the weekly chart. A drop below 50 on the RSI confirms the bearish momentum in Bitcoin dominance.
Step 3: Confirm with Altcoin/BTC Trading Pairs
Looking at fiat pairs (like ETH/USD) is not enough. To confirm a true rotation, we evaluate altcoin performance against Bitcoin directly. We pull up charts for major pairs like ETH/BTC or SOL/BTC.
If Bitcoin dominance is falling, but ETH/BTC is flat, the signal is weak. We want to see ETH/BTC breaking out of resistance simultaneously. This proves that altcoins are actually gaining ground against Bitcoin, not just floating higher on general market momentum.
Key Concept: A confirmed rotation signal requires three elements: weekly BTC.D breaking below support, RSI below 50 on the dominance chart, and altcoin/BTC pairs breaking out of resistance. All three must align before we commit capital.
Want expert trading insights delivered daily?
Join thousands of traders who rely on Traders Agency for market analysis and trade ideas.
Join Traders AgencyWhat Should BTC Dominance Be for Alt Season?
For a true altcoin season to begin, historical data suggests BTC dominance should drop below the 50% threshold and ideally approach the 40% level. When dominance breaks below these key support zones on a weekly chart, it confirms a massive capital rotation into the broader cryptocurrency market.
Historically, the 40% zone has acted as a significant support area for Bitcoin dominance. During the peak of the 2017-2018 and 2021 bull markets, dominance bottomed out in the range of approximately 33% to 40%. When reviewing an altcoin dominance chart, you'll notice that altcoins experience their most aggressive vertical rallies during the final drop from 45% to 40%.
| Dominance Level | Market Condition | Typical Action |
|---|---|---|
| 60%+ | Strong Bitcoin dominance, risk-off | Hold BTC, avoid altcoins |
| 50-60% | Transitional zone | Begin watching for rotation signals |
| 45-50% | Early altcoin season | Scale into large-cap altcoins |
| 40-45% | Full altcoin season | Rotate into mid-caps, tighten stops |
| Below 40% | Peak speculation, reversal likely | Take profits, prepare to rotate back to BTC |
Once dominance hits that 40% area, the trend often reverses. Capital flows back into Bitcoin as altcoin traders take profits. Knowing these historical boundaries helps you plan your exit strategy before the rotation ends.
The Crypto Risk Spectrum: Rotating from BTC to Altcoins
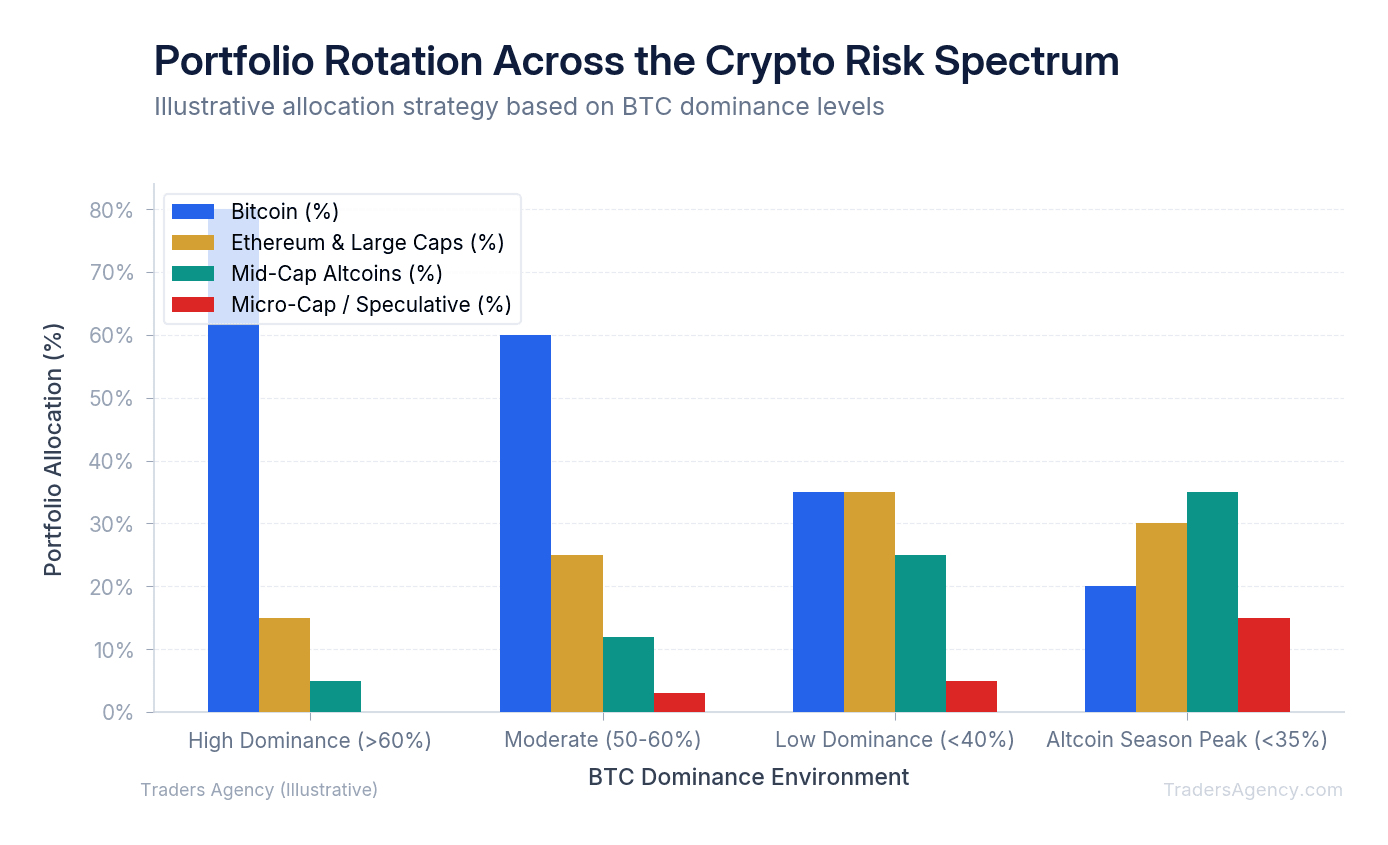
Understanding the mechanics of dominance is only half the battle. You must know how to apply this data to your actual portfolio. We teach our members to view the crypto market as a structured risk spectrum.
Capital does not flow randomly. It follows a predictable, stepped path down the liquidity ladder. Here are the four distinct phases of capital rotation you should track:
- Phase 1: Bitcoin absorbs the initial capital. Institutional money and traditional equity investors enter here first. Bitcoin dominance rises sharply. Altcoins bleed against BTC.
- Phase 2: Ethereum catches up. Bitcoin consolidates. Capital flows into Ethereum. The ETH/BTC ratio breaks out.
- Phase 3: Large-cap altcoins rally. Money flows from ETH into top-20 cryptocurrencies (like Solana, Cardano, or Chainlink).
- Phase 4: Mid-cap and micro-cap altcoins explode. This is full altcoin season. Bitcoin dominance drops toward 40%. Speculation is at its highest.
Portfolio Context and Traditional Markets
Crypto does not exist in a vacuum. We always evaluate how this asset class fits into a broader portfolio. Bitcoin often shows a strong correlation with traditional equity markets, specifically the Nasdaq 100.
When traditional equities are in a strong uptrend, institutional risk appetite increases. This macro environment supports the initial Bitcoin rally. If traditional markets are crashing, an altcoin season is highly unlikely, regardless of what the dominance chart says. You must align your crypto rotation strategy with the broader macroeconomic trend. For context on how traditional market conditions affect risk assets, the Federal Reserve's monetary policy decisions play a significant role in overall liquidity conditions.
What Are the Most Common Mistakes When Trading BTC Dominance Signals?
Trading BTC dominance vs altcoins can be highly profitable, but it carries significant risk. Many intermediate traders misread the signals and allocate capital at the wrong time. We want you to avoid the traps that wipe out inexperienced market participants.
Falling for False Breakdowns
A false breakdown occurs when dominance dips below a key support level for a few days, only to reverse sharply back to the upside. Traders who buy altcoins on the initial dip get trapped. As dominance surges back up, altcoins lose value rapidly against Bitcoin.
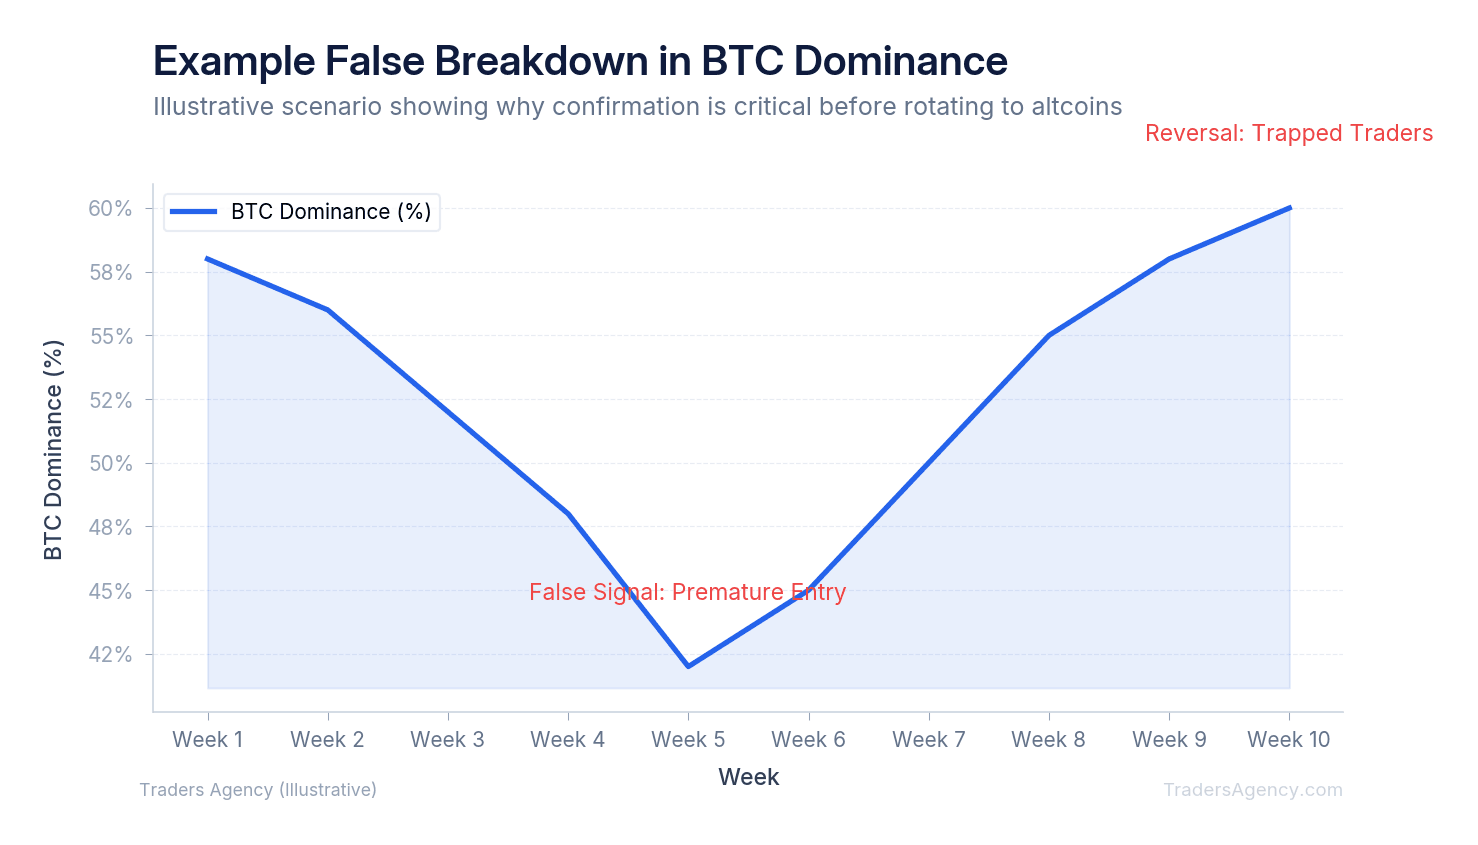
To avoid this, never trade based on a daily candle close. Wait for the weekly candle to close below support. This requires patience, but it filters out the majority of false signals.
Premature Altcoin Entries
Many traders buy micro-cap altcoins the moment Bitcoin starts moving. This is a critical error. During Phase 1 of a bull market, Bitcoin dominance is rising. If you hold altcoins during this phase, you suffer an opportunity cost. Your altcoins will likely lose value against BTC, even if their fiat price stays flat.
We prefer to hold Bitcoin until the weekly dominance chart shows a confirmed lower high and lower low. Only then do we begin scaling into large-cap altcoins.
Watch Out: Altcoin volatility can destroy a portfolio in days. When you rotate capital based on dominance signals, you must implement strict risk management parameters. Never allocate more than 10% of your total crypto portfolio to a single mid-cap or micro-cap altcoin.
Risk Management Rules We Follow
- Position Sizing: Never allocate more than 10% of your total crypto portfolio to a single mid-cap or micro-cap altcoin. Keep a core position in Bitcoin to anchor your portfolio volatility.
- Stop Losses: Always set stop losses on your altcoin positions. We recommend placing stops below the most recent weekly swing low on the Altcoin/BTC trading pair.
- Maximum Allocation: Even in the deepest altcoin season, we rarely recommend dropping your Bitcoin allocation to zero. Maintaining at least a 20% to 30% BTC position protects you if the dominance trend suddenly reverses.
By treating the dominance chart as a strict technical indicator rather than a guessing game, you can time your market exposure with precision. Wait for the weekly signals, respect the historical support levels, and manage your risk on every rotation.
Our education team publishes new strategy guides and market analysis every week. These dominance-based rotation strategies are just one piece of the framework we use to help traders manage risk across the entire crypto ecosystem.
Want expert trading insights delivered daily?
Join thousands of traders who rely on Traders Agency for market analysis and trade ideas.
Join Traders AgencyKey Takeaways
- Bitcoin dominance measures Bitcoin's market cap as a percentage of the total crypto market cap, making it a macro-level indicator for tracking where capital is flowing across the entire digital asset space.
- When BTC dominance rises, capital is concentrating in Bitcoin. When it falls, capital is rotating into smaller, higher-risk altcoins, which is the condition that historically precedes an altcoin season.
- Professional traders treat the dominance chart as a strict technical indicator, watching for weekly signal confirmations and historical support/resistance levels rather than reacting to short-term noise.
- Timing entries around dominance rotation patterns is a risk management discipline, not a prediction tool. Every rotation trade still requires defined risk parameters.
- Dominance-based rotation is one component of a broader framework. It works alongside other market structure analysis, not as a standalone entry trigger.
DISCLAIMER: Traders Agency does not offer financial advice. The information provided is for educational purposes only and should not be considered financial advice. Traders Agency is not responsible for any financial losses or consequences resulting from the use of the information provided. Trading carries inherent risks and may not be suitable for all individuals. You are advised to conduct your own research and seek personalized advice before making any investment decisions, recognizing the potential risks and rewards involved.
See more from Traders Agency on Google
Make us a preferred source and our market analysis will appear more prominently in your Google Search, Top Stories, and AI results.
Add to Preferred Sources



