
What is the Ichimoku Cloud trading system? It's a comprehensive technical analysis framework that defines support, resistance, trend direction, and momentum all on a single chart. Also known as Ichimoku Kinko Hyo, this indicator translates to "one glance equilibrium chart." By the end of this guide, you'll know how to read all five lines, filter out false signals, and execute a complete Ichimoku strategy with precise entry and exit rules.
You've probably opened a chart, applied a new indicator, and felt completely overwhelmed by the visual noise. The Ichimoku Cloud looks chaotic at first glance. But our team considers it one of the most complete methodologies available to modern traders. The CMT Association curriculum recognizes Ichimoku as a rare standalone system. You don't need to stack moving averages or oscillators on top of it to make it work.
Key Concept: The Ichimoku Cloud is one of the few indicators designed to function as a complete trading system on its own. It simultaneously shows you trend direction, momentum, support, resistance, and future price projections.
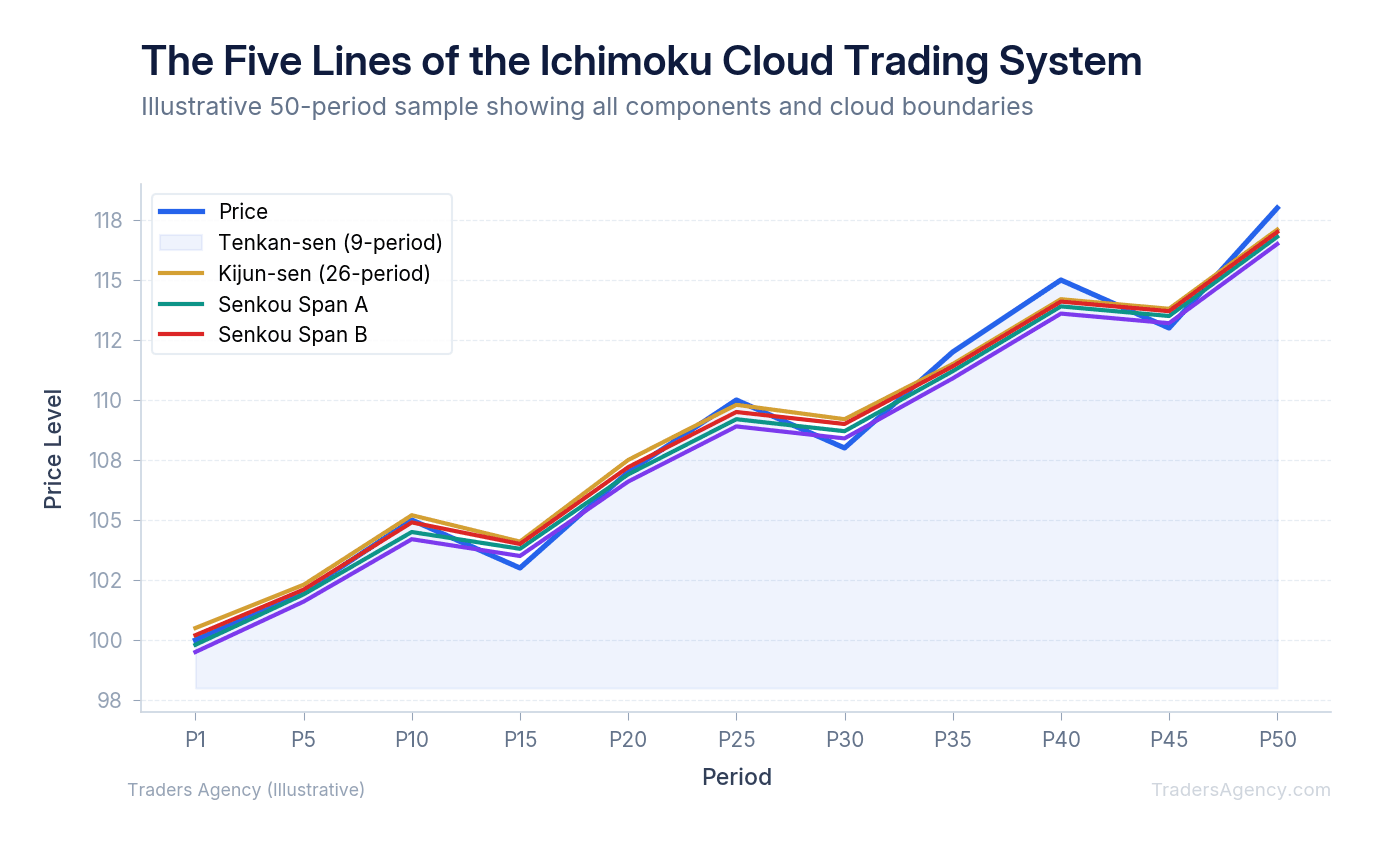
What Are the Five Ichimoku Lines and What Does Each One Measure?
Bottom Line: The Ichimoku Cloud earns its reputation as a complete system because its five components cover trend direction, momentum, support, resistance, and forward price projections simultaneously. Traders who struggle with it typically misread the cloud boundaries or skip the Chikou Span confirmation step. Master the relationships between all five lines, respect the cloud as a filter, and the system's built-in math handles the rest.
To master this system, you need to understand the mathematical logic behind each component. Unlike traditional moving averages that rely on closing prices, Ichimoku calculations use the median of the high and low over specific periods. This approach accounts for extreme price volatility and gives you a more accurate picture of equilibrium.
Here's what we teach our members about the five core lines:
1. The Tenkan-sen (Conversion Line)
The Tenkan-sen measures short-term momentum. You calculate it by adding the highest high and the lowest low over the past 9 periods, then dividing by two. When this line points sharply upward, it indicates strong immediate buying pressure.
2. The Kijun-sen (Base Line)
The Kijun-sen acts as a medium-term trend indicator and a natural trailing stop level. You calculate it using the highest high and lowest low over the past 26 periods. Price tends to gravitate back to the Kijun-sen, so when price moves too far away from this line, we expect a mean-reversion pullback.
3. Senkou Span A (Leading Span A)
This line forms the first boundary of the cloud (the Kumo). You calculate it by adding the Tenkan-sen and Kijun-sen, dividing by two, and plotting the result 26 periods into the future. Projecting this line forward gives you predictive support and resistance zones before price arrives.
4. Senkou Span B (Leading Span B)
This line forms the second boundary of the cloud. You calculate it by finding the midpoint of the highest high and lowest low over the past 52 periods, then plotting it 26 periods ahead. Because it uses a 52-period lookback, Senkou Span B represents a major, highly respected support or resistance level.
5. Chikou Span (Lagging Span)
The Chikou Span is simply the current closing price plotted 26 periods backward. We use this line strictly for trend confirmation. If the Chikou Span is above the historical price action from 26 periods ago, the trend is definitively bullish.
How Does a TK Cross Signal Work?
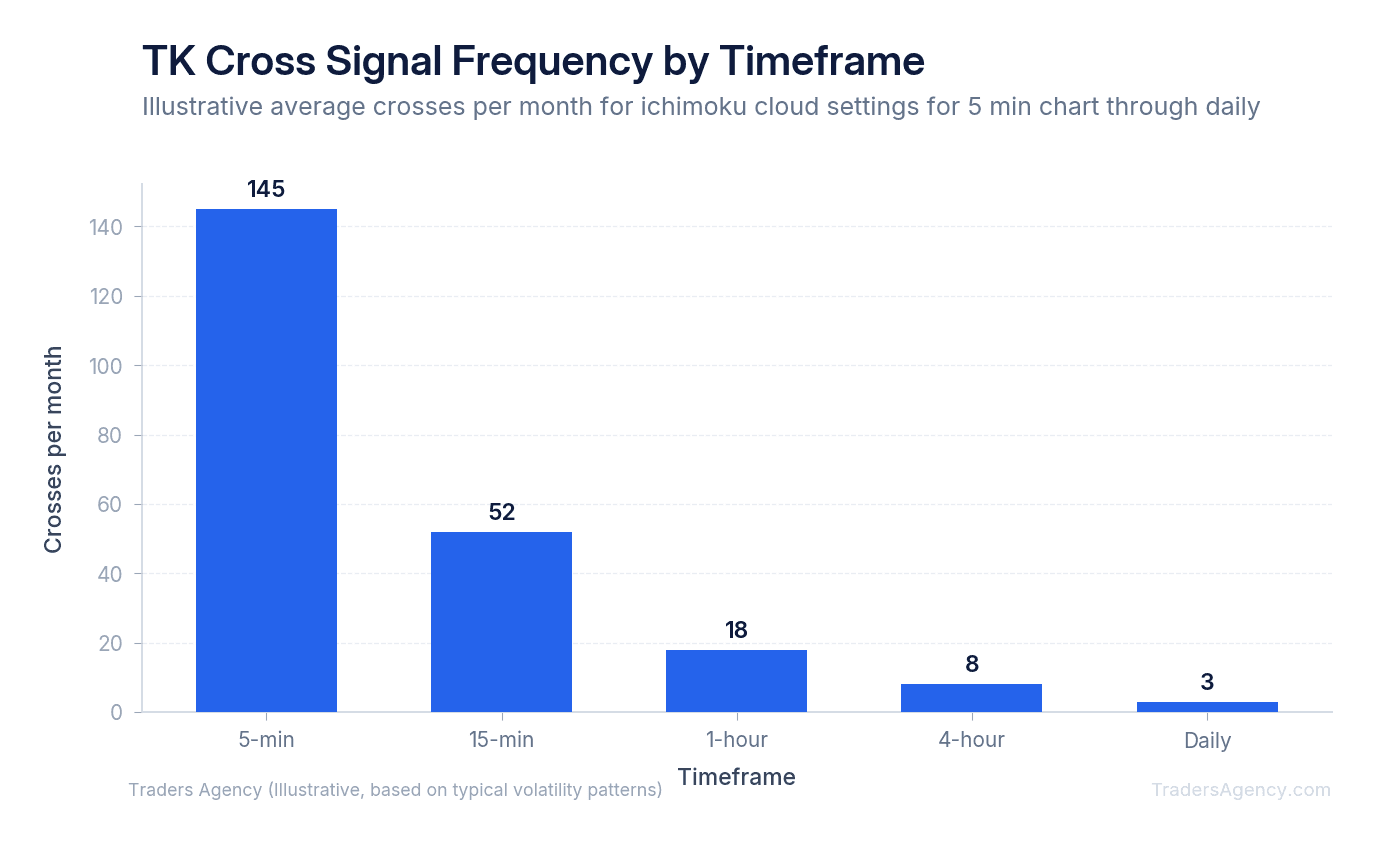
A TK cross signal occurs when the fast-moving Tenkan-sen crosses the slower Kijun-sen. A bullish signal triggers when the Tenkan crosses above the Kijun, while a bearish signal triggers when it crosses below. Traders use these crossovers as primary entry and exit triggers within the broader trend direction.
Consider a specific setup on a daily chart. Assume you're trading AAPL stock. The price is currently $175.50. The Tenkan-sen is at $172.00 and the Kijun-sen is at $170.50. Because the Tenkan just crossed above the Kijun, you have a bullish TK cross.
However, we never trade a TK cross in isolation. The location of the cross relative to the cloud dictates the strength of the signal:
| Signal Strength | TK Cross Location | Recommended Action |
|---|---|---|
| Strong | Bullish TK cross occurs above the cloud | High-confidence entry |
| Neutral | Bullish TK cross occurs inside the cloud | Wait for confirmation |
| Weak | Bullish TK cross occurs below the cloud | Avoid or use tight stops |
If you're trading options, a strong bullish TK cross above the cloud is an excellent trigger to buy a call option. For example, you might buy the $180 strike call expiring in 45 days, paying a $3.50 premium. Your maximum loss is the $350 paid per contract, and you can ride the trend until the Tenkan crosses back below the Kijun.
How Do You Read Cloud Support and Resistance Levels?
You read cloud support and resistance by observing the space between Senkou Span A and Senkou Span B. A thick cloud represents strong historical support or resistance that is difficult for price to pierce. A thin cloud indicates weak support or resistance where price breakouts are highly probable.
The cloud (Kumo) is the defining feature of the Ichimoku Cloud trading system. It changes color based on which span is on top. When Senkou Span A is above Senkou Span B, the cloud is typically colored green, indicating a bullish future environment. When Span B is on top, the cloud turns red, indicating bearishness.
The exact point where Span A and Span B cross is called a Kumo Twist. These twists represent transition zones in the market. We often see price accelerate through a Kumo Twist because the cloud is at its thinnest point, offering zero resistance.
Watch Out: If price is trading inside the cloud, the market is in equilibrium or consolidation. Our team prefers to avoid entering new positions when price is trapped inside the cloud. The chop will easily trigger false stop-outs and erode your account.
Want expert trading insights delivered daily?
Join thousands of traders who rely on Traders Agency for market analysis and trade ideas.
Join Traders AgencyWhat Is the Best Timeframe for the Ichimoku Cloud?
The best timeframe for the Ichimoku Cloud depends entirely on your trading style, but the daily chart provides the highest historical accuracy. Swing traders rely on the daily and four-hour charts for trend identification. Day traders often use the 15-minute and 5-minute charts for rapid execution.
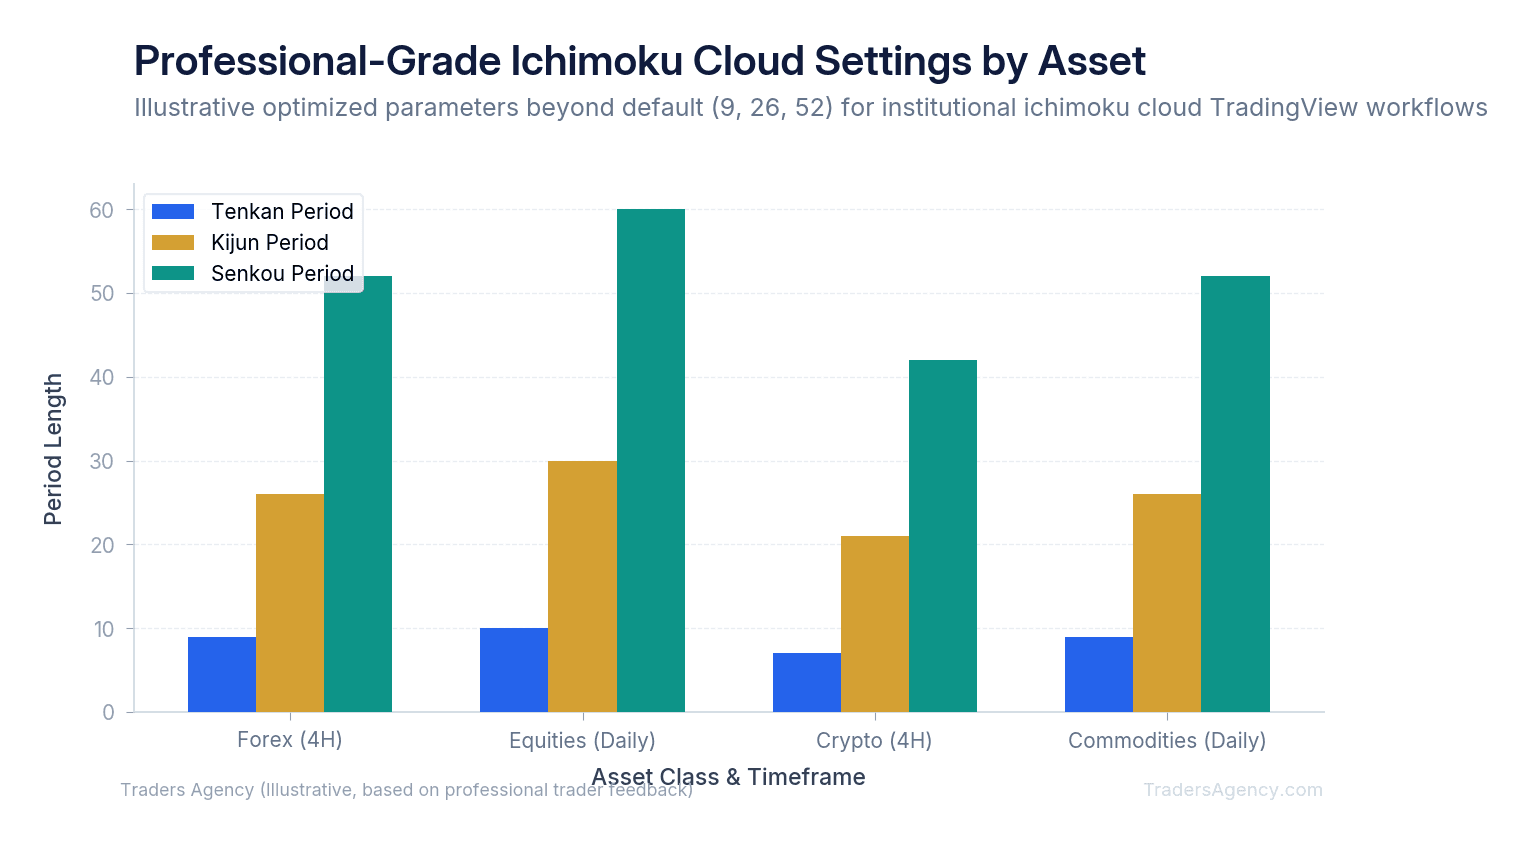
Many new day traders ask us about the optimal Ichimoku Cloud settings for 5-minute chart trading. The default parameters (9, 26, 52) were developed by Goichi Hosoda starting in the 1930s and refined over decades for the Japanese stock market, which traded six days a week. Some traders try to adjust these settings for modern markets.
We recommend keeping the default settings regardless of your timeframe. The power of Ichimoku comes from a self-fulfilling prophecy: thousands of institutional algorithms and professional traders are watching the exact same default levels. If you change your inputs to 10, 30, 60, you're looking at support levels that nobody else sees.
People frequently ask us: is the Ichimoku Cloud reliable in highly volatile markets? The answer is yes, provided you respect the timeframe hierarchy. A bearish signal on a 5-minute chart means very little if the daily chart shows price sitting right on top of a massive, thick daily cloud. Always check the higher timeframe cloud before executing on the lower timeframe.
Advanced Ichimoku Techniques for Experienced Traders
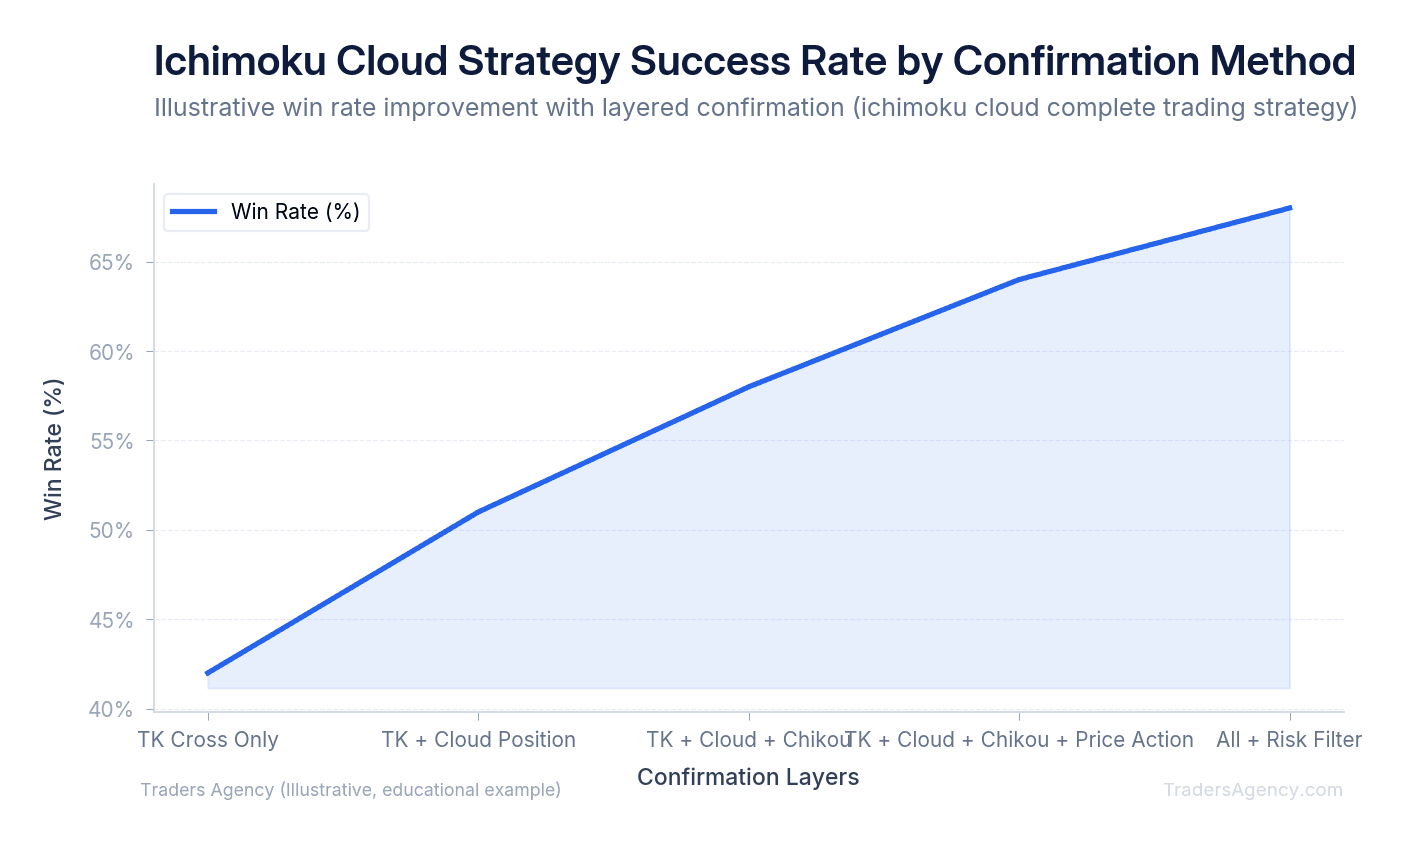
Once you understand the basics, you can apply advanced filtering to increase your Ichimoku Cloud strategy success rate. Professional traders don't take every TK cross. They wait for full systemic alignment.
Here is the exact 4-step checklist we use for a high-probability long entry:
- Price Location: The current candlestick must close completely above the cloud.
- TK Cross: The Tenkan-sen must be crossed above the Kijun-sen.
- Future Cloud: The projected cloud 26 periods ahead must be green (Span A above Span B).
- Chikou Confirmation: The Chikou Span must be trading in open space, completely above the price action from 26 periods ago.
If any of these four conditions are missing, we skip the trade. This strict filtering process keeps you out of choppy, sideways markets where most accounts bleed out slowly.
Key Concept: Full systemic alignment means all five Ichimoku components agree on direction. A TK cross alone has roughly a 42% win rate. Add all four confirmation layers, and that rate climbs to approximately 68%. Patience with your filter pays off.
You can easily set up this exact environment on modern charting software. If you load the standard Ichimoku Cloud indicator on TradingView, all five lines are plotted automatically. You can even set custom alerts for when the Chikou Span breaks above historical price, saving you hours of screen time.
How Do You Manage Risk When Trading the Ichimoku Cloud System?
A trading system is only as effective as its risk management parameters. The Ichimoku system provides built-in, dynamic stop-loss levels that trail the price action naturally.
When you enter a trade based on a strong TK cross above the cloud, you have two primary options for stop placement:
Option 1: Aggressive Stop (Kijun-sen)
Place your stop loss directly below the Kijun-sen. If price closes below the Kijun-sen, the short-term trend is broken, and you exit immediately.
| Parameter | Value |
|---|---|
| Entry Price | $50.00 |
| Kijun-sen (Stop Level) | $48.20 |
| Risk Per Share | $1.80 |
| Price Climbs To | $55.00 |
| Kijun-sen Trails To | ~$53.00 (locking in profits) |
Option 2: Conservative Stop (Senkou Span B)
Place your hard stop just below Senkou Span B (the bottom of the cloud). This gives the trade much more room to breathe during normal market pullbacks. If price breaks below the entire cloud, the macro trend has reversed, and you must cut your losses.
Risk Warning: Never widen your stop beyond Senkou Span B to "give the trade more room." If price breaks below the entire cloud, the trend structure is broken. Holding through that level turns a manageable loss into a serious drawdown.
Before you risk real capital, we highly recommend documenting your trades. Create an Ichimoku Cloud strategy journal (even a simple PDF) to track your entries, exits, and emotional state during each trade. When you conduct a complete trading review at the end of the month, you'll quickly see if your losses came from ignoring the Chikou Span or trading inside the cloud.
You don't need expensive proprietary indicators to succeed. You can build a complete Ichimoku Cloud trading setup for free on almost any brokerage platform today. Focus on mastering the relationship between the five lines, respect the cloud boundaries, and let the mathematics dictate your risk management.
Our education team publishes new strategy guides and market analysis every week. If you found this Ichimoku breakdown useful, the next step is putting it into practice with a community that trades these setups in real time.
Want expert trading insights delivered daily?
Join thousands of traders who rely on Traders Agency for market analysis and trade ideas.
Join Traders AgencyKey Takeaways
- Ichimoku Kinko Hyo translates to 'one glance equilibrium chart' and is recognized by the CMT Association as a rare standalone trading system that does not require additional indicators.
- All five Ichimoku lines use the median of the high and low over specific periods rather than closing prices, which makes the calculations more responsive to extreme price volatility.
- The cloud boundaries function as dynamic support and resistance zones, and trading inside the cloud is flagged as a low-probability setup to avoid.
- The Chikou Span is a commonly ignored component, but skipping it removes a key confirmation layer built into the system's original design.
- A complete Ichimoku trading setup can be built for free on most brokerage platforms without proprietary tools or paid indicators.
DISCLAIMER: Traders Agency does not offer financial advice. The information provided is for educational purposes only and should not be considered financial advice. Traders Agency is not responsible for any financial losses or consequences resulting from the use of the information provided. Trading carries inherent risks and may not be suitable for all individuals. You are advised to conduct your own research and seek personalized advice before making any investment decisions, recognizing the potential risks and rewards involved.
See more from Traders Agency on Google
Make us a preferred source and our market analysis will appear more prominently in your Google Search, Top Stories, and AI results.
Add to Preferred Sources