
You've probably seen this happen in your own account. You take a few trades, make some money, lose some money, and end the month right back where you started. If you want to break that frustrating cycle, you need to learn how to analyze your trade history. We'll walk you through exactly how to pull this data from your broker and make sense of it. By the end of this guide, you'll know how to calculate your true performance metrics, identify your most profitable setups, and stop repeating the same expensive mistakes.
What Is Trade History and Why Should You Export It?
Bottom Line: Analyzing your trade history is not about reviewing past wins and losses for their own sake. It is about building a repeatable process that surfaces patterns, exposes costly habits, and gives you a mathematical basis for every future decision. Traders who measure everything improve; traders who skip this step stay stuck.
Trade history is a complete digital record of every buy and sell order executed in your brokerage account. It includes the date, time, ticker symbol, price, and quantity of shares or options contracts for every transaction you make. Your raw brokerage statements can be difficult to parse for actionable insights. Exporting your data allows you to calculate specific performance metrics, find hidden patterns in your behavior, and improve your future trades.
Key Concept: Think of this process like a professional sports team watching game tape. A football coach doesn't just look at the final score. The coach watches the recording to see exactly which plays worked and which players missed their assignments. When you export your data, you create your own financial game tape.
You cannot fix a problem in your trading strategy if you don't have the data to prove the problem exists. The SEC's investor education resources strongly recommend that retail investors maintain detailed records of their transactions to understand their true costs and tax liabilities. We agree completely.
Many beginners ask about the best format to use. While you can export trade history as PDF files for tax filing purposes, a PDF is useless for mathematical analysis. You need a format that allows you to sort, filter, and calculate numbers.
How Do You Export Your Trade History From Major Brokers?
You export your trade history by logging into your brokerage account, navigating to the account statements or history tab, selecting a specific date range, and choosing a spreadsheet-compatible file format. The best format to choose is a CSV file because it easily imports into any spreadsheet software.
We teach our members to pull their data at the end of every single month. Here is the exact process you should follow to get your raw data:
- Set a Date Range: Always select a custom date range that covers a full calendar month. If you're doing this for the first time, pull the last 90 days of data. This gives you a large enough sample size of trades to evaluate your actual skill level.
- Select Your Export File Type: You must export CSV (Comma Separated Values) files. A CSV file organizes your raw data into neat columns and rows. Some brokers offer an OFX format, which is primarily used for importing directly into accounting software like Quicken. Stick to CSV for your trading analysis.
- Locate the Export Button on Your Platform: Every platform places their export button in a slightly different location. See the broker-specific instructions below.
Broker-Specific Instructions
| Broker | Export Path |
|---|---|
| TD Ameritrade (Charles Schwab) | Go to My Account, click on History, set your date range, and click the download icon in the top right corner. |
| Interactive Brokers | Open Account Management, select Reports, click on Statements, and run a custom Activity Statement in CSV format. |
| Robinhood | Go to Account, select Statements and History, scroll down to your recent history, and request a spreadsheet export to your email. |
How to Analyze Trade History in Excel or a Spreadsheet
To analyze your trade history in Excel, you must import your CSV file, format the data into a readable table, and group your buy and sell orders together to calculate the net profit or loss for each completed trade.
When you first open your CSV file, it will look like a messy wall of text and numbers. Don't let this intimidate you. Excel is the most powerful tool you can use to clean it up. Here's our step-by-step process:
- Delete unnecessary columns. You only need the execution date, the ticker symbol, the transaction type (buy or sell), the quantity, and the execution price.
- Match your entries with your exits. Create a column for your entry price and a column for your exit price.
- Calculate your point gain. Subtract the entry price from the exit price.
- Calculate your dollar profit. Multiply that point gain by your position size.
- Tag each trade with a strategy label. Add a custom column labeled "Trade Setup" or "Strategy" so you can identify which specific setups actually make you money.
| Parameter | Value |
|---|---|
| Stock | AAPL |
| Entry Price | $150.00 |
| Exit Price | $155.00 |
| Shares | 100 |
| Point Gain | $5.00 |
| Gross Profit | $500.00 |
That's one completed round-trip trade. For example, you might label this trade as a "Breakout" or a "Moving Average Bounce." This tagging step is essential for figuring out which strategies consistently put money in your pocket.
What Are the Key Metrics to Track When You Analyze Trade History?
Once your spreadsheet is organized, you need to calculate your performance metrics. These numbers tell you the objective truth about your trading skills.
Win Rate
Your win rate simply divides your total number of winning trades by your total number of trades. If you took 20 trades last month and 11 of them were profitable, your win rate is 55 percent.
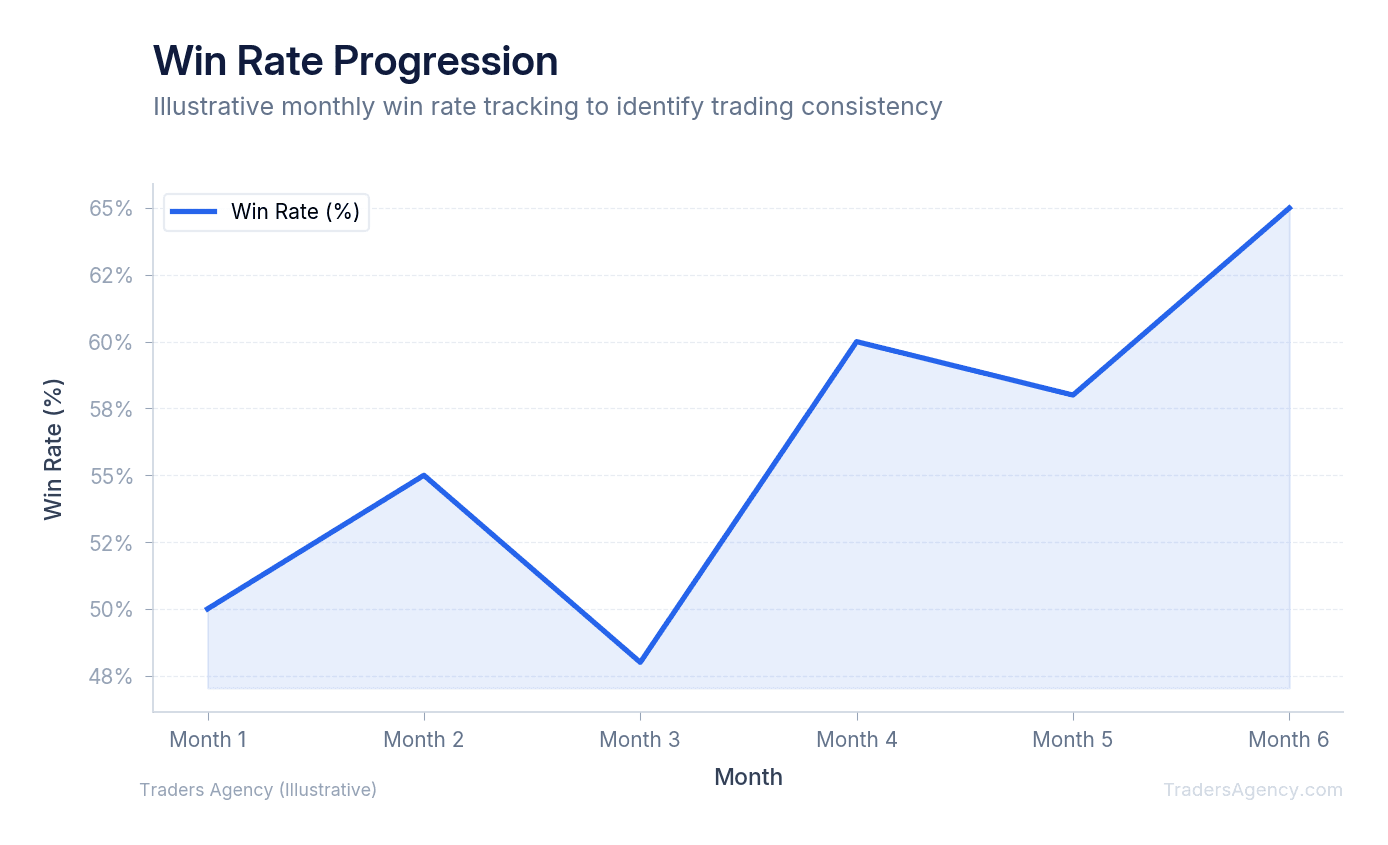
Many beginners obsess over having a high win rate. We teach our members that win rate is only half of the equation. You also need to know your Average Win and your Average Loss.
Average Win and Average Loss
To find your average win, add up all the money you made on your winning trades and divide it by the number of winning trades. Do the exact same math for your losing trades to find your average loss.
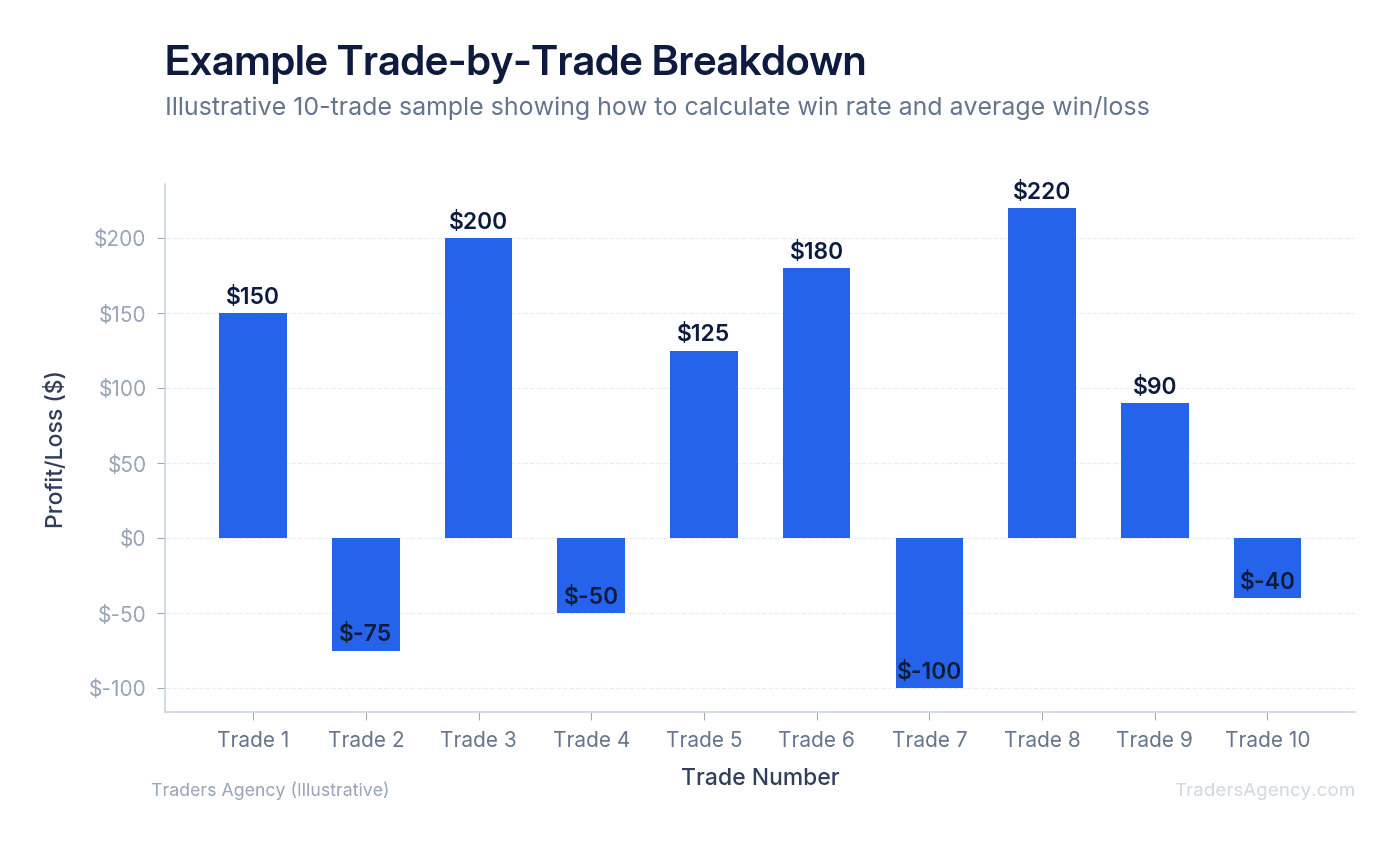
If your average win is $200 and your average loss is $100, you have a 2:1 reward-to-risk ratio. You can have a win rate of just 40 percent and still make money with those numbers.
Watch Out: A trader with a 90 percent win rate can still blow up their account. If they make $10 on nine trades, they earn $90. If they lose $500 on their tenth trade because they refused to use a stop loss, they're down $410 overall. Win rate alone tells you nothing about profitability.
Profit Factor
The ultimate metric that combines these concepts is the profit factor. This calculation divides your total gross profits by your total gross losses.
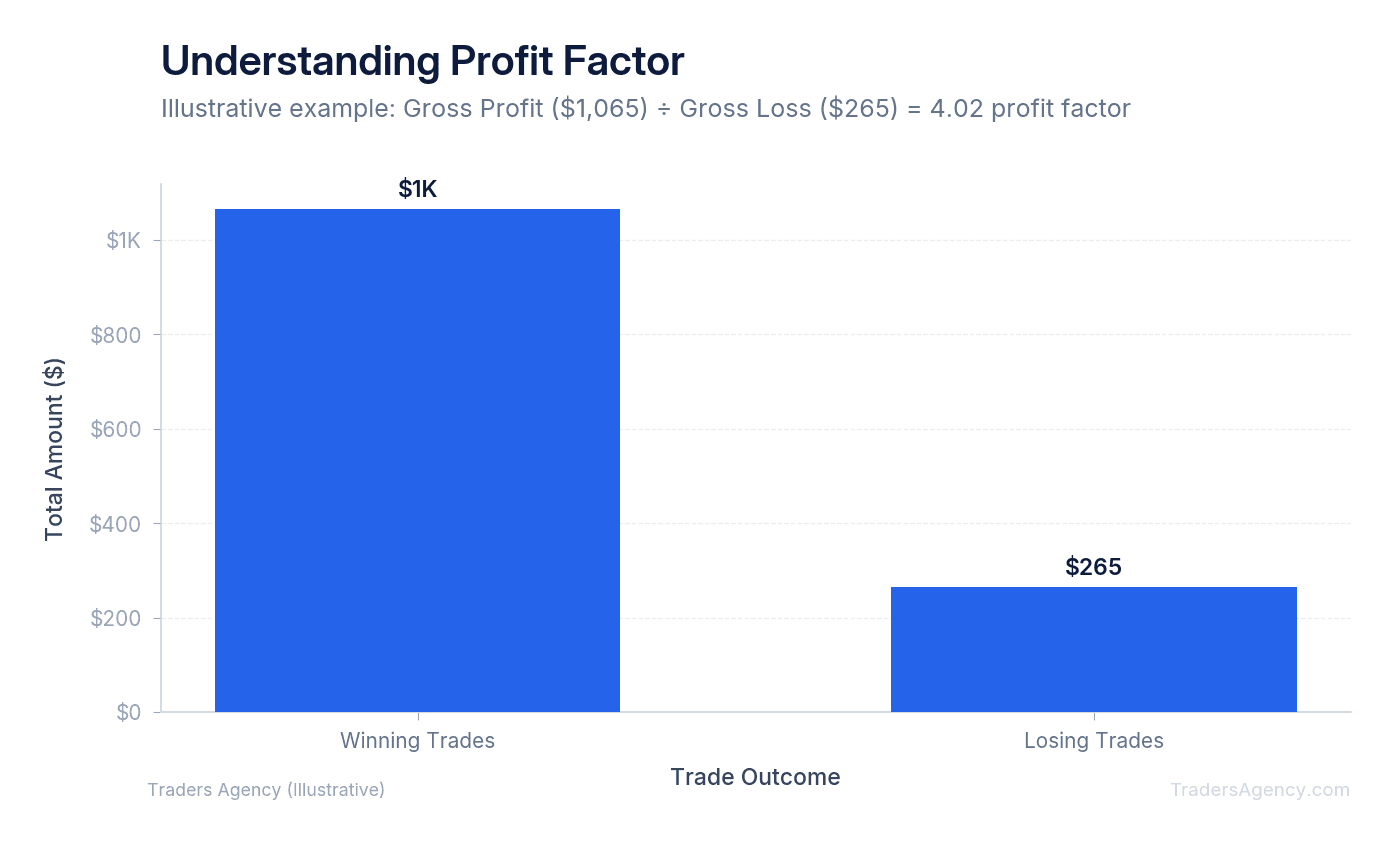
If your gross profits for the month were $5,000 and your gross losses were $2,500, your profit factor is 2.0. Any number above 1.0 means you are a profitable trader. Our team aims for a profit factor between 1.5 and 2.0.
Want expert trading insights delivered daily?
Join thousands of traders who rely on Traders Agency for market analysis and trade ideas.
Join Traders AgencyTrade Journaling Software vs. Spreadsheet Templates
If building your own Excel formulas sounds exhausting, you have other options. Many traders use dedicated trade journaling software to automate this entire process. These platforms connect directly to your broker or allow you to upload your CSV file. They instantly generate charts, graphs, and performance metrics without any manual data entry. They also automatically calculate your equity curve, which is a visual graph showing your account balance growing or shrinking over time.
Here are the three most common paths you can take:
- TraderVue: A popular online journal that automatically imports your data and tags your trades. It's excellent for visualizing your entry and exit points directly on a price chart.
- Edgewonk: This software focuses heavily on trading psychology and advanced statistics. It requires a bit more manual input but provides incredibly detailed feedback on your emotional state during trades.
- Spreadsheet Templates: If you want total control over your data without paying a monthly subscription fee, a pre-built Excel template is your best choice.
Our recommendation: start with a free spreadsheet to learn the mechanics, then upgrade to a paid software like TraderVue when you're taking dozens of trades per week. The learning you get from manually building your own spreadsheet is invaluable for understanding what the numbers actually mean.
When Should You Review Your Trading Data?
You should review your trading data at the end of every week and conduct a deep analysis at the end of every month. Reviewing your data while the market is closed prevents emotional decision-making and allows you to objectively evaluate your performance without the stress of active price movement.
We recommend setting aside one hour every Saturday morning for this task. Here's the weekly review process we use:
- Identify your biggest winning trade and your biggest losing trade of the week.
- Ask yourself specific questions about those trades. Did you follow your trading plan? Did you respect your stop loss? Did you take profits too early?
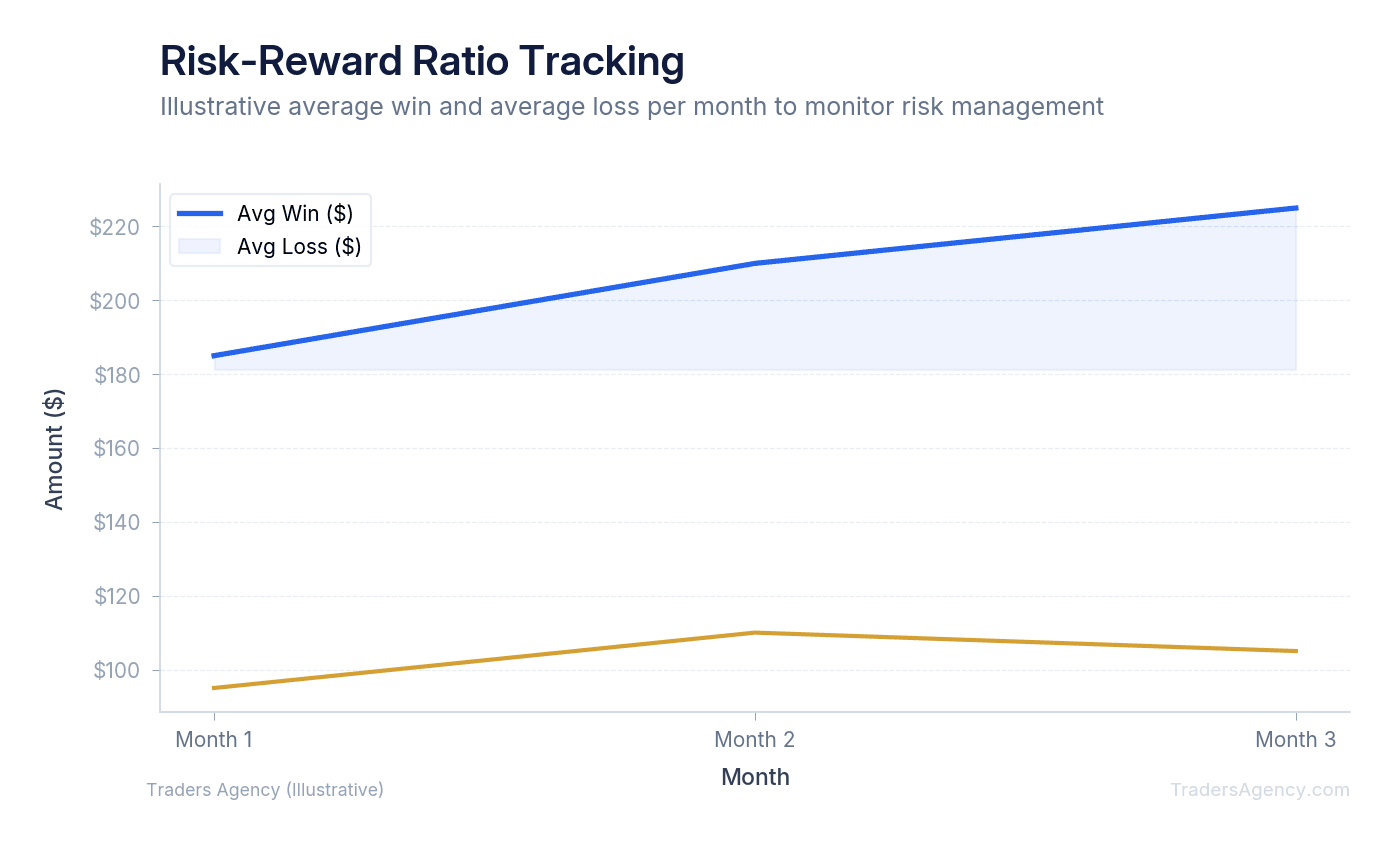
- Compare your average win to your average loss. If your data shows that your average loss is suddenly three times larger than your average win, you must stop trading immediately.
- At the end of the month, calculate your total metrics. Compare your current month to your previous month. If your performance is declining, you might need to adjust your strategy to match current market conditions.
Key Concept: This weekly review routine is a core component of proper risk management. If your numbers are deteriorating, reduce your position sizing and fix your strategy before you blow up your account. The data will always tell you the truth before your emotions will.
What Are the Most Common Pitfalls When Exporting and Analyzing Trade Data?
Here are the most common mistakes we see beginners make when they start analyzing their trade history:
- Analyzing incomplete data. If you leave open positions in your spreadsheet, it will skew your numbers. Only analyze closed, completed trades.
- Ignoring trading commissions and fees. Your broker might advertise zero-commission stock trades, but options contracts and regulatory fees still cost money. Always use your net profit, not your gross profit, when calculating your actual returns.
- Failing to track your emotional state. We recommend adding a column to your spreadsheet for notes. Write down exactly how you felt when you entered the trade. Were you experiencing fear of missing out? Tracking these emotions helps you identify destructive behavioral patterns.
- Overcomplicating your analysis. You don't need fifty different metrics to know if you're trading well.
Watch Out: Focus entirely on four numbers: your win rate, your average win, your average loss, and your profit factor. If you master these basic metrics, you'll have a massive advantage over the average retail trader. You'll stop guessing and start making decisions based on hard mathematical facts.
The difference between traders who improve and traders who stay stuck is simple. Improving traders measure everything. They know exactly which setups work, which days of the week they perform best, and which market conditions give them an edge. That knowledge comes from one place: consistently exporting and analyzing your trade history.
Want expert trading insights delivered daily?
Join thousands of traders who rely on Traders Agency for market analysis and trade ideas.
Join Traders AgencyKey Takeaways
- Exporting your trade history lets you calculate specific performance metrics like win rate, average loss, and profit factor rather than relying on raw brokerage statements that are difficult to parse.
- The game tape analogy is practical: you cannot identify a problem in your trading strategy without data that proves the problem exists.
- Traders who improve consistently track which setups work, which days of the week they perform best, and which market conditions give them an edge.
- Mastering the core metrics, including profit factor and average loss, gives retail traders a measurable advantage over those making decisions without hard data.
- The choice between trade journaling software and spreadsheet templates matters for workflow, but the consistent habit of exporting and reviewing data is what drives improvement.
DISCLAIMER: Traders Agency does not offer financial advice. The information provided is for educational purposes only and should not be considered financial advice. Traders Agency is not responsible for any financial losses or consequences resulting from the use of the information provided. Trading carries inherent risks and may not be suitable for all individuals. You are advised to conduct your own research and seek personalized advice before making any investment decisions, recognizing the potential risks and rewards involved.
See more from Traders Agency on Google
Make us a preferred source and our market analysis will appear more prominently in your Google Search, Top Stories, and AI results.
Add to Preferred Sources



