
A correlation tool for data analysis is a software application that measures how closely different assets move in relation to one another. You might own ten different stocks, but if they all drop at the exact same time, your portfolio lacks true protection. We see this happen constantly with new traders.
A beginner buys shares of Apple, Microsoft, and Nvidia, assuming they hold a diversified account. When the technology sector takes a hit, their entire account balance falls. They own different companies, but they own the exact same risk.
We're going to walk you through how to fix this problem using basic math. By the end of this guide, you'll know how to measure asset relationships and build a portfolio that actually protects your capital.
What Is a Correlation Coefficient and Why Does It Matter for Investors?
Bottom Line: The core lesson here is that diversification is a measurable property, not a feeling you get from holding many stocks. Correlation coefficients give you a specific number to evaluate whether your assets are genuinely independent or just different labels on the same risk. Traders who skip this step are not diversified; they are just exposed to the same losses across more positions.
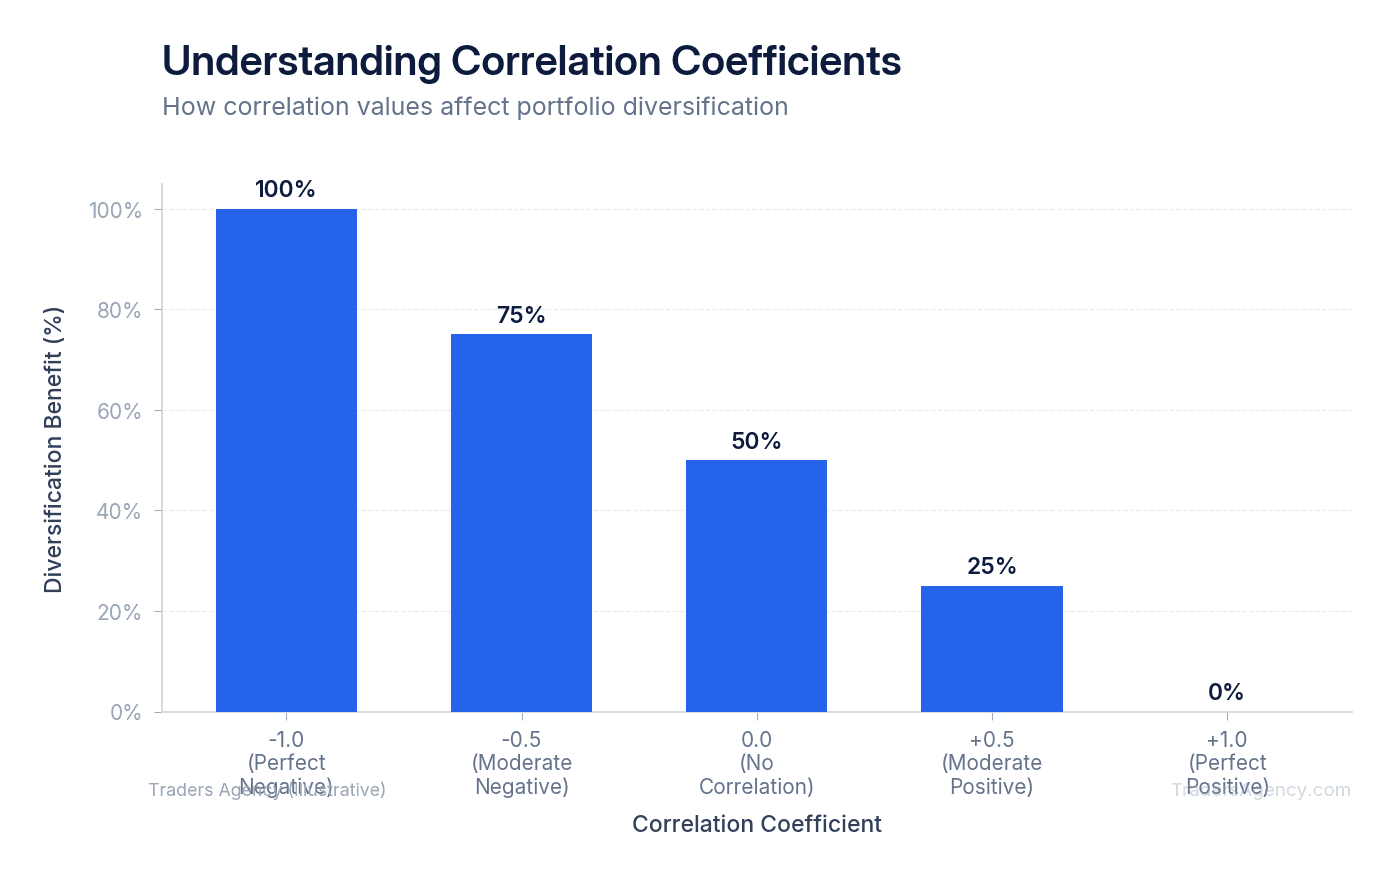
A correlation coefficient is a specific mathematical number ranging from -1.0 to +1.0 that shows the relationship between two investments. Investors use this metric to understand if assets move together, move in opposite directions, or have no relationship at all. This prevents you from buying redundant positions.
If two stocks have a correlation coefficient of +1.0, they move in perfect lockstep. If one rises, the other always rises too. A reading of -1.0 means they move in exact opposite directions. A reading of 0.0 means their price movements have zero relationship.
Think of an umbrella company and a sunscreen company. When it rains, umbrella sales go up and sunscreen sales go down. They have a negative correlation. We teach our members to look for this exact dynamic in the financial markets.
Key Concept: A correlation coefficient of +1.0 means two assets move in perfect lockstep. A score of -1.0 means they move in opposite directions. A score of 0.0 means no relationship exists. For true diversification, aim for holdings with scores between -0.30 and +0.50.
Holding assets that do not move together protects your capital during sudden drawdowns. If you only own stocks that move in the same direction, you experience massive account swings. Adding assets with a score near zero smooths out your equity curve over time.
What Tools Are Used for Correlation Analysis?
The most common platforms for measuring asset relationships include web-based scanners like Portfolio Visualizer, charting software like Koyfin, and custom spreadsheets. These applications function as a correlation analysis calculator, allowing traders to input multiple ticker symbols and instantly see how those assets interact historically.
The SEC's educational resources emphasize the importance of diversification to reduce risk. However, true diversification requires mathematical verification. We prefer to use dedicated software rather than guessing based on sector labels.
You can certainly build correlation spreadsheets in Excel, but modern web platforms save hours of manual work. Gathering daily closing prices for five different stocks over ten years requires massive data entry.
Web platforms automatically pull historical price data and apply the standard correlation analysis formula behind the scenes. Charting software also offers visual overlays. You can place two price charts on top of each other and apply a correlation indicator at the bottom of the screen. This allows you to focus on making trading decisions rather than formatting spreadsheet cells.
How Do You Use a Correlation Tool in Portfolio Visualizer?
We want to walk you through a concrete example using Portfolio Visualizer. This free web platform is an excellent starting point for beginners. Here's a hypothetical portfolio containing Apple (AAPL), Microsoft (MSFT), iShares 20+ Year Treasury Bond ETF (TLT), and SPDR Gold Trust (GLD).
- Step 1: Set Up the Assets. Go to the asset correlation tab on the platform. Enter the specific ticker symbols into the input boxes provided on the screen. Set your time frame. We typically recommend looking at a minimum of three to five years of daily data to get a reliable sample size. Short timeframes like one month produce noisy, unreliable data.
- Step 2: Run the Correlation Analysis Calculator. Click the button to generate the report. The software instantly processes the historical daily returns for all four assets. It outputs a grid known as a correlation matrix. This visual representation makes it easy to spot dangerous overlaps in your portfolio.
- Step 3: Evaluate the Results. Look at each pair of assets in the matrix. Identify any scores above 0.70, which indicate high positive correlation and potential redundancy. Flag pairs with scores below 0.30 as strong diversification candidates.
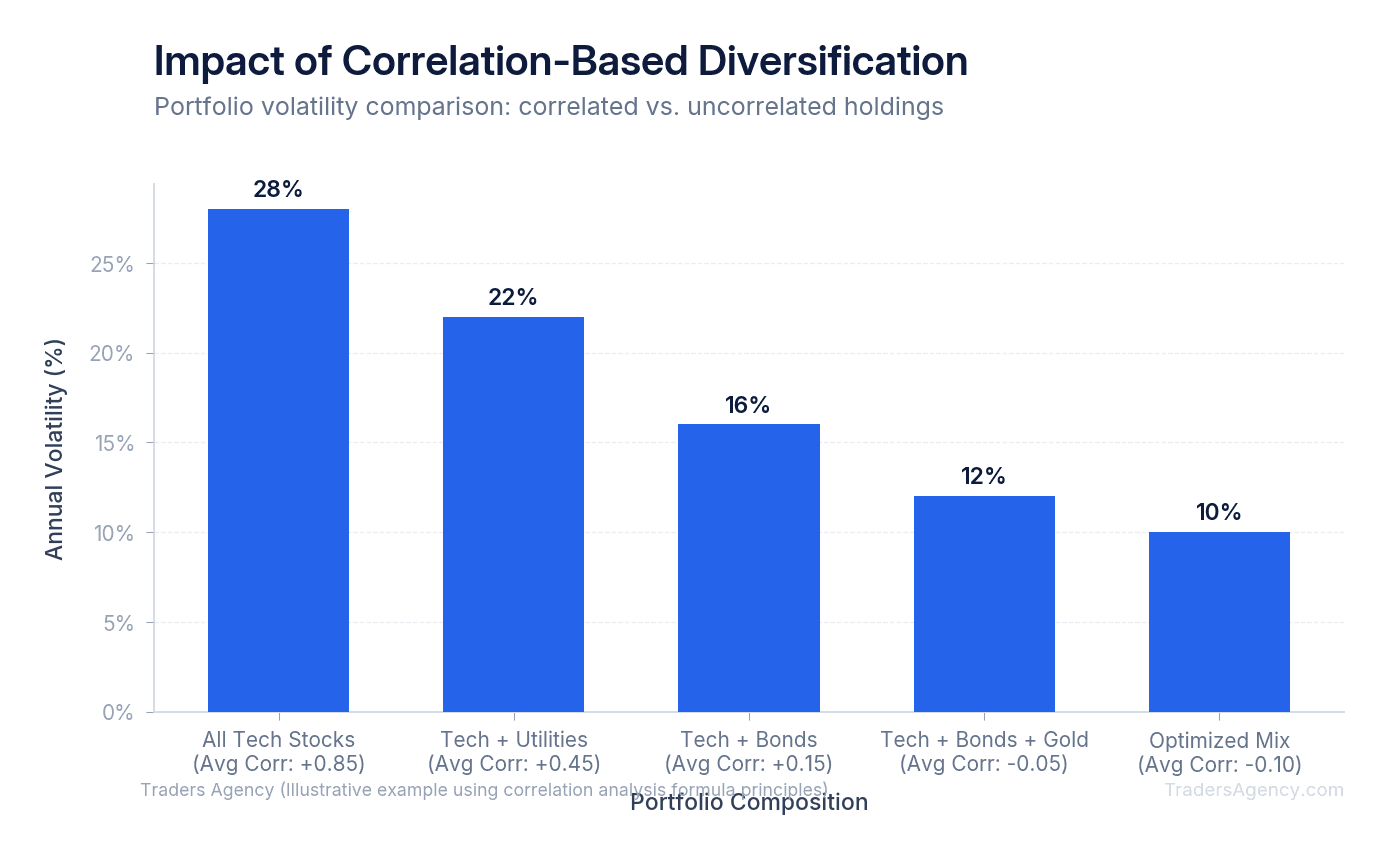
How Do You Read a Correlation Matrix?
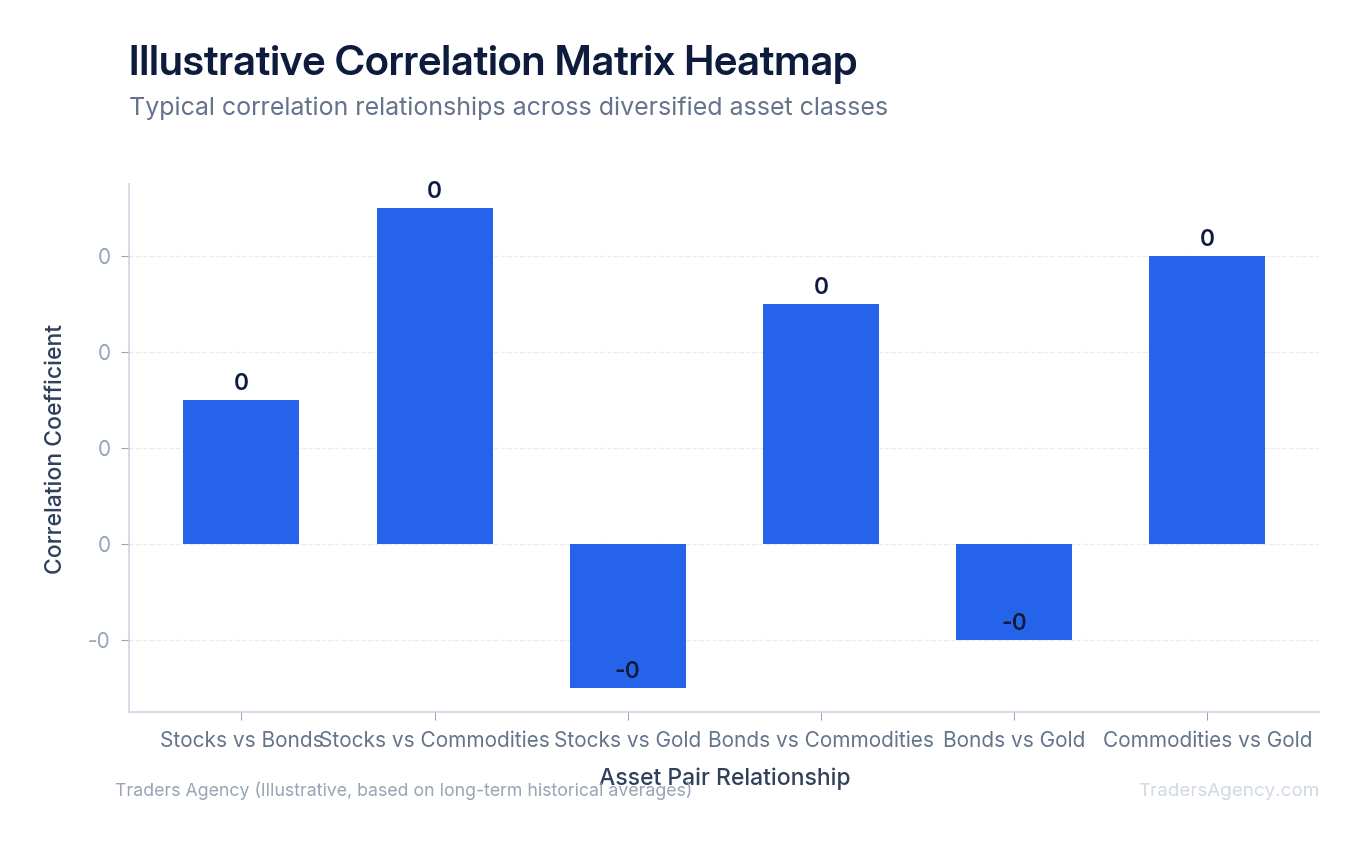
You read a correlation matrix by finding where the row of one asset intersects with the column of another asset. The number in that intersecting box is the correlation score. A score above 0.70 shows high positive correlation, while a score below 0.30 shows low correlation.
When you look at the grid, you'll notice a diagonal line of 1.00 scores. This simply shows that an asset correlates perfectly with itself. The valuable data sits in the other boxes.
| Asset Pair | Correlation Score | Diversification Value |
|---|---|---|
| AAPL vs MSFT | 0.85 | Low (highly correlated) |
| AAPL vs TLT | -0.15 | High (slight negative correlation) |
| AAPL vs GLD | 0.05 | Excellent (near zero correlation) |
| TLT vs GLD | 0.20 | Good (low positive correlation) |
In this example, AAPL and MSFT share a score of 0.85. They are highly correlated. Buying both does not provide much diversification. Conversely, AAPL and TLT have a score of -0.15. This slight negative relationship means Treasury bonds often move independently of technology stocks.
We prefer to combine assets with scores between -0.30 and +0.50 to build a truly diversified account. If you find a score of 0.05 between two assets, you've found an excellent opportunity to spread your risk.
Want expert trading insights delivered daily?
Join thousands of traders who rely on Traders Agency for market analysis and trade ideas.
Join Traders AgencyWhat Happens to Correlations During a Market Crisis?
During a severe market crash, historical correlations often break down and move closer to 1.0 across all asset classes. Investors panic and sell everything simultaneously to raise cash. This means investments that normally move independently will suddenly drop together during extreme financial panic.
We always warn our students about this phenomenon. You can build a perfectly balanced portfolio based on five years of normal market data. Then a sudden financial shock hits the global economy.
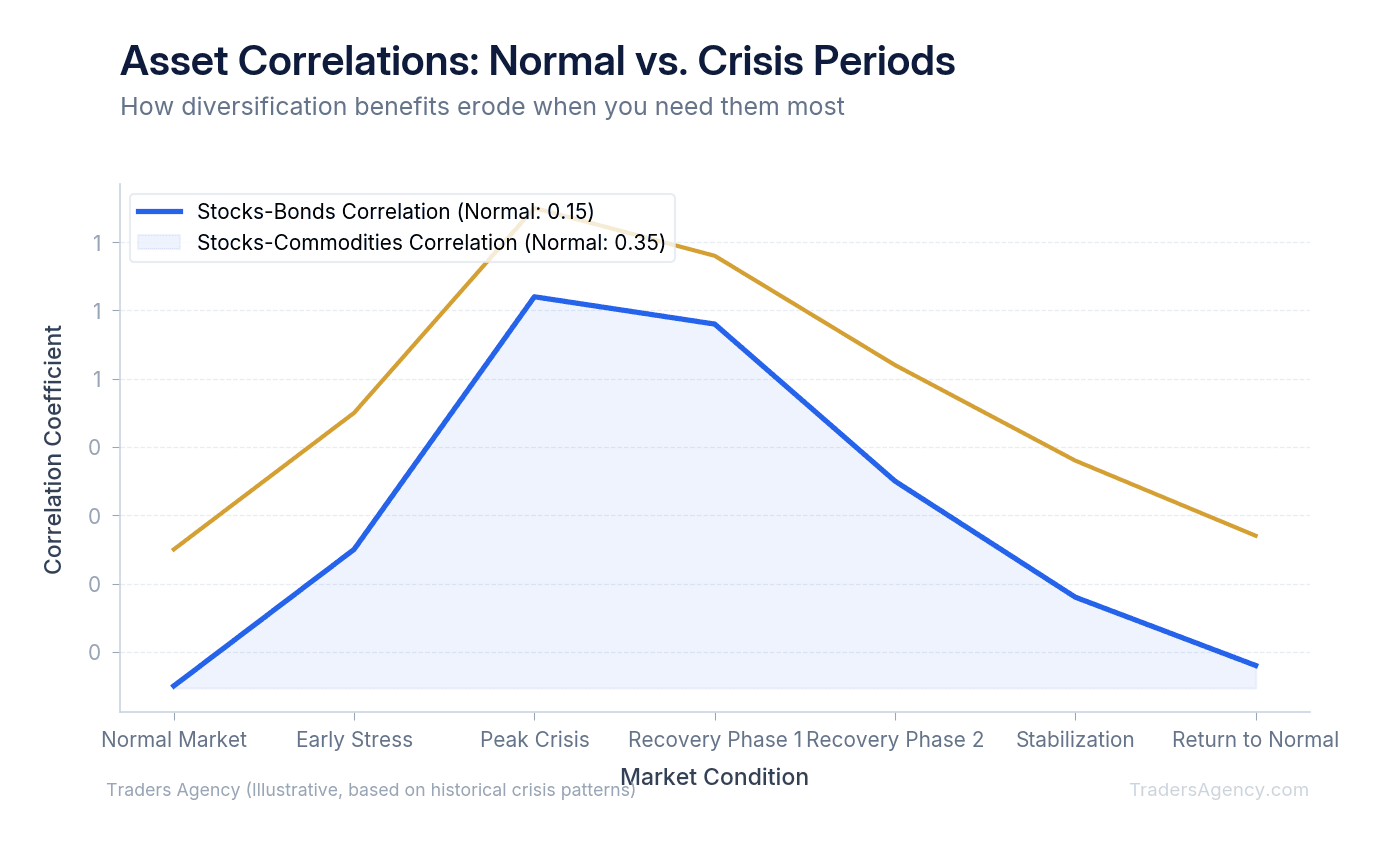
When margin calls hit institutional funds, they liquidate stocks, bonds, gold, and real estate all at once. They sell whatever they can to cover their debts. Your carefully calculated correlation coefficient of 0.20 might temporarily spike to 0.90.
Watch Out: Diversification reduces daily portfolio volatility, but it will not save you from a systemic market liquidation. During extreme panic, all correlations converge toward 1.0. You must still manage risk through proper position sizing and stop losses. Never allocate more than 2% to 5% of your total account equity to a single trade idea.
Because of this reality, we teach our members to use strict stop losses alongside their diversification strategy. Correlation analysis is your first line of defense. Position sizing and risk management are your second.
What Do Correlation Examples Look Like for Everyday Traders?
Here's a real-world application. Suppose you want to trade the energy sector. You consider buying ExxonMobil (XOM) and Chevron (CVX).
If you run these through a correlation tool for data analysis, you'll likely see a score above 0.80. Taking a full-sized position in both stocks doubles your risk. If oil prices fall, both stocks will drop together.
Instead, our team recommends pairing different asset classes entirely. You might pair a stock index fund with a commodities ETF. If the stock market enters a slow, grinding downtrend, the commodities position might remain flat or rise, stabilizing your account balance. This is how professionals construct their accounts.
Options traders also benefit from these tools. If you sell covered calls on two highly correlated stocks, a sector-wide drop will push both trades against you simultaneously. Spreading your options trades across uncorrelated sectors protects your premium income.
Our Rules for Correlation-Based Portfolio Construction
- Check before you buy. Always run the correlation of a new stock against your existing holdings before adding it to your portfolio.
- Set a threshold. Avoid holding multiple assets with a correlation score higher than 0.75.
- Re-run your analysis regularly. Asset relationships slowly drift over time. Update your correlation matrix every six months.
- Adjust position sizing accordingly. If you must hold two highly correlated stocks, cut the dollar allocation for each in half.
Key Concept: Diversification is not about owning many different tickers. It's about owning assets that respond differently to market conditions. The only way to verify this is by measuring correlation scores mathematically.
By implementing these rules, you protect your capital from concentrated sector sell-offs. You stop guessing about diversification and start measuring it objectively.
Want expert trading insights delivered daily?
Join thousands of traders who rely on Traders Agency for market analysis and trade ideas.
Join Traders AgencyKey Takeaways
- A correlation coefficient runs from -1.0 to +1.0. A score of +1.0 means two assets move in perfect lockstep, -1.0 means they move in exact opposite directions, and 0.0 means no relationship exists between them.
- Owning multiple stocks in the same sector, such as Apple, Microsoft, and Nvidia, does not create diversification. It creates the illusion of diversification while concentrating risk in a single sector.
- If two holdings show a high positive correlation and you choose to keep both, the article recommends cutting the dollar allocation for each position in half to reduce concentrated exposure.
- Reviewing your correlation matrix every six months is a practical maintenance step, since asset relationships shift over time and a portfolio that was diversified last year may not be today.
- True diversification is not measured by the number of tickers you own. It is measured by whether those assets respond differently to the same market conditions, which requires running the actual correlation math.
DISCLAIMER: Traders Agency does not offer financial advice. The information provided is for educational purposes only and should not be considered financial advice. Traders Agency is not responsible for any financial losses or consequences resulting from the use of the information provided. Trading carries inherent risks and may not be suitable for all individuals. You are advised to conduct your own research and seek personalized advice before making any investment decisions, recognizing the potential risks and rewards involved.
See more from Traders Agency on Google
Make us a preferred source and our market analysis will appear more prominently in your Google Search, Top Stories, and AI results.
Add to Preferred Sources



