
Relative strength analysis is a technical method we use to compare the performance of a specific stock against a benchmark index or another security. This technique helps us identify market leaders that are outperforming the broader market. You've probably watched a market rally where some stocks skyrocket while others barely move. That performance gap is exactly what this methodology measures, and it's one of the most powerful tools in our trading toolkit.
Our team relies on this data to find stocks with heavy institutional backing. When a stock holds its ground during a market selloff, it reveals underlying demand. We're going to walk you through how to calculate this metric, read the charts, and apply these concepts to real trades. By the end of this guide, you'll know how to spot early breakout signals and avoid false positives in your trading routine.
What Is Relative Strength Analysis and Why Does It Matter?
Bottom Line: Relative strength analysis gives traders a systematic way to identify which stocks are attracting buying pressure relative to the broader market, so capital can be directed toward leaders rather than laggards. The practical value comes from combining RS signals with disciplined risk management, keeping losses small on failed breakouts while staying positioned for the stocks that move with institutional momentum. The framework here is a starting point, not a guarantee, and the article consistently emphasizes that strong relative strength reduces risk but does not eliminate it.
Relative strength analysis matters because it highlights which assets attract institutional buying pressure during market corrections. When a stock holds its value while the S&P 500 drops, it shows underlying demand. Traders use this data to buy strong stocks that often explode higher once the broader market stabilizes.
We teach our members to focus their capital on the strongest names available. If you buy a laggard, you fight an uphill battle against market momentum. A proper relative strength analysis chart visually separates the true market leaders from the weak performers. This visual separation keeps you out of value traps.
Standard financial education principles, including guidance from the Financial Industry Regulatory Authority (FINRA), emphasize the importance of comparing individual investments to appropriate market benchmarks. We apply this same logic directly to our technical charts. By comparing a stock to a major index, we can see exactly where the big money is flowing.
Key Concept: Relative strength analysis compares a stock's performance to a benchmark index. A rising RS line means the stock is outperforming the market. A falling RS line means it's underperforming. This single visual tells you where institutional money is flowing.
How Do You Calculate Relative Strength?
To figure out relative strength, you divide the price of a stock by the price of a benchmark index like the S&P 500. You then plot this ratio on a chart as a continuous line. When the line rises, the stock is outperforming the benchmark, regardless of whether the overall market is up or down.
The basic relative strength formula is straightforward: (Stock Price / Benchmark Price) × 100. You don't need to calculate this by hand every day. Most modern charting platforms will plot this ratio for you automatically.
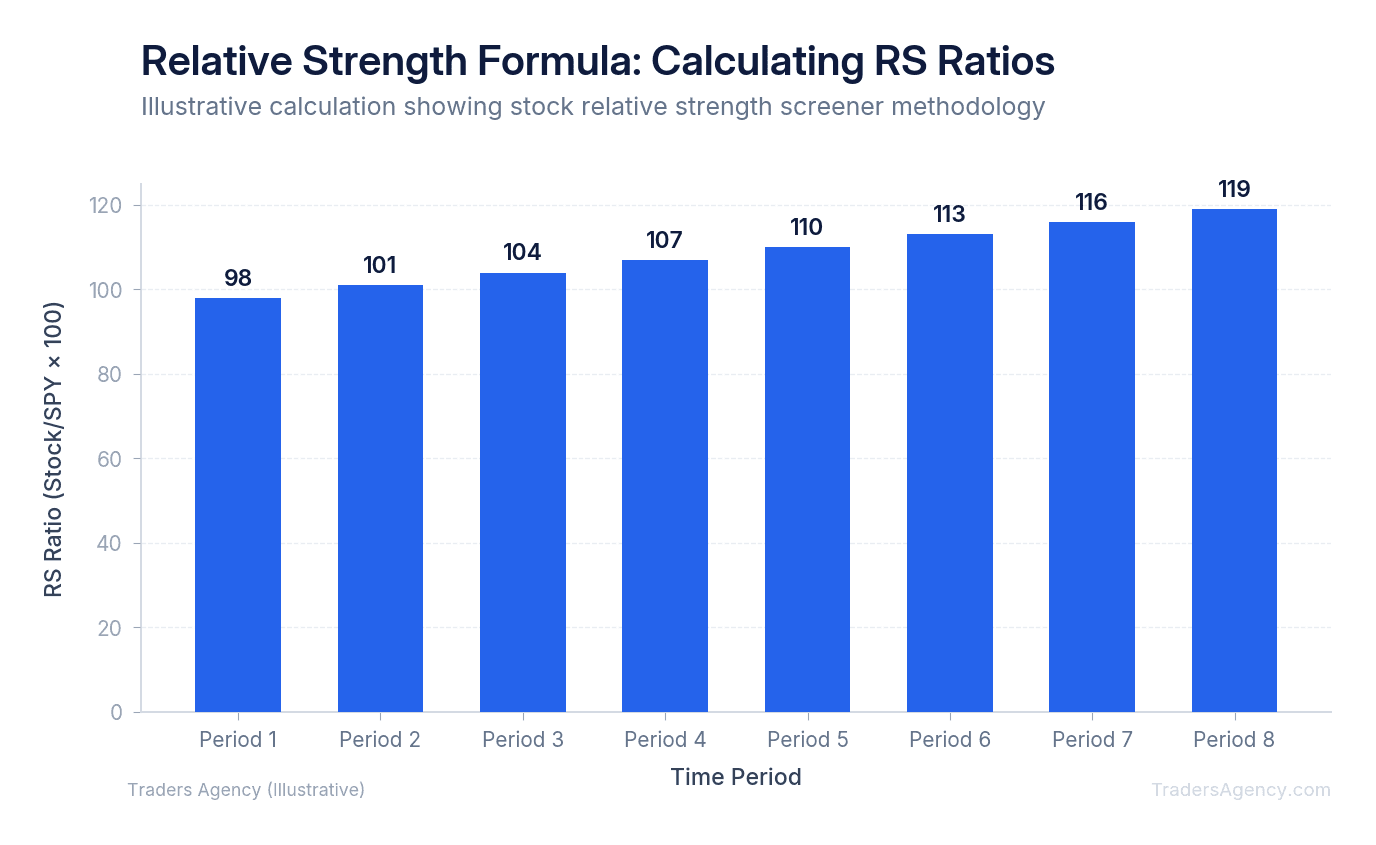
If you want to build a relative strength line manually, you simply track the daily ratio. Here's a quick example:
| Scenario | AAPL Price | SPY Price | RS Ratio | Signal |
|---|---|---|---|---|
| Day 1 | $170 | $500 | 0.34 | Baseline |
| Day 2 (AAPL outperforms) | $175 | $500 | 0.35 | RS line rising: outperformance |
| Day 3 (AAPL underperforms) | $170 | $505 | 0.3366 | RS line falling: underperformance |
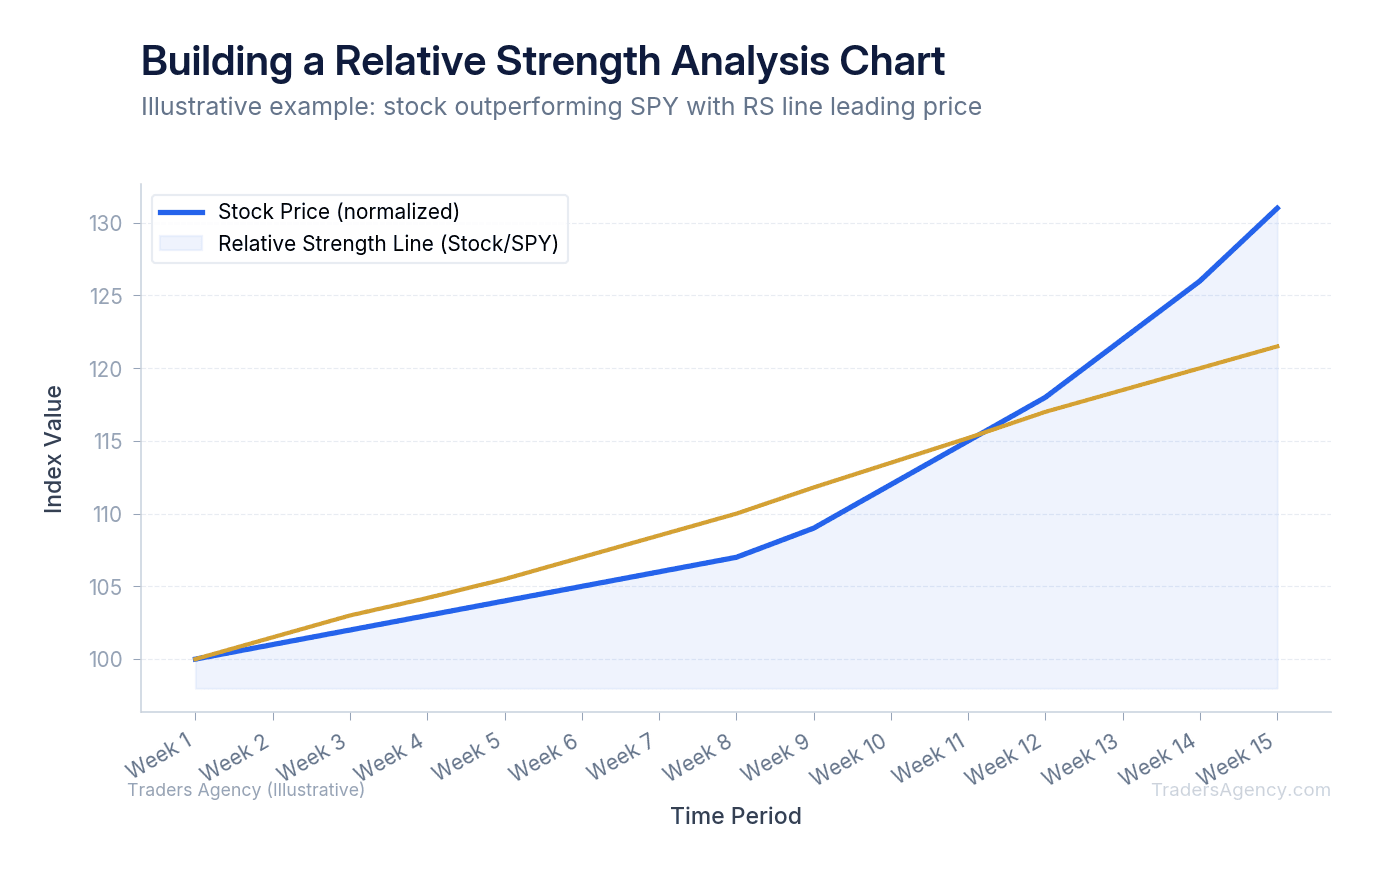
Some traders prefer to use a dedicated relative strength analysis calculator to compare multiple assets at once. However, we prefer using a visual line on our daily charts. A rising line confirms strength, a flat line shows market-matching performance, and a falling line warns of weakness.
Building a Relative Strength Analysis Strategy
To turn this concept into a practical relative strength analysis strategy, you need a repeatable process. We prefer to scan the market for specific setups rather than guessing which stocks might be strong. Using a stock relative strength screener helps filter out the noise and leaves you with a list of high-probability candidates.
Here are the exact steps we teach our members for finding and trading market leaders:
- Define the Benchmark: Select a broad market index that matches your trading universe. We typically use the SPY for large-cap US stocks and the Invesco QQQ Trust (QQQ) for technology names.
- Scan for Outperformance: Run a screen for stocks trading within 5% of their 52-week highs while the broader market is in a correction or consolidation phase.
- Verify the RS Line: Open the daily chart and confirm the relative strength line is trending upward over the past 60 to 90 days.
- Identify the Entry Trigger: Wait for the stock to break out of a recognized chart pattern, such as a flat base or a cup with handle, on higher-than-average volume.
Here's a concrete example. Assume the SPY drops 10% over a two-month period. During that same window, Microsoft (MSFT) only drops 2% and begins building a flat base. The RS line for MSFT will spike upward because it's holding its value better than the index.
| Parameter | Value |
|---|---|
| Stock | MSFT |
| Market Decline (SPY) | -10% over 2 months |
| MSFT Decline | -2% (relative outperformance) |
| Entry Point | Breakout at $405 |
| Stop Loss | $385 (below consolidation) |
| Risk per Share | $20 |
When the market finally bottoms and turns higher, MSFT is already positioned near its highs. We look to enter MSFT at the breakout point with a stop loss placed just below the recent consolidation. The expected outcome is a fast move higher as institutional money continues flowing into the proven leader.
Sector Relative Strength: Identifying Rotation Opportunities
You can apply these exact same principles to entire market sectors. Money constantly rotates between different areas of the market based on economic conditions. By comparing sector ETFs to the broader market, you can identify where institutional capital is hiding.
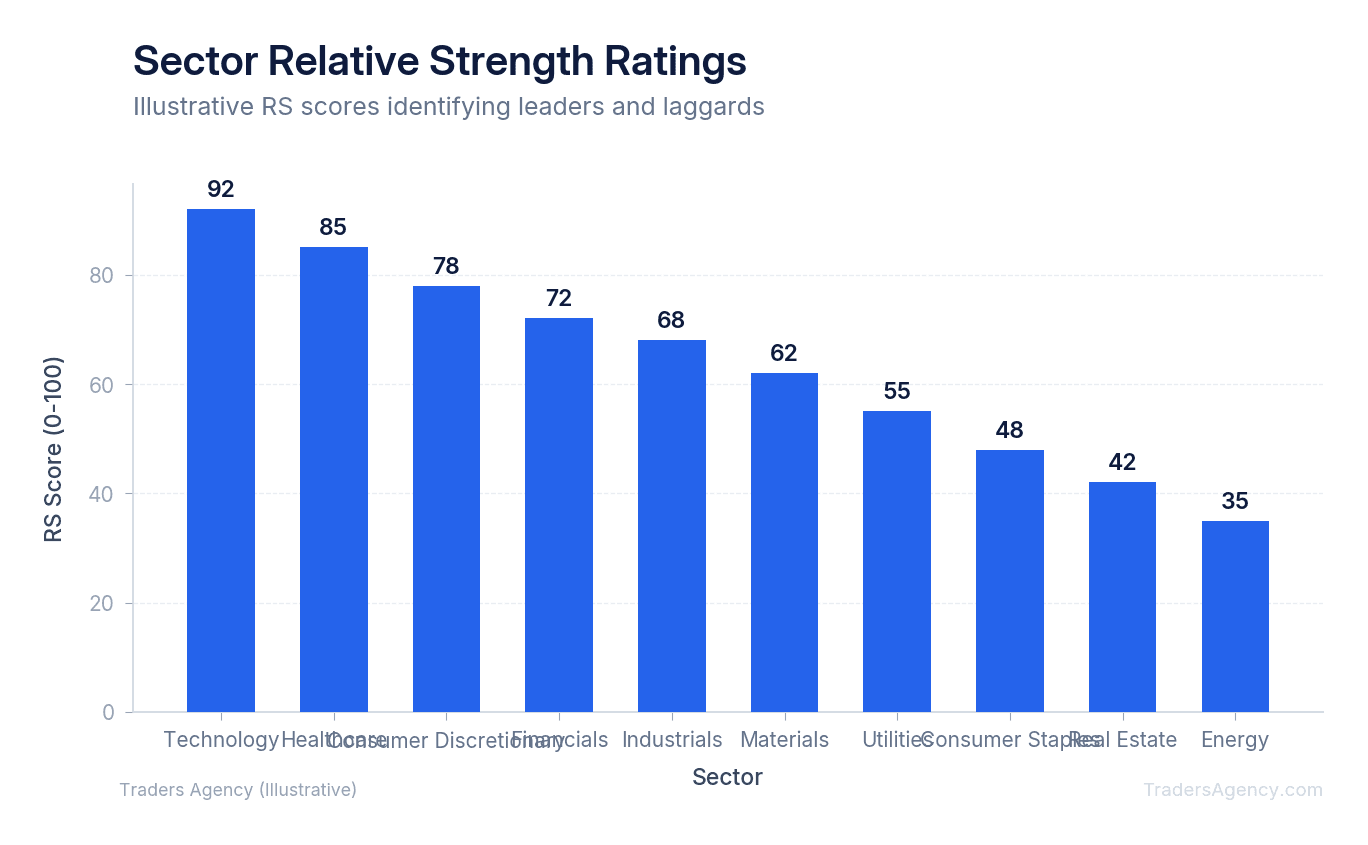
For instance, we frequently compare the Technology Select Sector SPDR Fund (XLK) against the Energy Select Sector SPDR Fund (XLE). If the XLK/SPY ratio is rising while the XLE/SPY ratio is falling, we know technology is the leading sector. We then focus our individual stock screens exclusively on technology names.
This top-down approach saves time and increases your win rate. Buying the strongest stock in the weakest sector is a common mistake. We prefer to buy the strongest stock in the strongest sector to maximize our momentum.
Key Concept: Always work from the top down. First identify the strongest sector using RS analysis, then find the strongest individual stock within that sector. This two-layer filter dramatically improves your odds of catching a winning trade.
Want expert trading insights delivered daily?
Join thousands of traders who rely on Traders Agency for market analysis and trade ideas.
Join Traders AgencyWhat Does a New RS High Tell You About a Potential Breakout?
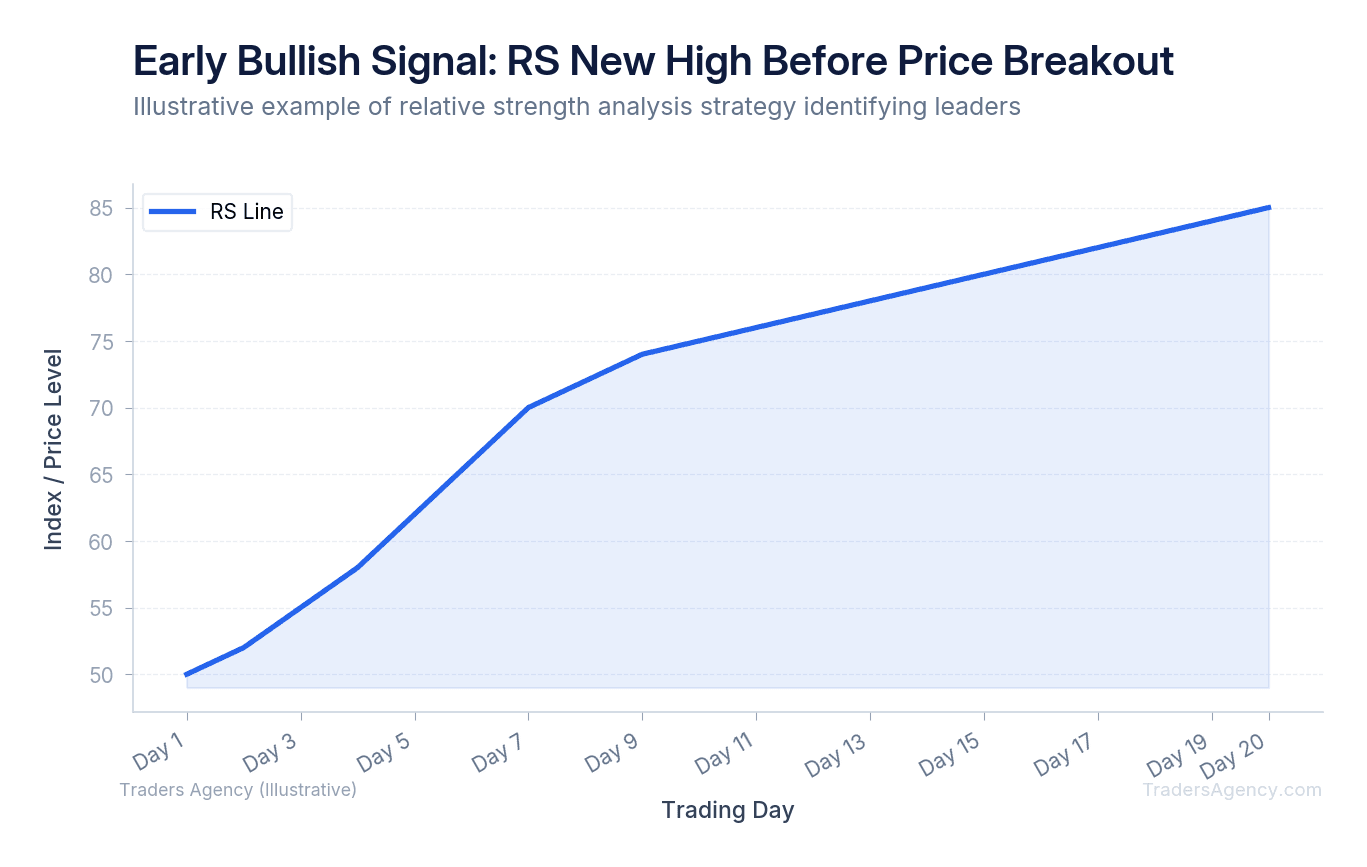
A new relative strength high signals a bullish breakout by showing that a stock is gaining momentum faster than the overall market before its actual price breaks resistance. This early indicator reveals hidden institutional accumulation, giving traders a head start on entering a position before the crowd arrives.
When a stock's RS line hits a new 52-week high before the stock price hits a new 52-week high, it's a massive green light. We consider this one of the most reliable leading indicators in technical analysis. It tells us that buyers are aggressively accumulating shares even while the price remains stuck under overhead resistance.
Many traders use the IBD Relative Strength Rating to quantify this momentum. This specific rating ranks all stocks on a scale of 1 to 99 based on their 12-month performance. A rating of 85 means the stock has outperformed 85% of all other stocks in the market. We generally restrict our buying to stocks with a rating of 80 or higher.
To avoid false signals, you must confirm the RS new high with volume. If the RS line spikes but daily trading volume is 50% below average, the signal is weak. We want to see the RS line break out on volume that is at least 20% above the 50-day average.
How Can You Use Relative Strength for Pair Trading?
Pair trading is an advanced application of this concept where you buy a strong asset and short a weak asset simultaneously. This strategy aims to generate profits regardless of overall market direction. You're simply betting that the strong stock will continue to outperform the weak stock.
Suppose you analyze the retail sector and find that Walmart (WMT) has a rising RS line while Target (TGT) has a falling RS line. You could buy 100 shares of WMT at $160 and short an equivalent dollar amount of TGT at $140.
| Market Scenario | WMT (Long) | TGT (Short) | Net Result |
|---|---|---|---|
| Market crashes | Falls less (stronger RS) | Falls more (weaker RS) | Net profit on short side |
| Market rallies | Rises faster (stronger RS) | Rises slower (weaker RS) | Net profit on long side |
| Market flat | Holds steady or rises | Drifts lower | Net profit from divergence |
The key to pair trading is ensuring both stocks belong to the same sector so they are exposed to the same external economic factors. This neutralizes broad market risk and isolates the relative performance difference you're trying to capture.
Watch Out: Pair trading involves shorting stocks, which carries theoretically unlimited risk. Always use stop losses on both legs of the trade, and make sure you understand margin requirements before entering short positions.
RSI vs. Relative Strength: Clearing Up the Confusion
A good RSI level to buy typically falls between 30 and 40 for oversold bounce plays, or above 50 when confirming a new uptrend. However, traders must distinguish between the Relative Strength Index momentum oscillator and true relative strength analysis, which compares two different assets directly.
Many beginners confuse these two terms. The Relative Strength Index (RSI) is a momentum oscillator that measures the speed and change of price movements for a single stock. True relative strength compares a stock to a benchmark. They are completely different tools.
If you're using RSI to time your entries on a strong stock, we prefer waiting for the RSI to dip to the 40 to 50 range during a pullback. Buying a stock when its RSI is above 70 often means you're chasing an extended move. We combine both tools: we find the leaders using benchmark comparison, and we time our entries using the RSI oscillator.
Practical Application and Common Mistakes
Knowing when to avoid this strategy is just as important as knowing when to use it. This approach works best in trending markets or during the late stages of a market correction. It performs poorly in choppy, sideways markets where leadership changes daily.
Here are the most common mistakes we see traders make with relative strength analysis:
- Buying extended stocks: A stock might have a rating of 95 but be extended 20% above its ideal buy point. Buying extended stocks usually leads to getting stopped out during normal pullbacks.
- Ignoring the chart pattern: High relative strength alone isn't enough. You still need a proper base pattern and a clear breakout point before entering.
- Using RS in choppy markets: Leadership rotates too quickly in sideways markets, making RS signals unreliable.
- Skipping volume confirmation: An RS breakout without above-average volume is a weak signal that often fails.
Risk Warning: We recommend risking no more than 1% to 2% of your total account equity on any single trade. If you have a $50,000 account, your maximum risk per trade should be $500 to $1,000. Always set a hard stop loss before you enter the trade. If the stock drops below the breakout point and violates its moving averages, the relative strength thesis is broken. Take the small loss and move on.
Here's our recommended risk management framework for an RS breakout trade:
| Parameter | Value |
|---|---|
| Account Size | $50,000 |
| Max Risk per Trade | 1-2% ($500 to $1,000) |
| Breakout Entry | $100 |
| Stop Loss | $92-$93 (below consolidation) |
| Risk per Share | $7-$8 |
| Position Size | 62-142 shares (based on risk budget) |
This systematic approach keeps your losses small and your winners large. When you combine strong relative strength with proper risk management, you put yourself on the same side as the institutions that move markets.
Want expert trading insights delivered daily?
Join thousands of traders who rely on Traders Agency for market analysis and trade ideas.
Join Traders AgencyKey Takeaways
- A stock that holds its value during an S&P 500 selloff signals underlying institutional demand, making it a candidate for relative strength analysis.
- The example risk framework uses a $50,000 account with 1-2% max risk per trade ($500-$1,000), a stop loss set below consolidation at $92-$93 on a $100 entry, and a position size of 62-142 shares depending on the risk budget.
- Buying a laggard means trading against market momentum; relative strength analysis helps traders focus capital on the strongest names rather than fighting that headwind.
- Sector relative strength rotation analysis can reveal which areas of the market are attracting capital before individual stock breakouts become obvious.
- A new relative strength high can signal a bullish breakout, but the article flags the importance of distinguishing early breakout signals from false positives.
DISCLAIMER: Traders Agency does not offer financial advice. The information provided is for educational purposes only and should not be considered financial advice. Traders Agency is not responsible for any financial losses or consequences resulting from the use of the information provided. Trading carries inherent risks and may not be suitable for all individuals. You are advised to conduct your own research and seek personalized advice before making any investment decisions, recognizing the potential risks and rewards involved.
See more from Traders Agency on Google
Make us a preferred source and our market analysis will appear more prominently in your Google Search, Top Stories, and AI results.
Add to Preferred Sources



