
You've probably seen this happen on a chart. A stock pushes to new highs, pulls back slightly, pushes higher again, and then suddenly reverses. Our team sees traders get caught on the wrong side of these moves every single day. We're going to walk you through a framework that helps make sense of this seemingly random price action: Elliott Wave Theory. By the end of this guide, you'll know how to identify recurring market cycles, plan your trade entries, set logical profit targets, and manage your risk with confidence.
What Is Elliott Wave Theory in Simple Words?
Bottom Line: Elliott Wave Theory gives traders a structured way to read crowd psychology directly on a price chart, turning what looks like random movement into identifiable, repeating cycles. The practical edge comes from combining wave counts with Fibonacci levels to time entries and exits with defined risk. The framework only works consistently when applied to liquid markets with strict position sizing and a clear invalidation level on every trade.
Elliott Wave Theory is a framework that maps crowd psychology onto price charts using predictable wave patterns. The core idea is straightforward: markets move in a primary trend through five distinct waves, followed by a three-wave correction against that trend. Together, these form a complete eight-wave cycle.
When traders ask us to explain this concept in plain English, we like to use the analogy of an incoming tide. The water pushes forward up the beach, recedes slightly, and then pushes forward again. Financial markets behave the exact same way. Buying pressure advances in waves, with brief pullbacks in between, before the whole cycle reverses.
Key Concept: Elliott Wave Theory is a visual representation of human greed and fear playing out in real time. It tracks the natural rhythm of buying and selling pressure across any liquid market.
This is not a magic formula. It's a method recognized across the technical analysis community as a way to read the emotional pulse of the market. While markets have evolved with high-frequency trading and algorithmic execution, human emotions remain identical. Fear and greed still dictate the primary trend. This theory simply gives you a map to track those emotions.
What Is the Five-Wave Impulse Pattern?
The foundation of this strategy is the five-wave impulse pattern. This sequence moves in the direction of the larger market trend. Three of these waves push the price forward (Waves 1, 3, and 5), while two provide temporary pullbacks (Waves 2 and 4).
Our team teaches three unbreakable rules for this structure:
- Rule 1: Wave 2 can never retrace more than 100% of Wave 1.
- Rule 2: Wave 3 can never be the shortest of the three directional waves (Waves 1, 3, and 5).
- Rule 3: Wave 4 can never enter the price territory of Wave 1 (in standard impulse waves).
Watch Out: If any of these three rules are violated, your wave count is wrong. There are no exceptions. Redraw your analysis from scratch rather than forcing a count that breaks these rules.
Wave One: Initiation
This is the starting point of a new trend. The fundamental news is usually still negative, but smart money begins accumulating shares. The price action is often slow and steady as early buyers quietly build their positions.
Wave Two: Pullback
Early buyers take profits, causing a sharp reversal. Retail traders often assume the old downtrend is resuming. However, the selling pressure dries up before breaking the starting point of the first wave, leaving a higher low on the chart.
Wave Three: Acceleration
This is typically the longest and strongest phase. The broader market recognizes the new trend, and volume spikes significantly. We prefer to target this specific wave for our most profitable trades because the momentum is strong and clear.
Wave Four: Consolidation
The market pauses to digest the massive gains from the previous phase. This pullback is usually shallow and moves sideways. Volume tends to drop as traders wait for the next directional signal.
Wave Five: Exhaustion
The final push higher is driven by latecomers and retail hype. The fundamental news is overwhelmingly positive, but the actual momentum is slowing down. Smart money is quietly distributing their shares to eager buyers before the trend reverses.
What Are the Three Main Elliott Wave Corrective Patterns?
After a five-wave advance completes, the market enters a three-wave corrective phase. This is where the trend temporarily reverses to shake out weak hands. We label these corrective moves as waves A, B, and C.
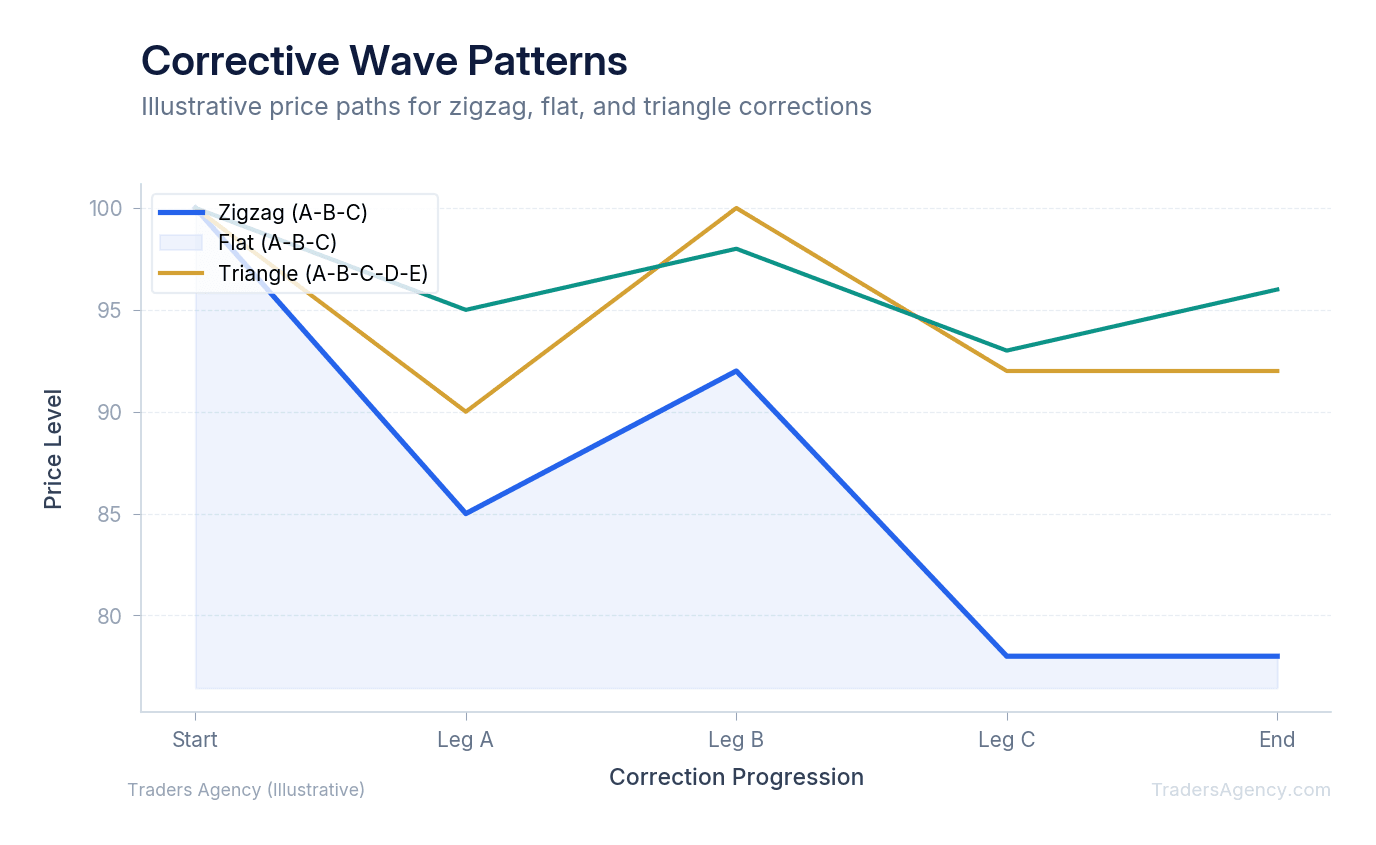
The most standard correction is the zigzag pattern, which forms a sharp decline. It contains a specific internal structure where Wave A has five sub-waves, Wave B has three, and Wave C has five. This aggressive pullback often scares novice traders out of good long-term positions.
The flat pattern moves sideways, creating a range-bound environment. Wave A and Wave B both contain three sub-waves, while Wave C contains five. This structure frustrates breakout traders because it constantly triggers false signals in both directions.
The triangle pattern features contracting price action that builds energy for the next major move. It consists of five overlapping sub-waves labeled A, B, C, D, and E. We look for volume to dry up completely right before the price violently breaks out of the triangle.
While there are technically 13 Elliott Wave patterns when you account for complex variations, you only need to master these basic three to start. Our team recommends keeping your analysis as simple as possible. Overcomplicating the corrective phase is a fast way to paralyze your decision-making.
Want expert trading insights delivered daily?
Join thousands of traders who rely on Traders Agency for market analysis and trade ideas.
Join Traders AgencyHow to Count Elliott Waves on a Price Chart
Let's look at a concrete example of how to apply this to a real trade. Assume you're watching a stock like Apple (AAPL) trading at $150. You want to know if it's safe to buy.
- Identify the Broad Trend: Zoom out to a daily chart to confirm the primary direction. You can use an Elliott Wave indicator on your charting platform to help highlight potential turning points. If the stock is in a clear uptrend, you should only look for bullish impulse setups.
- Spot the First Impulse: You watch AAPL rally from $150 to $160, marking Wave 1. It then pulls back to $154, marking Wave 2. Because $154 is higher than the $150 starting point, the setup remains valid. You enter a long position at $155 as the stock begins to turn higher.
- Set Your Invalidation Level: Before the trade develops, you must know where you're wrong. The rules state that Wave 2 cannot drop below the start of Wave 1. You place your strict stop loss at $149. If the price hits $149, your wave count is incorrect, and you must exit the trade immediately.
- Measure the Target and Exit: The stock surges to $175 for Wave 3, consolidates sideways at $170 for Wave 4, and makes a final push to $180 for Wave 5. Once you identify that fifth wave losing momentum, you sell your position. You successfully capture the meat of the move before the ABC correction drags the price back down to $165.
| Parameter | Value |
|---|---|
| Stock | AAPL at $150 |
| Entry Price | $155 (Wave 2 completion) |
| Stop Loss | $149 (below Wave 1 start) |
| Wave 3 Target | $175 |
| Wave 5 Exit | $180 |
| Risk per Share | $6 |
| Reward per Share | $25 |
| Risk-to-Reward Ratio | 1:4.2 |
How Do You Use Fibonacci Ratios with Elliott Wave?
Counting waves is highly subjective if you don't use mathematical targets. This is where Fibonacci retracement levels become essential. The two concepts were practically made for each other.
In advanced Elliott Wave analysis, we use specific Fibonacci ratios to predict where a wave is likely to end. Here's how the key ratios map to each wave:
- Wave 2 usually retraces 50% or 61.8% of the distance covered by Wave 1. If a stock moves up $10, we expect a $5 to $6.18 pullback before the trend resumes.
- Wave 3 is famous for extending to the 161.8% Fibonacci extension of Wave 1. If you buy near the bottom of Wave 2, you can place your profit target directly at that 161.8% level for a highly favorable risk-to-reward ratio.
- Wave 4 typically retraces a shallow 38.2% of Wave 3. If you missed the initial entry, this shallow pullback offers a final opportunity to join the trend before Wave 5 begins.
Key Concept: Layer Fibonacci retracement and extension levels directly over your wave counts. When a Fibonacci level and a wave target line up at the same price, that zone becomes a high-probability turning point.
Elliott Wave Time Cycles and Timeframe Selection
Many beginners focus entirely on price and ignore the element of time. Understanding Elliott Wave time cycles helps you align your expectations with reality. A wave cycle on a five-minute chart might complete in an hour, while a daily chart cycle could take years.
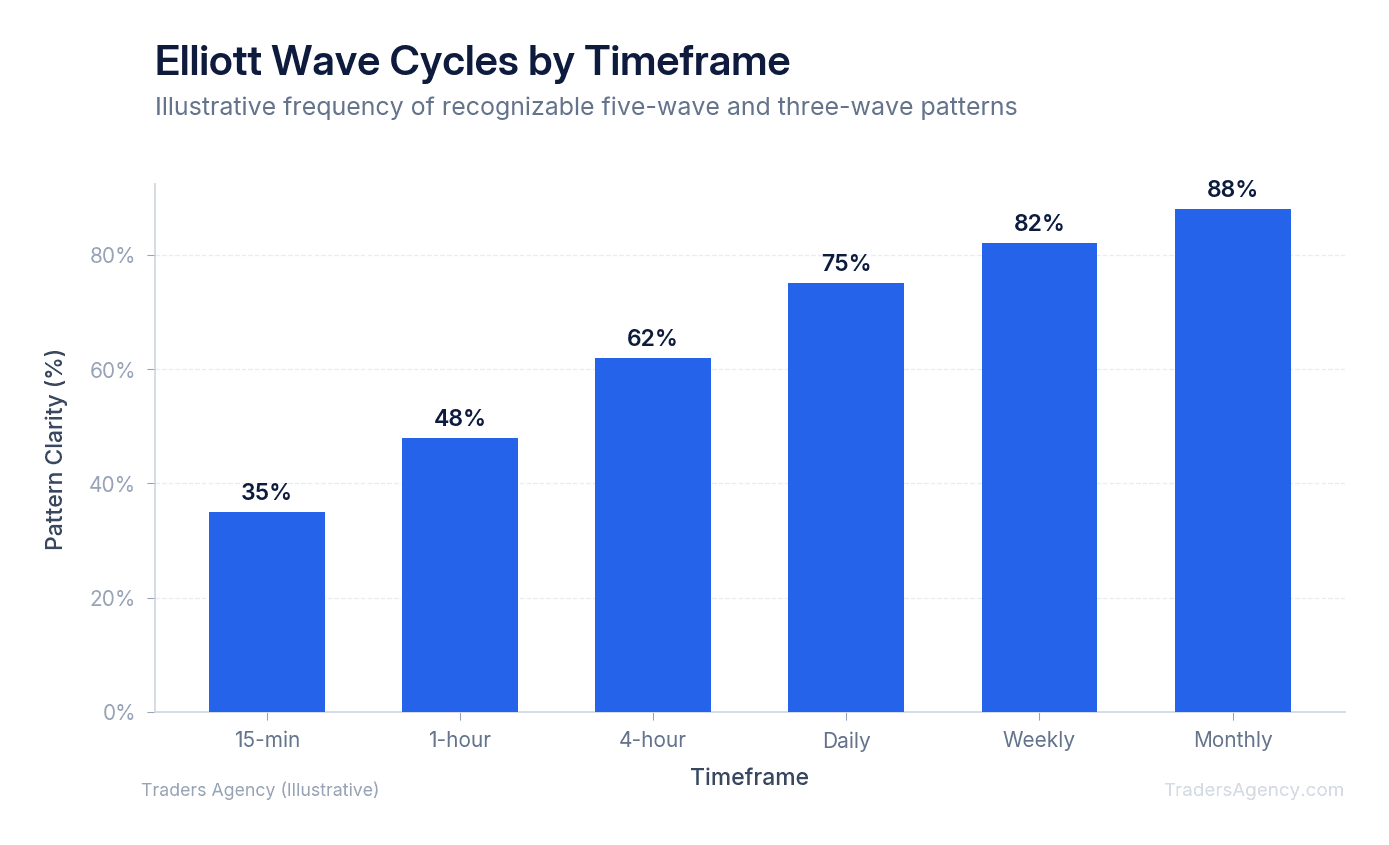
Because the market is fractal, smaller waves exist inside larger waves. A daily Wave 1 actually contains five smaller hourly sub-waves. A daily Wave 2 contains three smaller hourly sub-waves.
Here's the approach we use for multi-timeframe analysis:
- Start on the weekly timeframe to find the dominant trend direction.
- Drop down to the daily timeframe to count the specific impulse waves within that trend.
- Use the hourly chart to pinpoint your exact entry and exit prices.
Mixing up your timeframes will ruin your wave count. A minor corrective wave on a weekly chart will look like a massive impulse wave on a 15-minute chart. Always keep your primary timeframe clearly labeled on your screen to avoid getting lost in the noise.
Common Elliott Wave Mistakes to Avoid
The most common Elliott Wave mistakes include forcing a wave count in choppy markets, ignoring the three unbreakable rules of impulse waves, and failing to use stop losses. Many traders also struggle by not zooming out to higher timeframes to understand the broader market context before placing a trade.
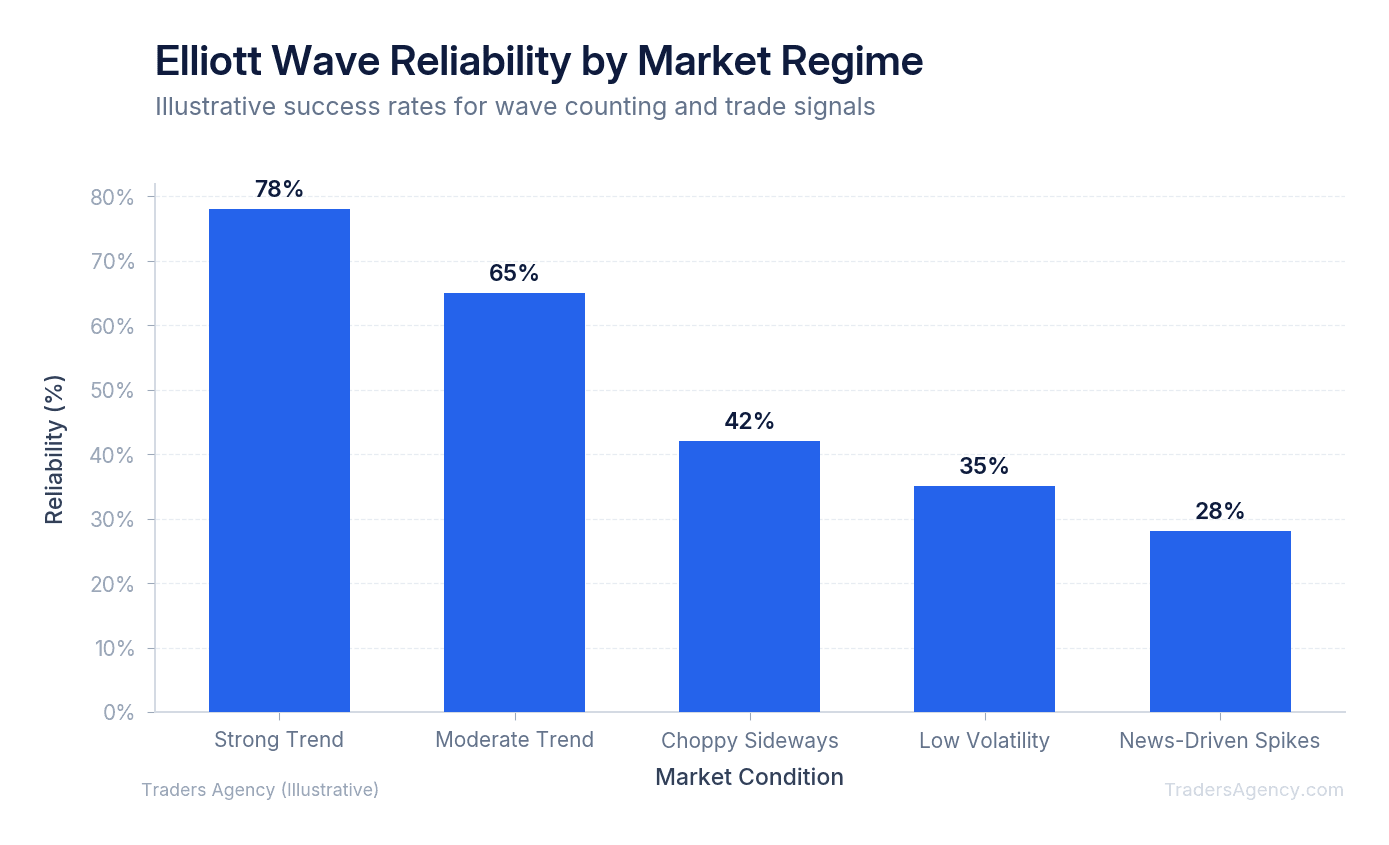
One massive error is trying to apply this theory to illiquid penny stocks or highly unpredictable cryptocurrency altcoins. The theory relies on mass human psychology. If a single large buyer can manipulate the price, the wave structure will immediately break down.
Another trap is downloading a generic Elliott Wave PDF guide and applying it without adapting to current market volatility. When the market is reacting to a sudden news event or an earnings report, technical patterns temporarily stop working. We teach our members to step aside during major economic announcements.
Watch Out: Confirmation bias is one of the biggest threats to your wave analysis. Traders will often redraw their wave counts mid-trade just to justify holding onto a losing position. If the price breaks your invalidation level, your count was wrong. Accept the small loss and move on to the next setup.
Does Elliott Wave Theory Actually Work?
Yes, Elliott Wave Theory works when applied to highly liquid, trending markets where mass psychology drives price action. However, it is not a crystal ball. The theory works best as a probabilistic framework combined with strict risk management and other technical indicators to confirm trade entries.
Traders constantly ask our team whether this approach still holds up in today's algorithmic markets. The answer is yes, because algorithms are programmed by humans and still react to standard support and resistance zones. The fractal nature of the market has not changed.
We prefer to combine wave counting with momentum indicators like the MACD or RSI. Here's why that combination is so powerful:
- Wave 3 almost always produces the highest MACD reading on the chart, confirming the strongest momentum phase.
- Wave 5 usually shows bearish divergence, meaning the price makes a higher high while the RSI makes a lower high. This divergence confirms the trend is exhausted.
To succeed with this method, you must practice strict position sizing. Never risk more than 1% to 2% of your total account capital on a single wave setup. If your wave count is wrong, your stop loss will protect you from a catastrophic drawdown.
This theory is a tool to help you read the market's current state. It tells you when to be aggressive during impulse waves and when to protect your capital during corrective waves. Master the basic rules, apply them to liquid markets, and always honor your risk parameters. You can learn more about the mathematical foundations of wave analysis through the CME Group's educational resources on technical analysis and market structure.
Want expert trading insights delivered daily?
Join thousands of traders who rely on Traders Agency for market analysis and trade ideas.
Join Traders AgencyKey Takeaways
- Markets move in a repeating eight-wave cycle: five waves in the direction of the primary trend, followed by a three-wave correction against it.
- The three main corrective patterns are zigzags, flats, and triangles, each with distinct structures that signal different levels of trend exhaustion.
- Fibonacci ratios are used alongside wave counts to set logical profit targets and identify high-probability entry zones within the wave structure.
- Timeframe selection matters: wave counts on higher timeframes carry more weight and help filter out noise on lower timeframes.
- Risk management is built into the method: a valid wave count comes with a defined invalidation level, which tells you exactly where to place your stop loss.
DISCLAIMER: Traders Agency does not offer financial advice. The information provided is for educational purposes only and should not be considered financial advice. Traders Agency is not responsible for any financial losses or consequences resulting from the use of the information provided. Trading carries inherent risks and may not be suitable for all individuals. You are advised to conduct your own research and seek personalized advice before making any investment decisions, recognizing the potential risks and rewards involved.
See more from Traders Agency on Google
Make us a preferred source and our market analysis will appear more prominently in your Google Search, Top Stories, and AI results.
Add to Preferred Sources