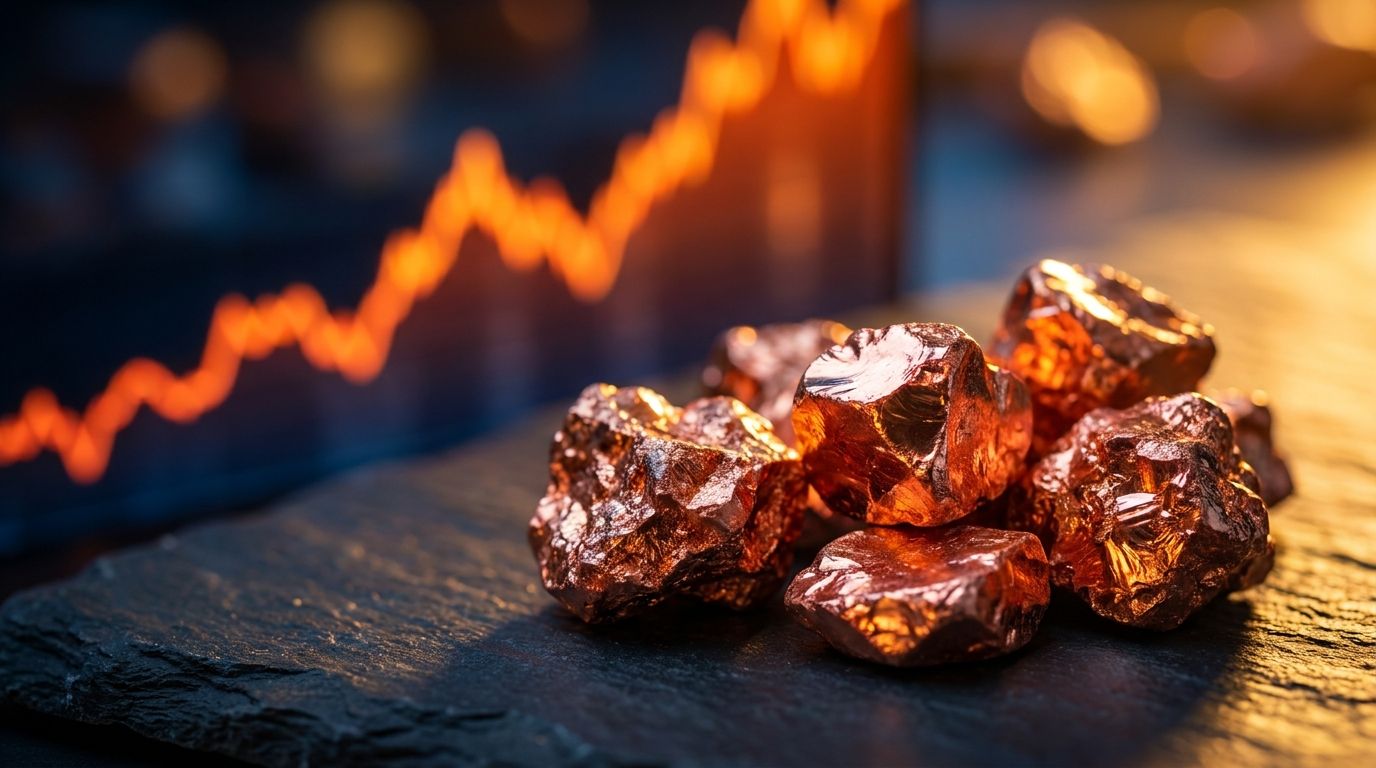

The commodity market is waking up, and I am getting new stock positions ready. We are looking at a group of assets setting up for what I believe will be huge moves in the coming months. If you are hunting for copper mining stocks to buy, now is the time to pay attention.
These names are preparing to break out. Some people think the copper market is short-term extended. I believe it is just getting started.
Here is exactly what the data shows and how I am positioning my own capital for the next major market move.
Is Copper Entering a New Multi-Year Super Cycle?
Bottom Line: The core argument is that copper is entering a multi-year super cycle with a realistic price target of $10 to $15 per pound, driven by structural supply and demand dynamics that mirror the 2002-2006 run. The most practical way to capture that move is through copper mining stocks, where operational leverage turns a commodity rally into outsized equity gains. Risk management via stops is treated as non-negotiable, not an afterthought.
Copper experienced a lost two-decade period of consolidation and absorbing supply. We are now entering what I believe will be a two-to-three-year super cycle higher. I see a very realistic chance of copper hitting $10 to $15 per pound in just the next couple of years.
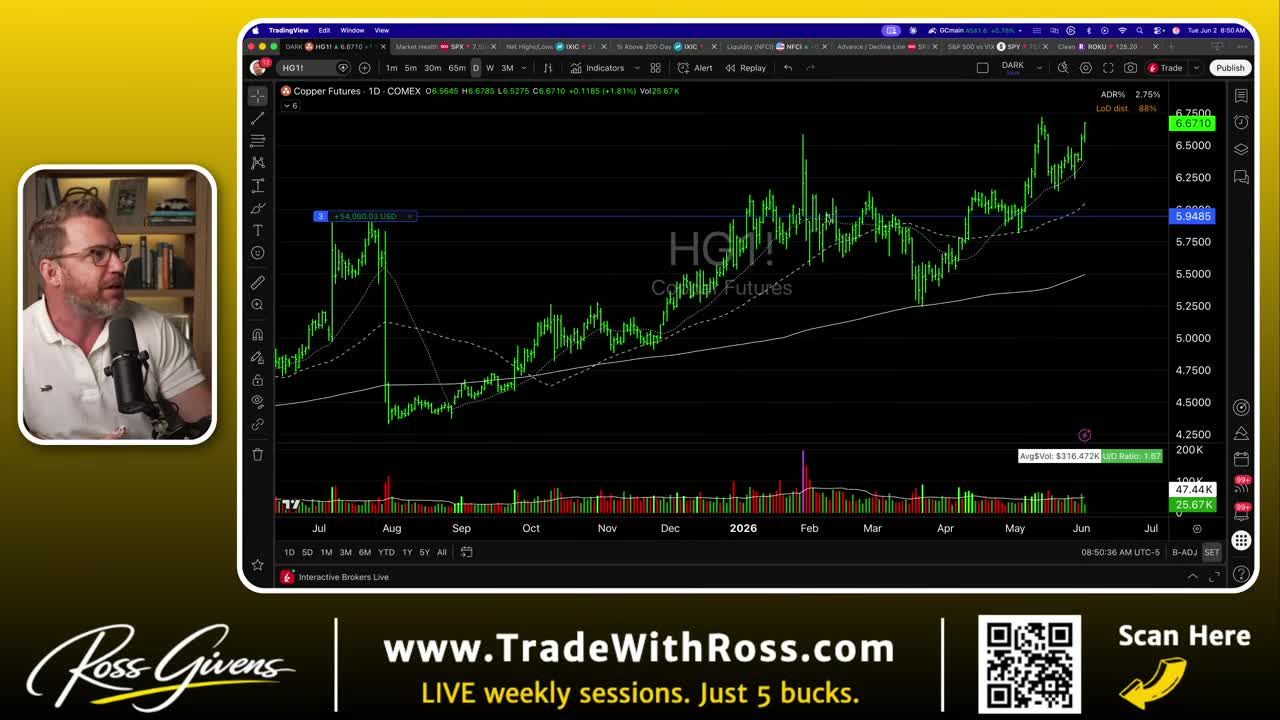
Over the last, call it, year, copper has gone from a low of about $4.5 a pound up to $6.67 per pound. That is a massive run, but it is only the beginning of a much larger trend.
To understand where we are going, you have to look at the last big super cycle. From about 2002 to 2006, copper ran from about 60 cents per pound to $4 per pound. That was a 700% move. After that massive climb, the market went dormant. It experienced a lost two-decade period where price action just shallowed and consolidated.
That long period of absorbing supply is exactly what builds the foundation for the next explosive move.
Copper's Chart Mirrors Gold
Step out to a weekly chart of copper in logarithmic scale and you see a pattern almost identical to what gold showed two years ago.
This is simply how commodities move. Whether you are looking at gold, steel, copper, or wheat, they do not move for a couple of weeks like stocks. Commodities follow a very specific behavioral pattern:
- They remain dormant for years, sometimes decades
- They build massive bases of consolidation
- They break out and go on multi-year runs higher
If you can catch one of those big trends, you can make an absolute fortune. That is exactly what I am trying to do on copper right now.
How Do You Play Copper Without Trading Futures?
I am currently trading this trend with copper futures. I hold three copper futures contracts. I bought two of them in early 2026, which was a poorly timed buy to hold through the consolidation. Later, we had a really clean breakout setup as the price broke through $6.15 a pound. I added another one at $6.20.
Another way to play this without buying copper $25,000 at a time is with copper mining stocks. The Copper Miners ETF (COPX) chart shows clear signs of a shallowing breakout pattern. It is coming in, shallowing, tightening, and consolidating. This is typically what you see before breakout moves higher. With physical copper booming and the copper mining ETF setting up, these miners are likely to make massive moves going forward.
The Power of Operational Leverage
Copper miners are a leveraged bet on physical copper. This is called operational leverage, and it is why mining stocks tend to move in a multiple of the underlying commodity.
That is why these are the commodity stocks to watch right now.
Get an entire year of live weekly mentoring sessions, my newsletter, indicators, bonus reports, tons more. Click the link and I'll see you in the next live session.
Join my Black Ops Trading ClubWhich Copper Mining Stocks Should You Buy Right Now?
I am targeting specific names that show massive demand and clean accumulation. These are the exact setups I am trading.
1. Southern Copper Corporation (SCCO)
This is a wonderful company with a super clean chart. We saw a big run higher showing massive demand. The Iran situation triggered some selling, but that pullback actually revealed the accumulation underneath. Supply is being sucked out of this stock.
The pullbacks are getting shallower and shallower. We are now breaking through the big resistance level at $195 to $200 a share.
2. Hudbay Minerals (HBM)
If you want the high momentum play, this is it. We actually bought this back in December in my Alpha stock service. It is as textbook as it gets: a clean breakout, a perfect retest, a second shallowing move, and now it is just ripping up the right side.
This is a fast-moving stock. The ADR, which stands for the Average Daily Range (how much it typically moves from high to low each day), is 5%. That is significant.
3. Freeport-McMoRan (FCX)
Freeport-McMoRan is the big dog in the copper space, the biggest US copper miner. The chart shows the same structure and shallowing pattern setting up, and it is still pushing to the top side.
Reading Supply and Demand
When you are hunting for copper mining stocks to buy that outperform the market, you have to look at the supply and demand mechanics on the chart.
You want to see accumulation. You want to see pullbacks getting shallower over time. When a stock experiences a negative news event like the Iran situation and the selling is quickly absorbed, that tells you buyers are stepping in. That shallowing action means supply is drying up right below major resistance levels.
Why These Miners Can Outperform
I believe these copper miners are setting up to be market-outperforming stocks. You have the physical commodity breaking out of a two-decade consolidation. You have the miners offering operational leverage that multiplies those commodity gains. And you have clean, textbook chart patterns breaking through heavy resistance.
Southern Copper is a slightly pricier stock but offers a great setup with a super clean chart. Hudbay Minerals gives you pure momentum. Freeport-McMoRan gives you the biggest US player in the space.
Positioning for the Copper Boom
The data is pointing to a massive shift in the commodities market. We are watching the early stages of a move that mirrors the massive gold run from two years ago.
If copper hits my target of $10 to $15 per pound, the profit margins for these mining companies will explode.
You do not need to trade futures contracts to take advantage of this. By targeting the right copper mining stocks to buy, you can position yourself for the operational leverage that makes these multi-year super cycles so profitable. Watch the resistance levels, manage your risk with strict stops, and let the long-term trend work in your favor.
Get an entire year of live weekly mentoring sessions, my newsletter, indicators, bonus reports, tons more. Click the link and I'll see you in the next live session.
Key Takeaways
- Copper has already run from $4.50 to $6.67 per pound over the past year, but the thesis is that this is early in a multi-year super cycle, not a late-stage move.
- The price target for copper is $10 to $15 per pound within the next couple of years, which would represent a move comparable to the 2002-2006 super cycle that produced a 700% gain from 60 cents to $4 per pound.
- The previous copper super cycle ran roughly from 2002 to 2006, followed by nearly two decades of consolidation. The current setup is framed as the beginning of the next major expansion phase.
- Copper mining stocks are the preferred vehicle over futures contracts because operational leverage amplifies profit margins as the underlying commodity price rises.
- Strict stop-loss discipline is emphasized alongside the bullish thesis, with resistance levels flagged as key checkpoints for managing position risk.
DISCLAIMER: Traders Agency does not offer financial advice. The information provided is for educational purposes only and should not be considered financial advice. Traders Agency is not responsible for any financial losses or consequences resulting from the use of the information provided. Trading carries inherent risks and may not be suitable for all individuals. You are advised to conduct your own research and seek personalized advice before making any investment decisions, recognizing the potential risks and rewards involved.
See more from Traders Agency on Google
Make us a preferred source and our market analysis will appear more prominently in your Google Search, Top Stories, and AI results.
Add to Preferred Sources