
You open your trading platform, see thousands of blinking red and green numbers, and feel instantly overwhelmed. We see this happen to new traders all the time. With over 8,000 stocks trading on US exchanges alone, trying to watch everything means you end up seeing nothing. A focused, well-built watchlist changes everything, and we're going to show you exactly how to create one from scratch.
What Is a Watchlist and Why Does It Matter?
Bottom Line: A well-built watchlist is less about finding more stocks and more about seeing fewer, better ones. The traders who treat their watchlist as a living document, adding selectively and cutting ruthlessly, are the ones who avoid impulsive trades and stay ready when real setups appear. Discipline in list management is what separates consistent traders from those who are always chasing the market.
A watchlist is a customized list of financial instruments that a trader monitors for potential trading opportunities. Learning exactly how to set up a watchlist is the first step to cutting through market noise. It allows you to focus only on the specific setups that match your personal trading strategy.
Think of it like a grocery list for traders. If you go to the supermarket without a list, you wander the aisles, waste time, and buy things you don't need. If you trade without a focused list, you end up chasing random price spikes and taking impulsive trades.
Key Concept: A watchlist works as a personalized filter for the financial markets. It tracks specific ticker symbols in real time, displaying current prices, volume, and percentage changes in one consolidated view. This tool prevents you from missing entry signals on stocks you actually want to trade.
Whether you want a free stock watchlist on a basic web portal or a highly customized layout on a professional brokerage platform, the core function remains the same. You're isolating a small group of assets to study their behavior closely. Maintaining a focused list of securities helps you avoid emotional decisions driven by sudden market hype. Our team recommends treating your watchlist like a VIP club: only the best candidates get past the velvet rope.
How Do You Set Up a Watchlist Step by Step?
To set up a watchlist, open your trading platform and locate the quotes or watchlist tab. From there, you'll build out a focused tracking system in just a few minutes. We teach our members to start simple. Many beginners start by using basic tools like Google Finance, which is fine for end-of-day tracking. However, a dedicated trading platform provides much better real-time data.
If you're learning how to add a stock to a watchlist on your iPhone, the process usually involves tapping a plus icon in the top right corner and searching for the company name. Most mobile trading apps follow a nearly identical workflow.
Here are the exact steps we use when building a new list:
- Open your platform: Log into your broker or charting software.
- Create a new list: Select "New Watchlist" and name it something specific, like "Tech Breakouts."
- Add symbols: Enter the ticker symbols for the assets you want to monitor, such as AAPL or MSFT.
- Adjust columns: Select the specific metrics you need to see, like the 52-week high or average daily volume.
If you're trading currencies, the mechanics are identical, but you'll track pairs like EUR/USD instead of corporate tickers. The same organizational principles apply across every asset class.
How Many Stocks Should You Track at Once?
You should track between 10 and 20 stocks at any given time. Tracking fewer than 10 might limit your trading opportunities, while monitoring more than 20 often leads to analysis paralysis. A smaller, focused list allows you to memorize price action patterns for those specific assets.
We prefer to keep our lists incredibly tight. When you watch a stock like TSLA every single day, you start to understand its unique rhythm and volatility. You learn how it reacts at the open and how it behaves near major support levels. If you watch 100 stocks, you understand none of them.
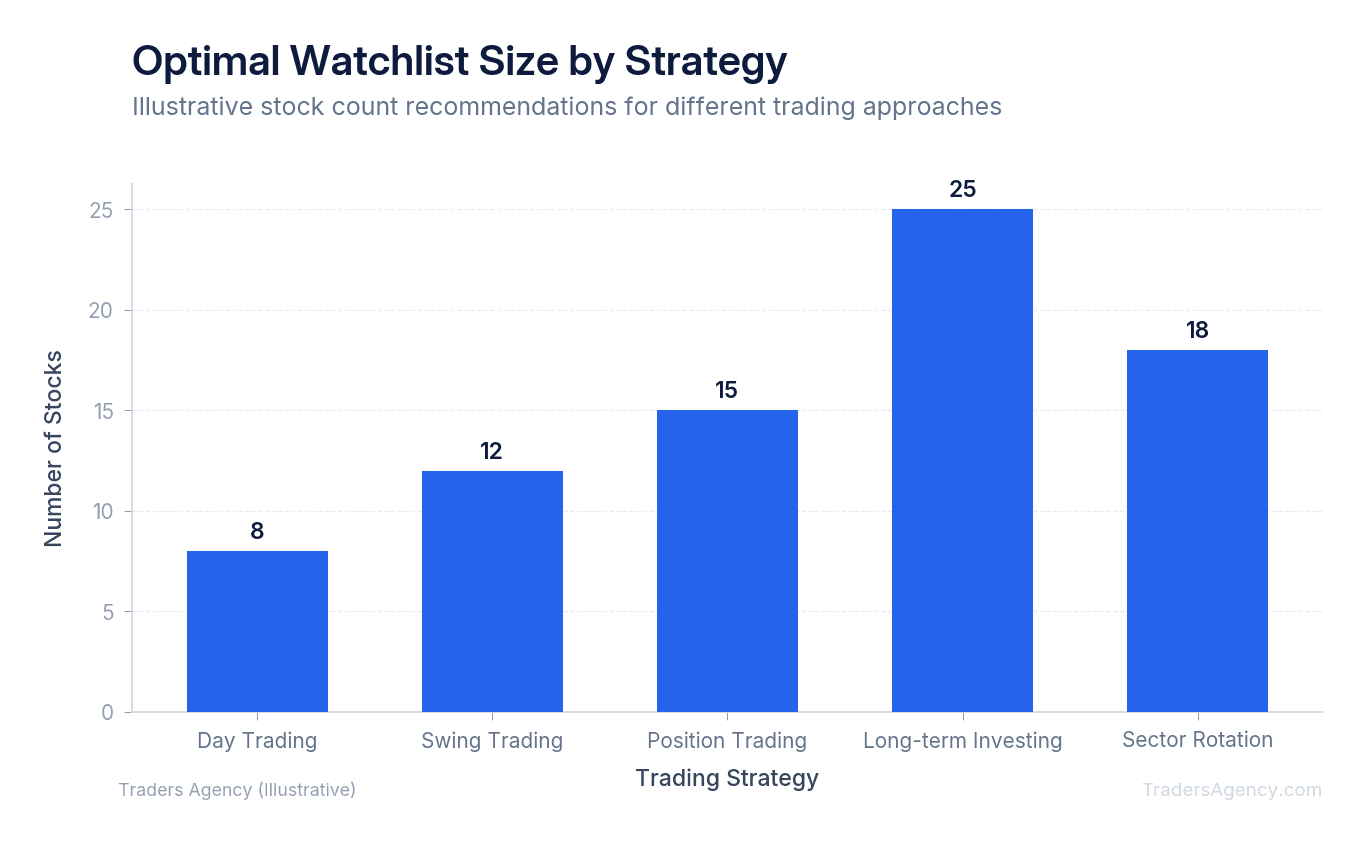
| Trading Style | Recommended List Size | Typical Timeframe |
|---|---|---|
| Day Trading | 3 to 5 stocks | 1-minute to 5-minute charts |
| Swing Trading | 15 to 20 stocks | Daily charts |
| Position Trading | 20 to 30 stocks | Weekly charts |
Watch Out: A bloated watchlist is a trader's worst enemy. If you're constantly scrolling through dozens of tickers, you're burning mental energy that should be spent on execution. Focus on quality setups over sheer quantity to protect your mental capital.
Organizing Your Watchlist by Sector, Strategy, or Timeframe
Organizing your watchlist by sector, strategy, or timeframe helps you quickly identify where money is flowing in the market. Grouping stocks into specific categories allows you to compare relative strength and spot industry-wide trends before they become obvious to the crowd.
We recommend creating multiple smaller lists rather than one massive list. This keeps your trading screen clean and your mind focused on specific goals.
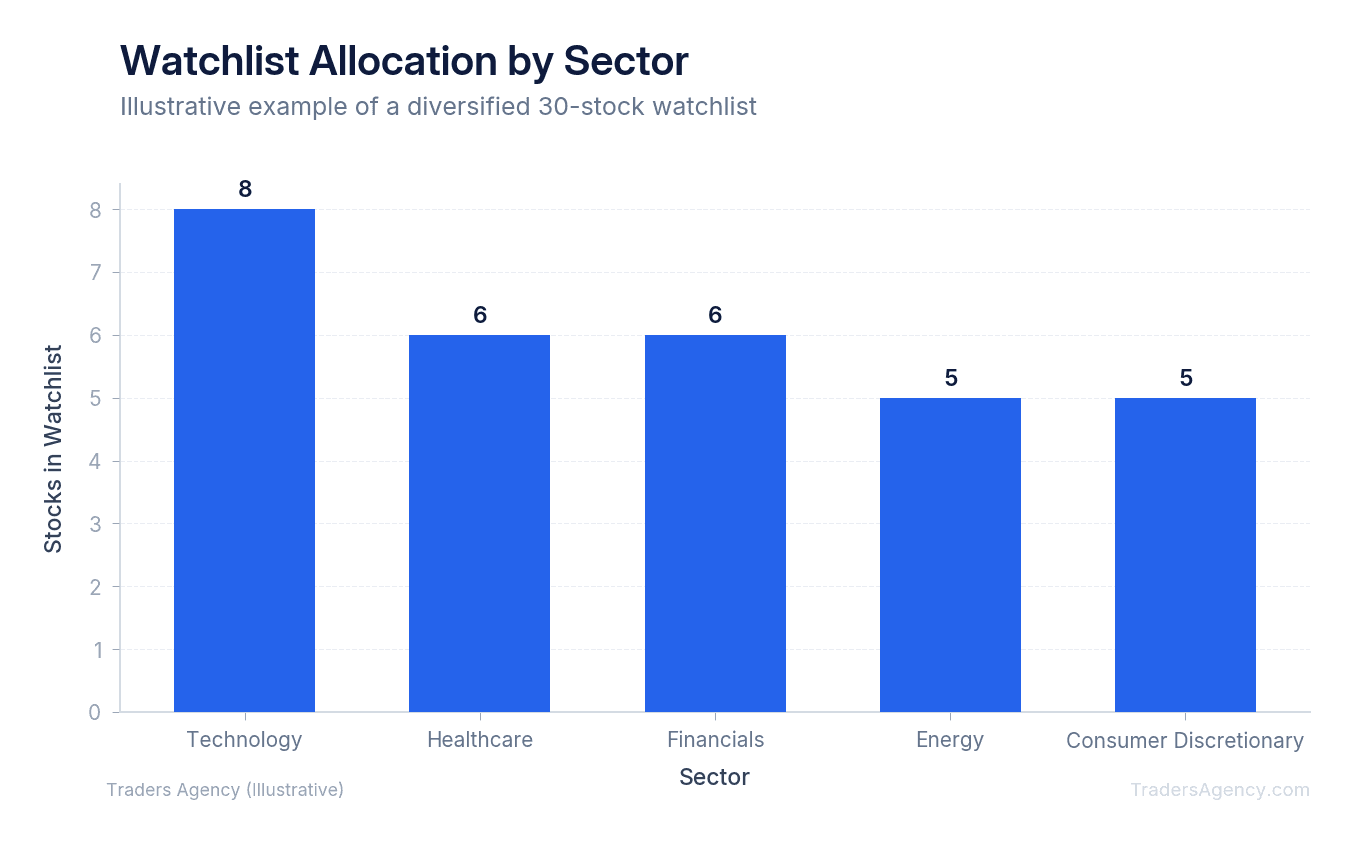
Here's how we teach our members to categorize their lists:
- By Sector: Create a list purely for semiconductor stocks like NVDA and AMD. If the entire sector is glowing green, you know there's broad buying pressure.
- By Strategy: Maintain a "Gap and Go" list for stocks showing high pre-market volume. Keep a separate "Dip Buy" list for stocks approaching major moving averages.
- By Timeframe: Separate your day trading targets from your long-term dividend holds. Mixing a fast-moving penny stock with a slow-moving utility company creates unnecessary confusion.
When you organize your lists logically, finding the right trade takes seconds instead of minutes.
Want expert trading insights delivered daily?
Join thousands of traders who rely on Traders Agency for market analysis and trade ideas.
Join Traders AgencyWhat Columns and Data Points Should You Display on a Watchlist?
The key columns to display on your watchlist include the last price, net change, percentage change, and relative volume. These specific data points tell you immediately if a stock is moving abnormally compared to its historical average, which is exactly what active traders look for.
Most platforms default to showing the bid, ask, and last price. We recommend customizing your columns to show data that actually impacts your trading decisions.
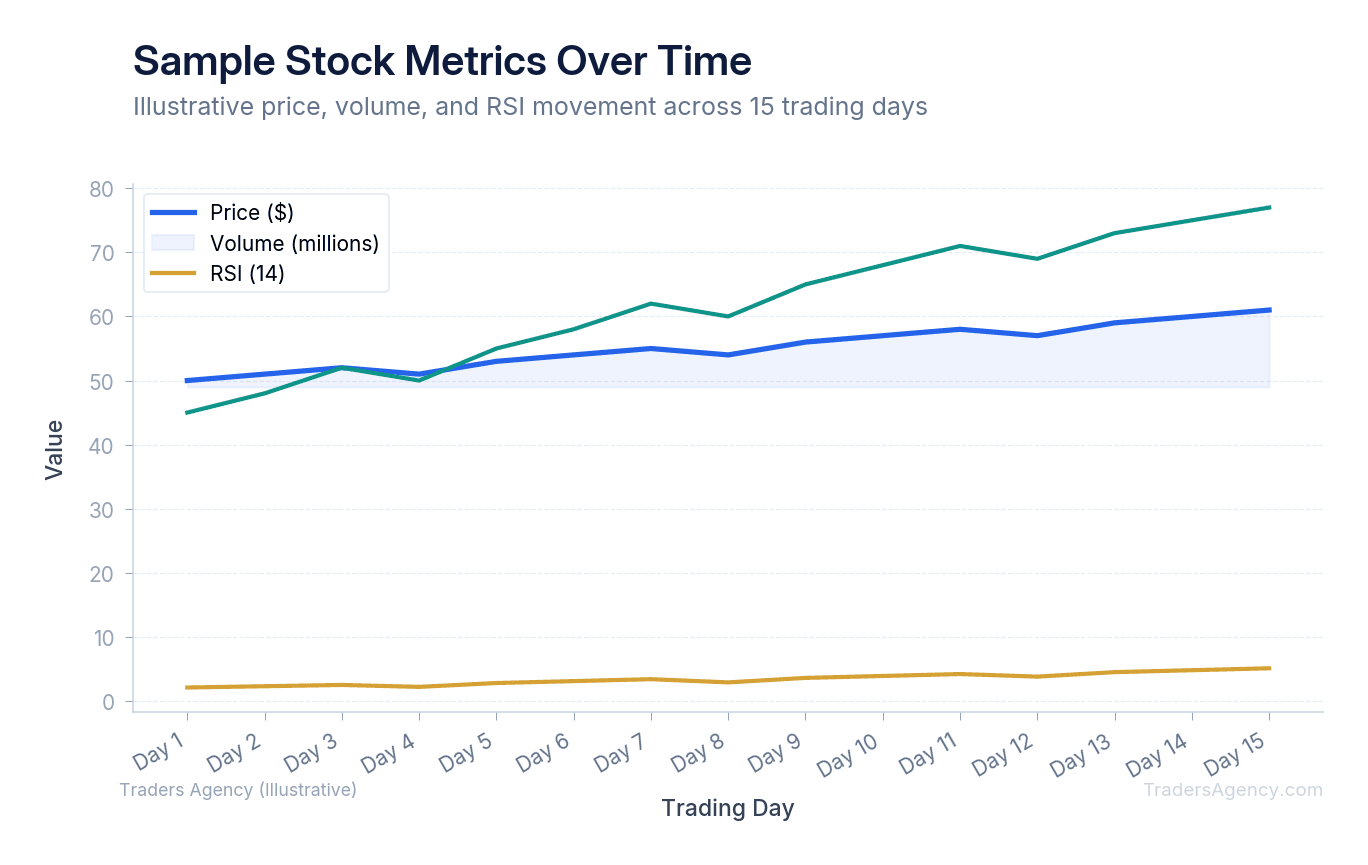
Here are the specific metrics we include on our daily tracking screens:
| Metric | What It Tells You | Our Preferred Threshold |
|---|---|---|
| Relative Volume (RVOL) | Whether a stock is trading heavier than usual | At least 1.5x normal volume |
| Average True Range (ATR) | How much a stock typically moves in a single day | Higher ATR = more profit potential (e.g., $5.00 vs. $0.50) |
| Spread | The difference between the bid and ask price | No wider than $0.10 for short-term trades |
| Volume | Total shares traded for the day | At least 1 million shares daily |
By displaying these specific columns, you can glance at your screen and immediately disqualify weak candidates. Every column should earn its place on your screen. If a data point doesn't directly influence your buy or sell decision, remove it.
Using Scanning Tools to Populate Your Watchlist
Scanning tools populate your watchlist by automatically filtering the entire stock market based on your specific technical or fundamental criteria. Instead of manually searching thousands of charts, a scanner delivers a refined list of candidates that match your exact trade setup requirements.
You need a systematic way to find new candidates. We use market scanners to do the heavy lifting every morning before the opening bell. Here's a concrete example of how this works.
Assume you want to trade momentum breakouts. You would set your scanner to find stocks matching these criteria:
- Price between $10 and $50
- Trading at least 1 million shares of volume
- Currently sitting within 2% of their 52-week high
The scanner might return 15 results. You then review those 15 charts manually, looking for clean price action and clear support levels. Finally, you pick the best 3 or 4 stocks from that scan and add them to your primary daily watchlist. This process ensures that every stock on your screen has a mathematical reason for being there. You're no longer guessing or relying on social media rumors.
What Triggers a Watchlist Alert?
A watchlist alert is triggered when a specific stock meets a pre-defined condition you've set. You can configure alerts to notify you when an asset crosses a certain price level, experiences a surge in trading volume, or hits a specific technical indicator value.
Alerts keep you from staring at the screen all day. We teach our members to set price alerts just below their planned entry points. This gives you time to open the chart and prepare your order ticket before pulling the trigger.
Key Concept: If you want to buy XYZ stock when it breaks above $150.00, set a price alert at $149.50. When the alert triggers, pull up the chart, verify the setup is still valid, and then execute the trade. This approach keeps you prepared without requiring constant screen time.
You can also set volume alerts. If a stock usually trades 100,000 shares an hour, you can set an alert to trigger if it trades 500,000 shares in the first ten minutes of the day. This instantly notifies you of unusual market activity that could signal a tradeable move.
How Should You Manage and Update Your Watchlist Over Time?
To manage a watchlist effectively, you must conduct a weekly review to remove stocks that no longer meet your trading criteria. Pruning your list keeps your focus sharp and prevents outdated trade ideas from cluttering your screen and distracting you from fresh opportunities.
A watchlist is a living document. It requires regular maintenance to remain useful. Our team recommends a strict Friday afternoon or Sunday evening routine to prepare for the week ahead.
Here's the exact step-by-step process we use to maintain our lists:
- Review every chart: Look at the daily timeframe for every ticker currently on your list.
- Delete broken setups: If a stock fell through your support level at $45.00 and the trend is dead, remove it immediately. Don't keep it around out of hope.
- Run new scans: Use your scanning tools to find fresh candidates that formed good setups over the past week.
- Promote top candidates: Move the 3 to 5 best-looking setups to a primary "Focus List" for Monday morning.
Watch Out: Proper risk management starts before you ever enter a trade. Never force a trade just because a stock happens to be on your list. If market conditions are poor and none of your tracked stocks are triggering entry signals, the safest action is to sit on your hands and protect your capital.
Learning how to set up a watchlist is an ongoing process of refinement. Start with a small list of high-quality names, keep your columns focused on actionable data, and ruthlessly delete stocks that break their technical trends. The traders who consistently maintain their lists are the ones who consistently find the best trades. That discipline separates professionals from amateurs.
For more guidance on building a structured approach to the markets, the SEC's investor education resources offer a solid foundation on maintaining disciplined investment practices.
Want expert trading insights delivered daily?
Join thousands of traders who rely on Traders Agency for market analysis and trade ideas.
Join Traders AgencyKey Takeaways
- With over 8,000 stocks trading on US exchanges alone, a focused watchlist is the only practical way to identify real setups without getting lost in market noise.
- A watchlist functions as a real-time filter, displaying current prices, volume, and percentage changes for a curated set of ticker symbols in one consolidated view.
- Organizing stocks by sector, strategy, or timeframe lets you match each name to a specific trading context rather than treating all positions the same way.
- When none of your tracked stocks are triggering entry signals, the correct move is to stay out of the market entirely and protect your capital.
- Maintaining a watchlist is an active habit: delete stocks that break their technical trends and keep the list trimmed to high-quality names that match your actual strategy.
DISCLAIMER: Traders Agency does not offer financial advice. The information provided is for educational purposes only and should not be considered financial advice. Traders Agency is not responsible for any financial losses or consequences resulting from the use of the information provided. Trading carries inherent risks and may not be suitable for all individuals. You are advised to conduct your own research and seek personalized advice before making any investment decisions, recognizing the potential risks and rewards involved.
See more from Traders Agency on Google
Make us a preferred source and our market analysis will appear more prominently in your Google Search, Top Stories, and AI results.
Add to Preferred Sources



