
Fibonacci retracement levels are horizontal lines on a price chart that indicate where potential support and resistance are likely to occur. They're based on mathematical ratios, and we use them every day to identify precise entry points during market pullbacks. If you've ever watched a stock surge higher, pull back slightly, and then rocket up again, you know the frustration: you want to buy the dip, but you don't know exactly where the price will stop falling and reverse. Buy too early and you sit through painful losses. Wait too long and you miss the trade entirely. In this guide, we'll walk you through exactly how our team trades these pullbacks. By the end, you'll know how to draw these lines, where to place your entries, and how to set profit targets using real chart scenarios.
What Are Fibonacci Retracement Levels?
Bottom Line: Fibonacci retracement levels give traders a structured, math-based framework for identifying where pullbacks are likely to stall and reverse, turning the frustrating 'buy the dip' guessing game into a repeatable process. The edge comes not from the levels alone, but from combining them with confirmation signals and strict position sizing. Master the discipline around the tool, and the tool becomes genuinely useful.
Fibonacci retracement levels are technical analysis tools that divide the vertical distance between a major price high and low into specific mathematical percentages. These percentage lines act as hidden support and resistance zones, helping traders predict where a correcting asset will pause before resuming its original trend direction.
The math behind this tool comes from the Fibonacci sequence, a series of numbers where each number is the sum of the two preceding ones (0, 1, 1, 2, 3, 5, 8, 13, and so on). When you divide these numbers by one another, you get specific ratios. The sequence was introduced to Western mathematics in 1202. While it originally appeared in a problem about rabbit population growth, financial analysts eventually realized its power in charting. Today, it's a standard feature on every major trading platform.
Why do these levels work in financial markets? The answer comes down to human psychology and herd behavior. Traders naturally look for discounts during an uptrend. When a stock pulls back, buyers step in at predictable percentage drops. Think of a trending stock like a stretched rubber band. When the market stretches the price up to a new high, it eventually snaps back to relieve the tension. The Fibonacci sequence simply measures how far that rubber band is likely to snap back before stretching again.
Key Concept: Fibonacci retracement levels map the mathematical relationship between a price swing's high and low, creating horizontal zones where buyers and sellers are most likely to act. These ratios appear repeatedly across nature and financial markets, giving us a structured framework for buying dips.
We use these ratios to bring order to what looks like random price action. They give us a repeatable, structured approach to entering trades during pullbacks. You can learn more about how these mathematical ratios apply to financial instruments on the CME Group education portal.
What Are the Best Fibonacci Retracement Levels?
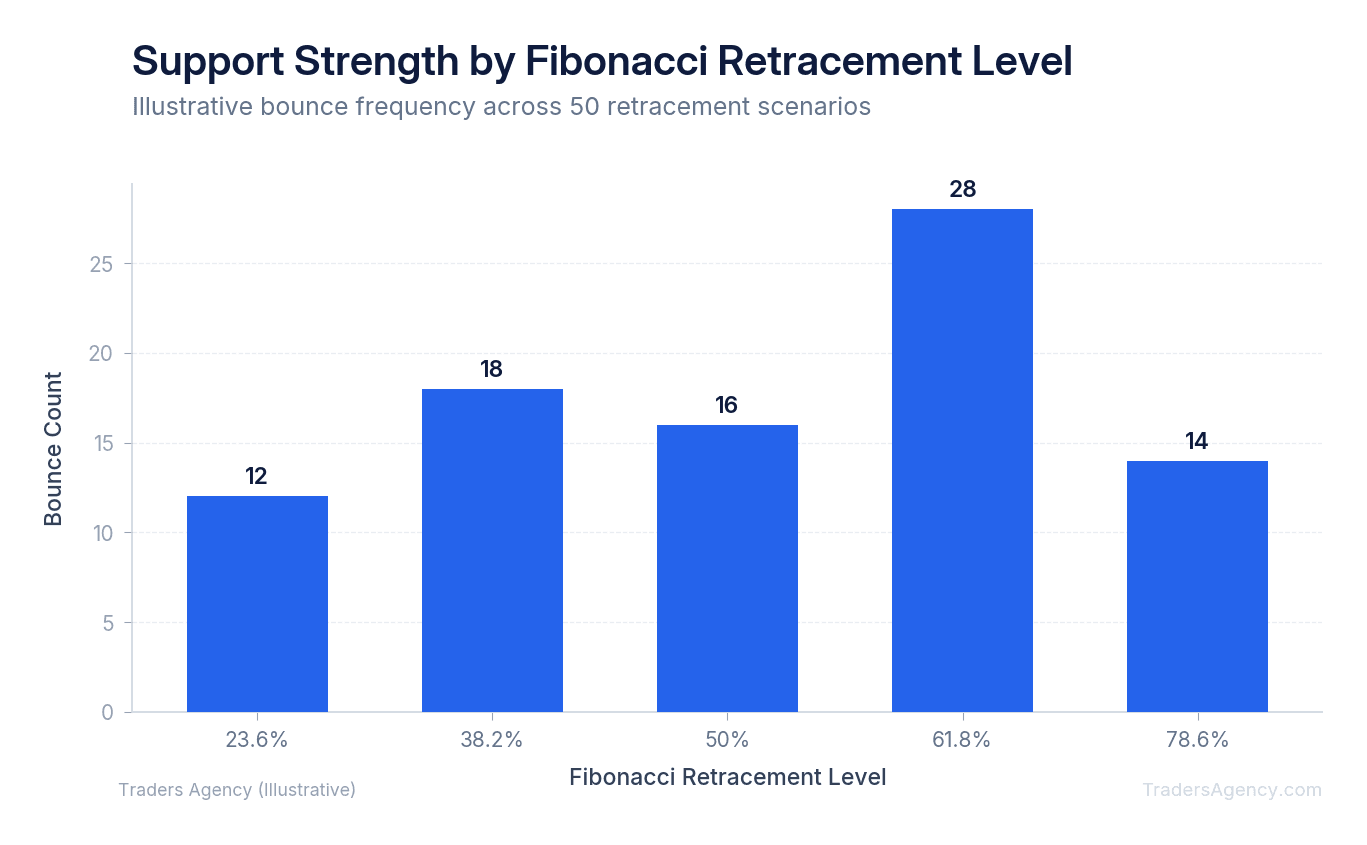
The best Fibonacci retracement levels for trading are 23.6%, 38.2%, 50%, 61.8%, and 78.6%. The 61.8% level is widely considered the most reliable support zone, often referred to as the golden ratio, while the 50% level represents a standard halfway pullback point. (Note: 50% is not technically derived from the Fibonacci sequence itself but is included on most platforms because of the strong market tendency to retrace half of a prior move.)
We teach our members to watch all five of these zones during a correction. However, they don't all carry the same weight. You need to interpret each line based on the strength of the current trend.
| Retracement Level | What It Signals | When It Holds |
|---|---|---|
| 23.6% | Shallow pullback, extreme buyer eagerness | High-momentum trends (e.g., aggressive tech rallies) |
| 38.2% | Standard, healthy correction | Strong uptrends with steady institutional buying |
| 50.0% | Halfway pullback, shakes out weak hands | Most common bounce zone for swing trades |
| 61.8% | The "golden ratio," the ultimate line in the sand | Last strong support before trend breakdown |
| 78.6% | Final defense, deep retracement | Often signals a complete trend reversal if broken |
The 23.6% level usually only holds during extremely aggressive trends. If a stock only pulls back this far, buyers are extremely eager to get in. We see this often in high-momentum tech stocks.
The 38.2% and 50% zones represent standard, healthy corrections. We frequently see institutional buyers step in at the halfway mark. A 50% pullback shakes out the weak hands without damaging the broader uptrend.
The 61.8% line is the ultimate line in the sand. If the price breaks significantly below this golden ratio, the original trend is likely broken. The 78.6% level is the final defense, but a drop to this depth usually signals a complete trend reversal.
How Do You Draw Fibonacci Retracement Levels Correctly?
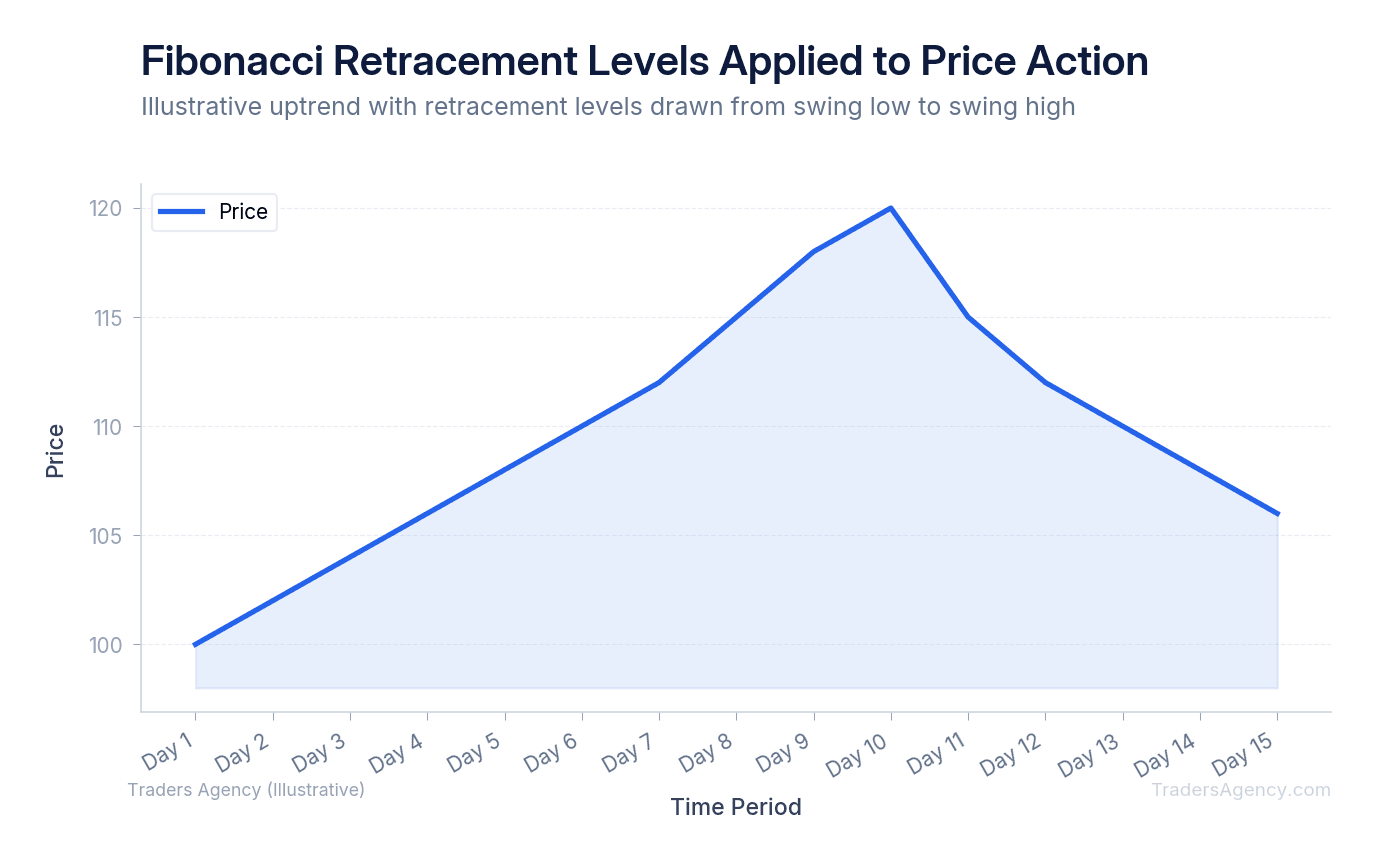
Drawing these lines requires you to identify the correct starting and ending points. If you pick the wrong peaks and valleys, your support zones will be completely inaccurate. Your trading platform will do the math for you, but you must provide the correct anchors.
Here is the exact process our team uses to set up the chart:
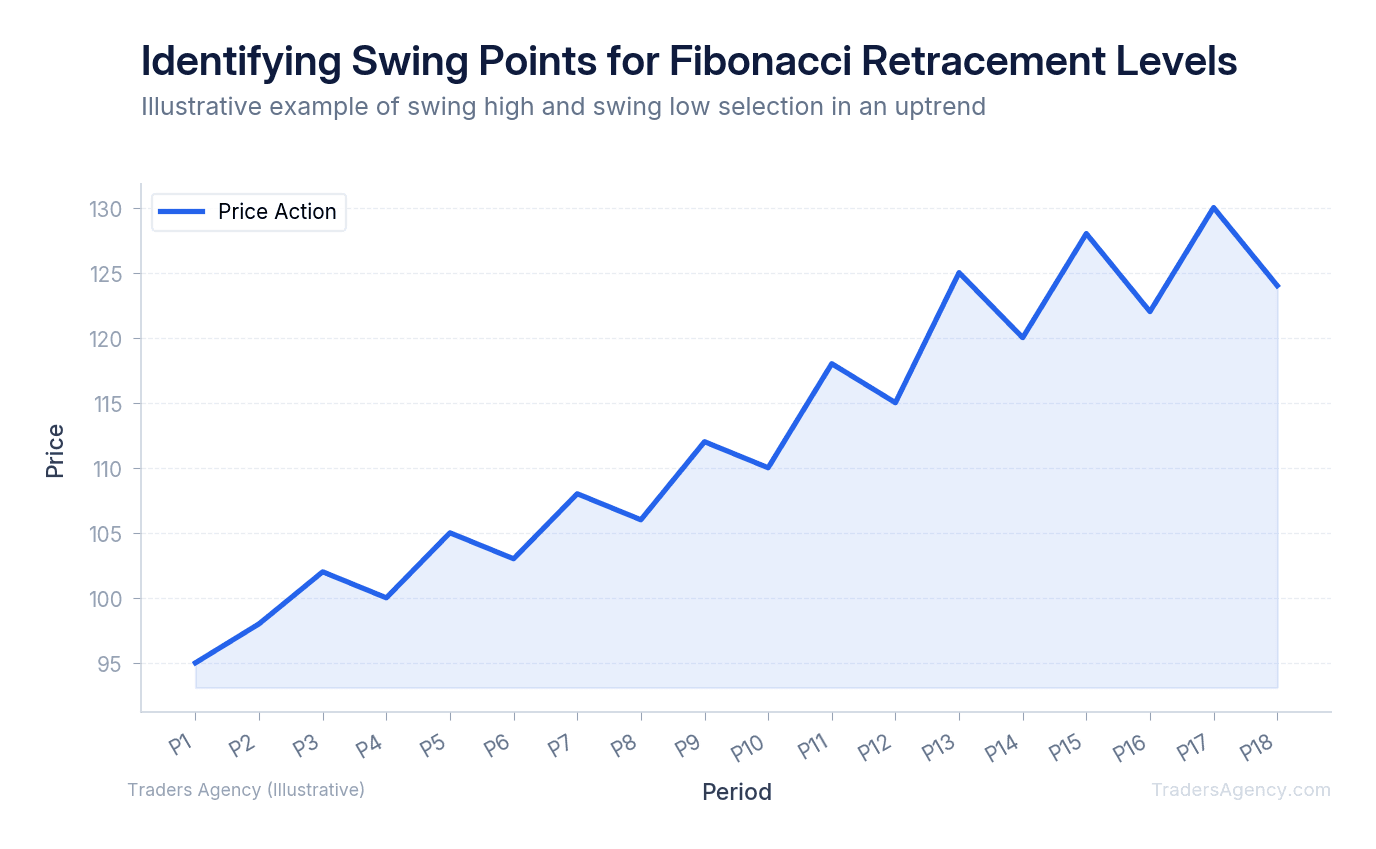
- Identify the Swing High and Swing Low: First, find a completed price move. For an uptrend, locate the absolute lowest point before the rally started. This is your swing low. Next, find the absolute highest point where the rally stopped and the pullback began. This is your swing high. You must use the extreme wicks of the candles, not just the closing prices. The wicks represent the true extremes of market emotion.
- Connect the Points: Select the Fibonacci tool in your charting software. Click exactly on the swing low and drag your cursor up to the swing high. When short selling, the psychology is flipped. You're looking for a stock in a downtrend to bounce upward into a resistance level. You draw from the highest peak down to the lowest valley. The retracement lines then act as ceilings where you can enter short positions.
- Project the Levels Forward: Once you connect the two points, your software will automatically draw the horizontal percentage lines. Extend these lines to the right side of your chart. These extended lines are your action zones. Watch how the price behaves as it drops into these specific areas. Do not place trades blindly. Wait for the price to actually interact with the lines.
Watch Out: Using the wrong anchor points is the most common mistake we see. Always use the extreme candle wicks for your swing high and swing low, not the candle bodies. Incorrect anchors will place every retracement level in the wrong spot, leading to poorly timed entries.
How Do You Use Fibonacci Retracement Levels?
You use Fibonacci retracement levels by waiting for the price to drop into a specific percentage zone and then looking for a bullish reversal signal before buying. Traders place their entry orders near the retracement line and set their stop-loss orders just below the next deepest percentage level.
Here's a specific, concrete example using a hypothetical trade on Apple (AAPL).
Assume AAPL rallies from a swing low of $150.00 to a swing high of $170.00. That's a $20.00 upward move. The stock peaks at $170.00 and starts to pull back. We draw our tool from $150.00 to $170.00. We want to buy the dip, but we need a specific entry point to minimize our risk.
| Parameter | Value |
|---|---|
| Stock | AAPL |
| Swing Low | $150.00 |
| Swing High | $170.00 |
| Total Move | $20.00 |
| 50% Retracement Level | $160.00 |
| 61.8% Retracement Level | $157.64 |
| Entry Price | $160.50 (after bullish hammer confirmation) |
| Stop-Loss | $157.00 (below the 61.8% golden ratio) |
The 50% retracement level sits exactly at $160.00. We watch the price fall to $160.00 and form a bullish hammer candlestick. This candlestick tells us that buyers are actively defending the halfway point. We execute a buy order at $160.50. We place our stop-loss at $157.00, which is safely below the 61.8% level of $157.64. If the price drops below that golden ratio, our trade thesis is wrong. We accept a small loss and exit the position.
Want expert trading insights delivered daily?
Join thousands of traders who rely on Traders Agency for market analysis and trade ideas.
Join Traders AgencyCombining Fibonacci Retracement With Other Indicators
Trading based solely on one tool is a quick way to lose money. We prefer to look for confluence, which happens when multiple technical indicators point to the exact same trading decision.
A Fibonacci line by itself is just a mathematical theory. When it lines up with other market structures, it becomes a high-probability trade setup. We never trade a retracement line in isolation.
Here are the tools we combine with retracements:
- Moving Averages: If the 50-day moving average aligns perfectly with the 61.8% retracement level, you have a massive wall of support. Institutional algorithms track moving averages closely, so this overlap creates powerful buying pressure.
- Relative Strength Index (RSI): We wait for the price to hit a retracement level while the RSI simultaneously drops into oversold territory (below 30). This double signal shows that selling pressure is exhausted right at a major support zone.
- Previous Resistance Turned Support: Old resistance often becomes new support. If a prior breakout level matches a 38.2% line, we buy with high conviction.
Key Concept: Confluence is the foundation of high-probability trading. When a Fibonacci retracement level lines up with a moving average, an oversold RSI reading, or a prior support/resistance zone, the odds of a successful trade increase significantly. We always look for at least two confirming signals before entering a position.
Adding these layers of confirmation protects your capital from false signals. The SEC Office of Investor Education consistently emphasizes the importance of not relying on a single indicator, and our experience backs that up completely.
Fibonacci Extensions for Profit Targets
Getting into a trade is only half the battle. You also need to know exactly where to take your profits. This is where Fibonacci extensions come into play.
Extensions project mathematical ratios above the original swing high. They tell you where the stock is likely to run out of momentum on its next leg up.
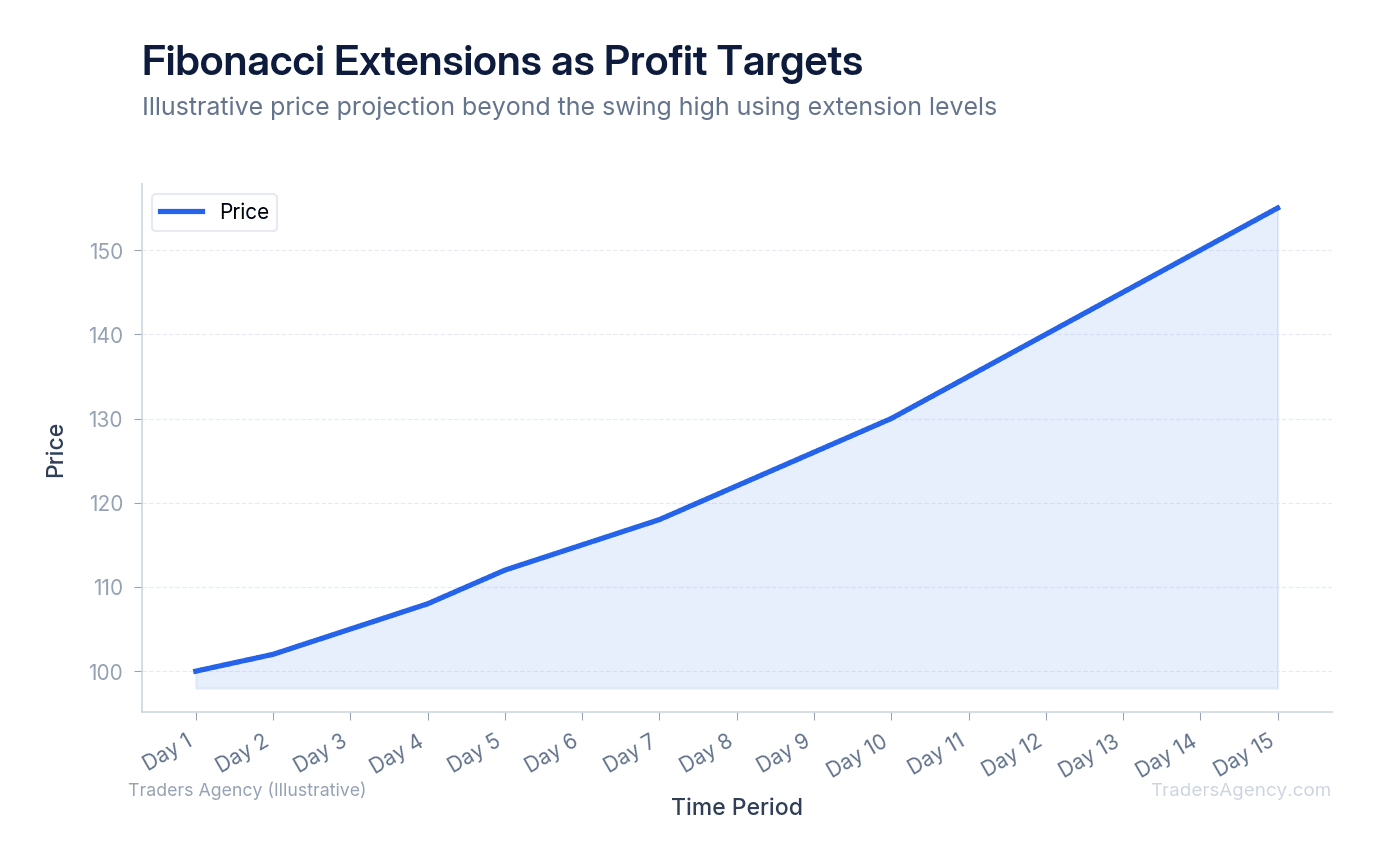
The most common extension targets are 127.2%, 161.8%, and 261.8%. We use these levels to scale out of our winning positions systematically.
Let's return to our AAPL example. We bought the pullback at $160.50. The stock reverses and pushes back up to the original $170.00 high. Instead of selling everything at the old high, we hold a portion of our position for a larger move.
| Extension Level | Price Target | Our Action |
|---|---|---|
| 127.2% | $175.44 | Sell half the position |
| 161.8% | $182.36 | Sell remaining shares |
| 261.8% | $202.36 | Only if momentum is exceptional |
We place a limit order to sell half our shares at $175.44. We place another sell order at the 161.8% extension, which sits at $182.36. These extension levels act as invisible ceilings. By setting our profit targets just below these lines, we lock in gains before the broader market starts taking profits.
When Should You Avoid Trading Fibonacci Retracement Levels?
No trading strategy works in every market environment. Knowing when to sit on your hands is an essential skill for long-term survival. Fibonacci tools require a clear, established trend to function properly. If you try to use them in the wrong conditions, you will suffer unnecessary losses.
- Choppy, sideways markets: When a stock is bouncing randomly between a tight range, the swing highs and lows lack meaning. The percentage lines will generate constant false signals.
- Extremely short timeframes (for beginners): A 61.8% pullback on a one-minute chart is mostly market noise. We recommend starting with the daily or four-hour charts for cleaner, more reliable signals.
- Major news events: Earnings reports or federal interest rate decisions can cause massive price spikes. These spikes easily blast right through mathematical support zones, triggering stop-loss orders before you can react.
Risk Warning: Never ignore basic risk management. We teach our members to risk no more than 1% to 2% of their total account equity on any single trade. Even the most perfect 50% retracement setup can fail if broader market conditions suddenly turn negative. Protect your capital first, and the profits will follow.
Our education team publishes new strategy guides and market analysis every week. Fibonacci retracement is one of the most powerful tools in a trader's toolkit, but only when you apply it with discipline, proper risk management, and confirmation from other indicators. Practice drawing these levels on historical charts before risking real money, and you'll build the confidence to trade pullbacks with precision.
Want expert trading insights delivered daily?
Join thousands of traders who rely on Traders Agency for market analysis and trade ideas.
Join Traders AgencyKey Takeaways
- Fibonacci retracement levels are derived from the Fibonacci sequence (0, 1, 1, 2, 3, 5, 8, 13...), introduced to Western mathematics in 1202, where dividing numbers in the sequence produces the key trading ratios used on price charts.
- The levels act as hidden support and resistance zones by dividing the vertical distance between a major price high and low into specific mathematical percentages, helping traders identify where a pullback is likely to pause before the trend resumes.
- Fibonacci retracement works best when combined with confirmation from other indicators, not as a standalone signal. Broader market conditions can invalidate even a textbook 50% retracement setup.
- Risk management is non-negotiable: risking more than 1% to 2% of total account equity on any single trade exposes you to outsized losses, regardless of how clean the retracement setup looks.
- Practicing on historical charts before trading real money is the recommended path to building the precision and confidence needed to execute pullback entries correctly.
DISCLAIMER: Traders Agency does not offer financial advice. The information provided is for educational purposes only and should not be considered financial advice. Traders Agency is not responsible for any financial losses or consequences resulting from the use of the information provided. Trading carries inherent risks and may not be suitable for all individuals. You are advised to conduct your own research and seek personalized advice before making any investment decisions, recognizing the potential risks and rewards involved.
See more from Traders Agency on Google
Make us a preferred source and our market analysis will appear more prominently in your Google Search, Top Stories, and AI results.
Add to Preferred Sources



