
You've probably seen this happen: a stock grinds sideways for a few weeks, the price swings get tighter and tighter, and then suddenly it explodes in one direction. That's not random. That's a chart pattern resolving itself. In this guide, we'll teach you how to spot triangles, wedges, and flags on your own charts, how to set price targets and stop-losses for each, and how to use volume to tell a real breakout from a fake one.
This is beginner-friendly territory. We define every term as we go, so if you're new to technical analysis, you'll be able to follow along without needing a glossary open in another tab.
What Are Chart Patterns in Trading?
Bottom Line: Triangles, wedges, and flags give traders a repeatable framework for anticipating breakouts, but the pattern alone isn't enough. Confirming the move with a closing candle beyond the trendline and above-average volume is what separates a real breakout from a fake one, and measured move targets combined with proper stop-loss placement turn the pattern into an actual trade plan.
Trading chart patterns are visual shapes formed by price movement over time that help traders anticipate what might happen next. They form because large groups of traders tend to react similarly at the same support and resistance levels, creating repeatable shapes on the chart.
Think of a chart pattern like footprints in the sand. The footprints themselves don't move anything, but they tell you where the crowd has been walking and give you a clue about where it's headed next. Patterns don't guarantee an outcome, but they give you a framework for probability.
We teach new traders to think of patterns in two broad buckets:
- Continuation patterns: the price pauses, then keeps moving in the same direction it was already going
- Reversal patterns: the price pauses, then turns and moves the opposite way
Triangles, wedges, and flags can fall into either category depending on the context, which is exactly why we're covering all three together.
Key Concept: A chart pattern is only useful in context. The same shape can mean "continue" or "reverse" depending entirely on the trend that came before it.
What Are Ascending, Descending, and Symmetrical Triangles?
A triangle pattern forms when price swings get smaller and smaller, squeezed between two converging trendlines. There are three types, and each one leans a different direction.
1. Ascending Triangle
This pattern has a flat resistance line on top and a rising support line on the bottom. Buyers keep pushing price higher on the dips, while sellers defend the same ceiling repeatedly. We generally consider this a bullish pattern, especially when it forms during an uptrend.
2. Descending Triangle
This is the mirror image: a flat support line on the bottom and a falling resistance line on top. Sellers are getting more aggressive while buyers defend the same floor. We typically read this as bearish.
3. Symmetrical Triangle
Here, both trendlines slope toward each other, resistance falling and support rising, creating a cone shape. This one doesn't carry a built-in directional bias. It simply shows contraction, a period where buyers and sellers are reaching equilibrium before one side wins.
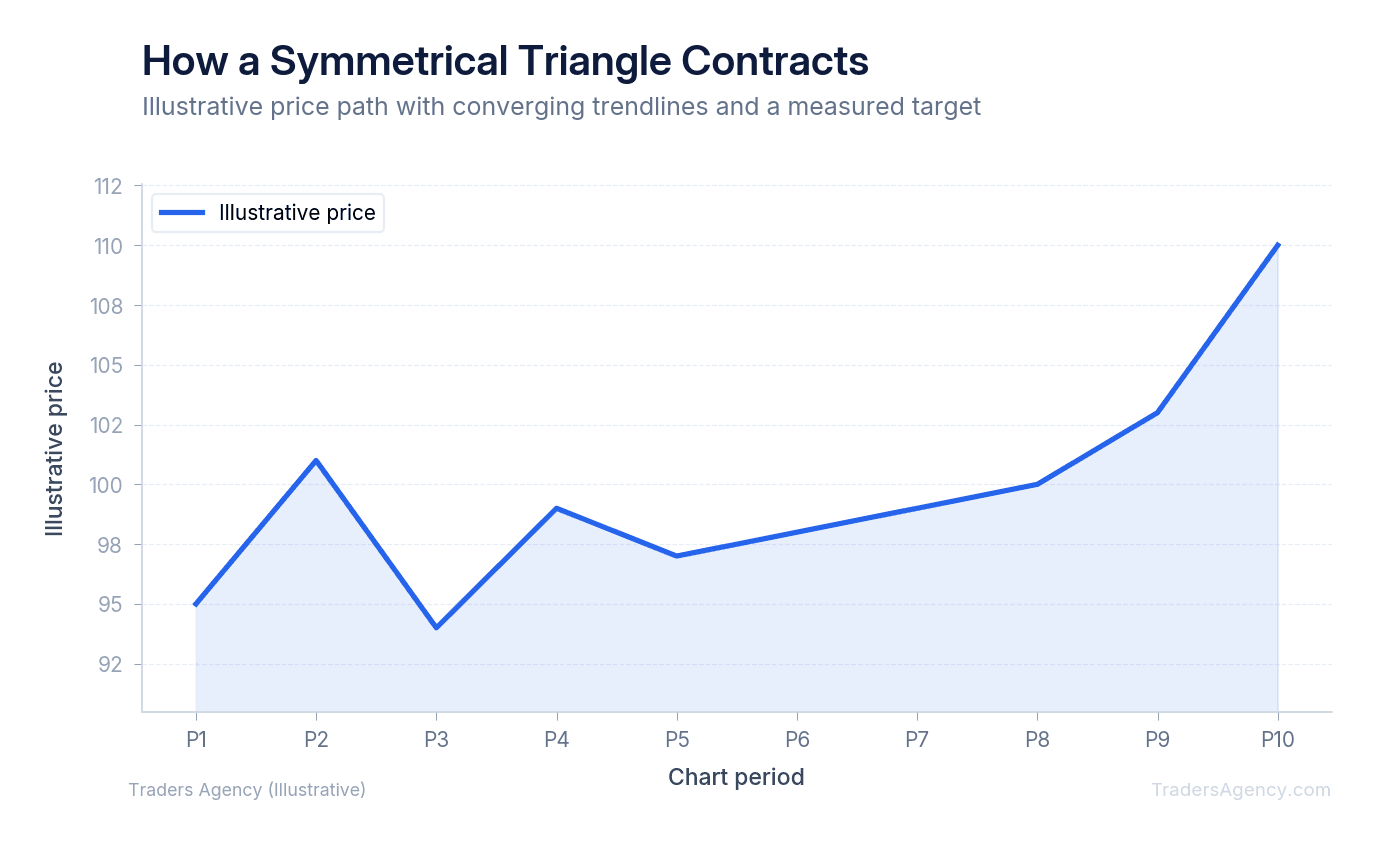
Say a stock trades between $48 support and $52 resistance for three weeks, with each swing getting tighter. If price breaks above $52 on a strong candle, that's your signal. We'll cover exactly how to set a target for that breakout in a later section.
Are Rising and Falling Wedges Reversal or Continuation Patterns?
A wedge looks similar to a triangle, but both trendlines slope in the same direction, rather than one line being flat or the two lines sloping toward each other from opposite directions. This single difference changes how we interpret it.
Rising Wedge
Both trendlines slope upward, but the lower line rises faster than the upper line, squeezing price into a narrowing upward channel. Despite the bullish-looking slope, a rising wedge is usually a bearish signal. It suggests buying pressure is weakening even as price inches higher, and it often breaks downward.
Falling Wedge
Both trendlines slope downward, with the upper line falling faster than the lower one. We generally read this as bullish, especially after a downtrend, since it signals selling pressure is running out of steam.
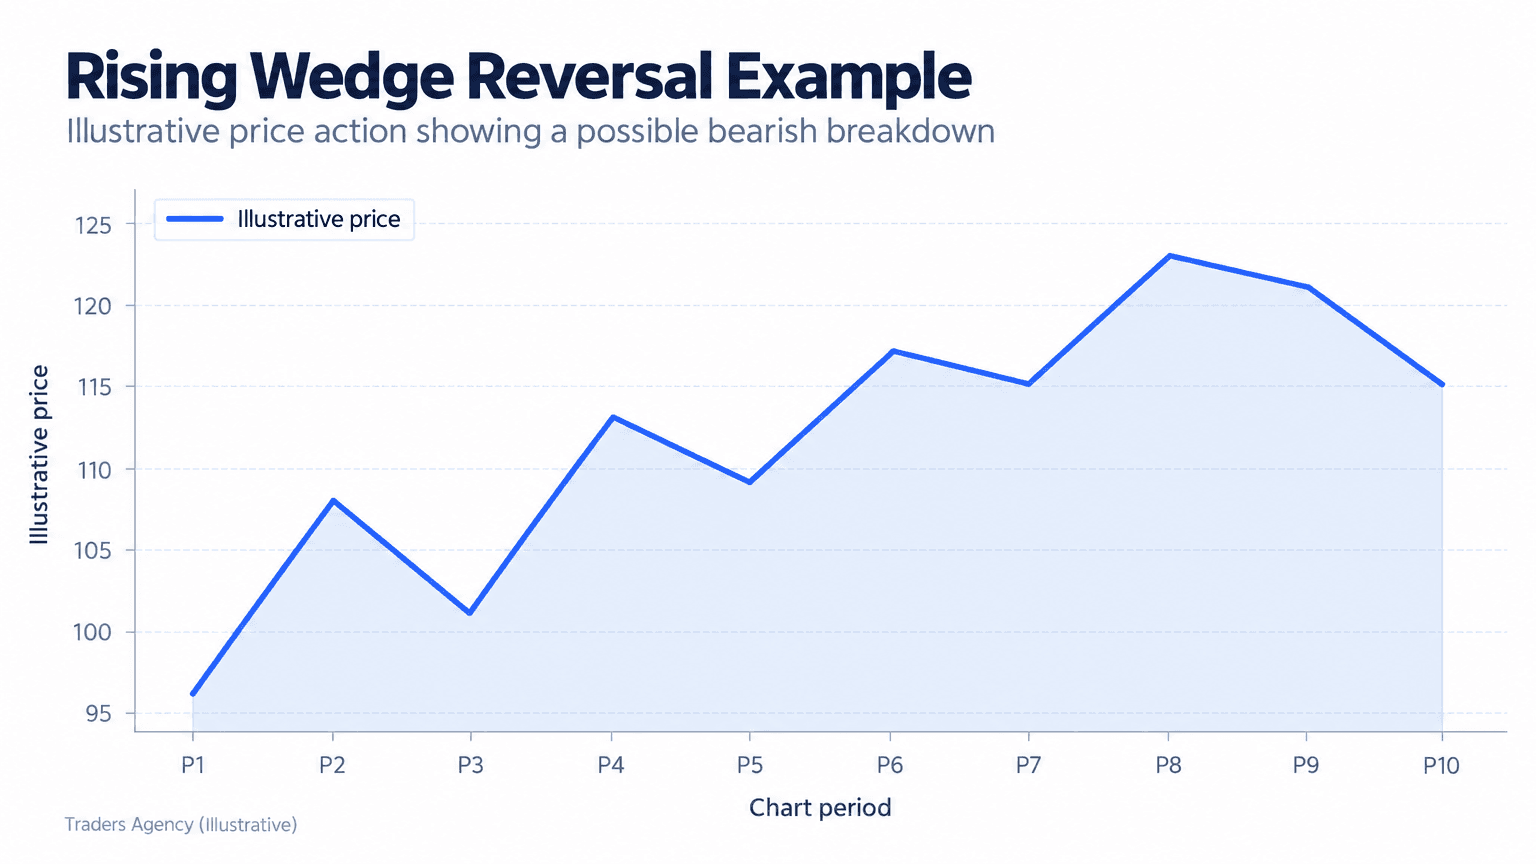
Here's the detail that trips up beginners: a wedge can act as either a reversal or a continuation pattern depending on the prior trend. A rising wedge after a long uptrend often marks a reversal top. A rising wedge that forms as a brief pause within a downtrend is more likely a continuation signal, meaning the downtrend is about to resume.
Want expert trading insights delivered daily?
Join thousands of traders who rely on Traders Agency for market analysis and trade ideas.
Join Traders AgencyWhat Are Bull and Bear Flags?
A flag pattern is a short, tight consolidation that forms after a sharp, fast price move, resembling a flag on a pole. Flags are almost always continuation patterns, meaning the trend that came before the flag is expected to resume once it resolves.
Bull Flag Example
Imagine a stock jumps from $20 to $26 in two trading sessions on strong buying volume. That sharp move is the "pole." Then price drifts sideways or slightly downward in a tight channel between $24.50 and $25.50 for about five sessions. That consolidation is the "flag."
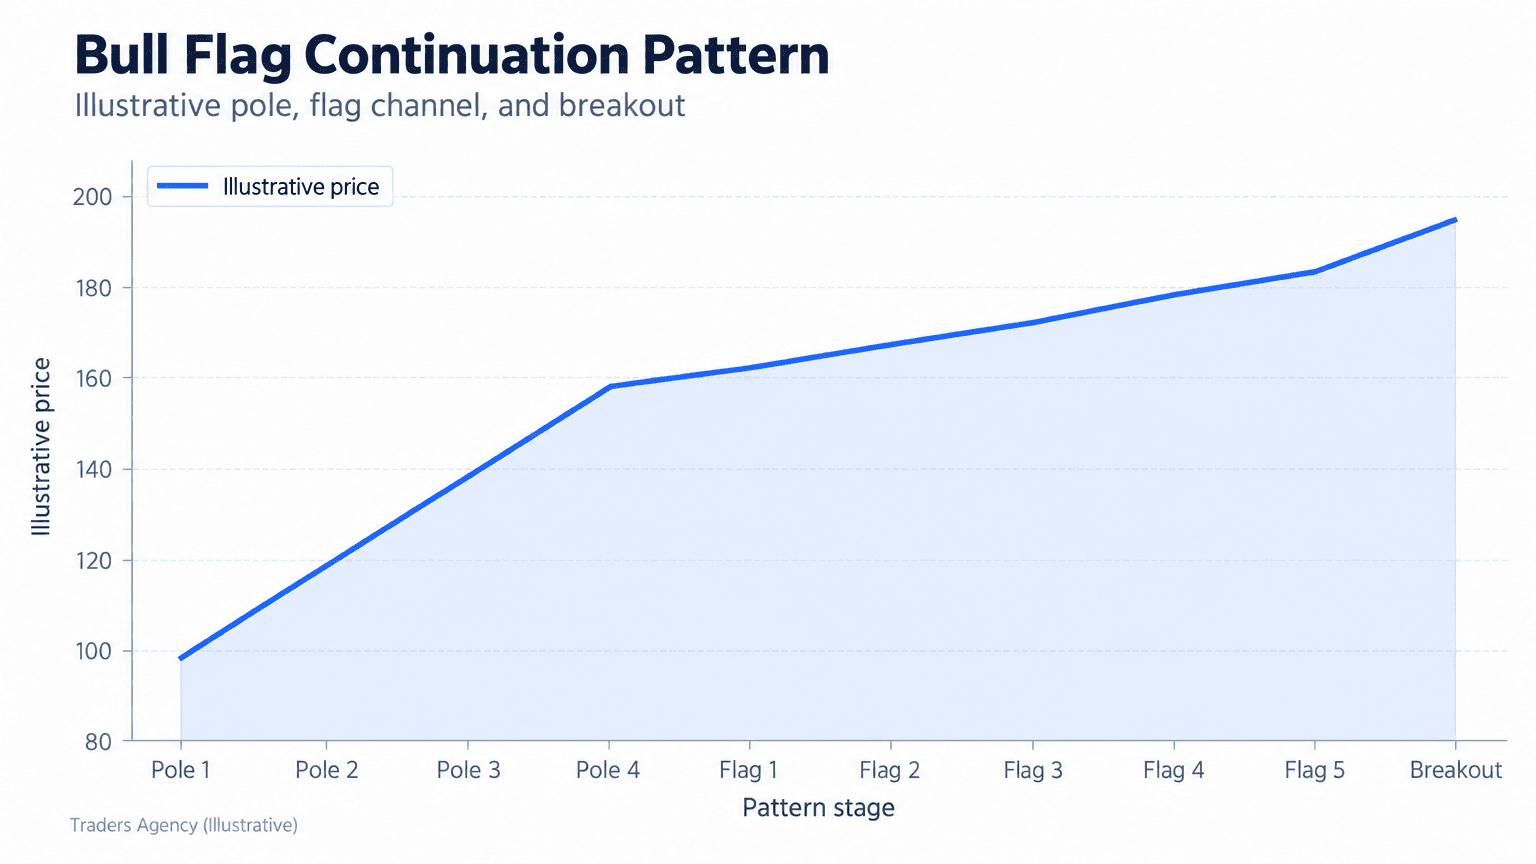
If price breaks above $25.50 with rising volume, that confirms the flag and suggests the next leg up is beginning. A bear flag is the same idea in reverse: a sharp drop (the pole), followed by a tight upward-drifting consolidation (the flag), followed by a breakdown continuing the decline.
We like flags for traders who want shorter holding periods, since the pattern typically resolves faster than triangles or wedges.
Step-by-Step: Trading the Bull Flag Example
- Step 1: Identify the Pole and the Flag. Confirm a sharp, high-volume move (the $20 to $26 pole), then watch for a tight consolidation that holds well above the pole's starting point.
- Step 2: Wait for the Confirmed Break. Don't enter on the first poke above $25.50. Wait for the candle to close above that level with volume clearly above the average volume seen during the flag.
- Step 3: Enter and Set Your Levels. Enter on the next candle after confirmation, place your stop near $24.50 (back inside the flag), and set your target using the measured move described below.
- Step 4: Manage the Trade. If volume fades quickly after the breakout or price closes back inside the flag, treat that as an early warning and consider tightening your stop.
How to Interpret This Pattern?
To interpret any trading chart pattern, identify the trendlines forming its boundaries, note the direction of the prior trend, and wait for a confirmed break beyond one of those boundaries on increased volume before acting.
Interpretation always comes down to three questions:
- What was price doing before the pattern formed (the prior trend)?
- Which direction did the trendlines break?
- Was that break backed by strong volume?
A pattern without context is just two lines on a chart. The prior trend tells you what "continuation" or "reversal" actually means in that specific setup.
Price Target and Stop-Loss: Measured Move Targets
We set price targets for chart patterns using a measured move: measuring the height of the pattern at its widest point and projecting that same distance from the breakout point.
For our earlier triangle example, support was at $48 and resistance was at $52, a $4 range. If price breaks above $52, the measured move target becomes $56 ($52 + $4). For the bull flag example, the pole ran from $20 to $26, a $6 move. Breaking out above $25.50 projects a target near $31.50.
Stop-losses are typically placed just on the other side of the breakout point, inside the pattern.
| Pattern Example | Pattern Range | Breakout Level | Measured-Move Target | Stop-Loss |
|---|---|---|---|---|
| Symmetrical Triangle | $48 to $52 ($4 range) | $52 | $56 | Just below $51 |
| Bull Flag | Pole: $20 to $26 ($6 move) | $25.50 | $31.50 | Near $24.50 |
Key Concept: A measured move isn't a guarantee, it's a plan. It gives you a logical target and stop before you ever enter the trade, so emotion doesn't dictate your exit.
Volume Confirmation and Avoiding False Breakouts
A breakout without volume is a yellow flag, not a green one. We want to see trading volume expand noticeably on the breakout candle compared to the average volume during the consolidation itself.
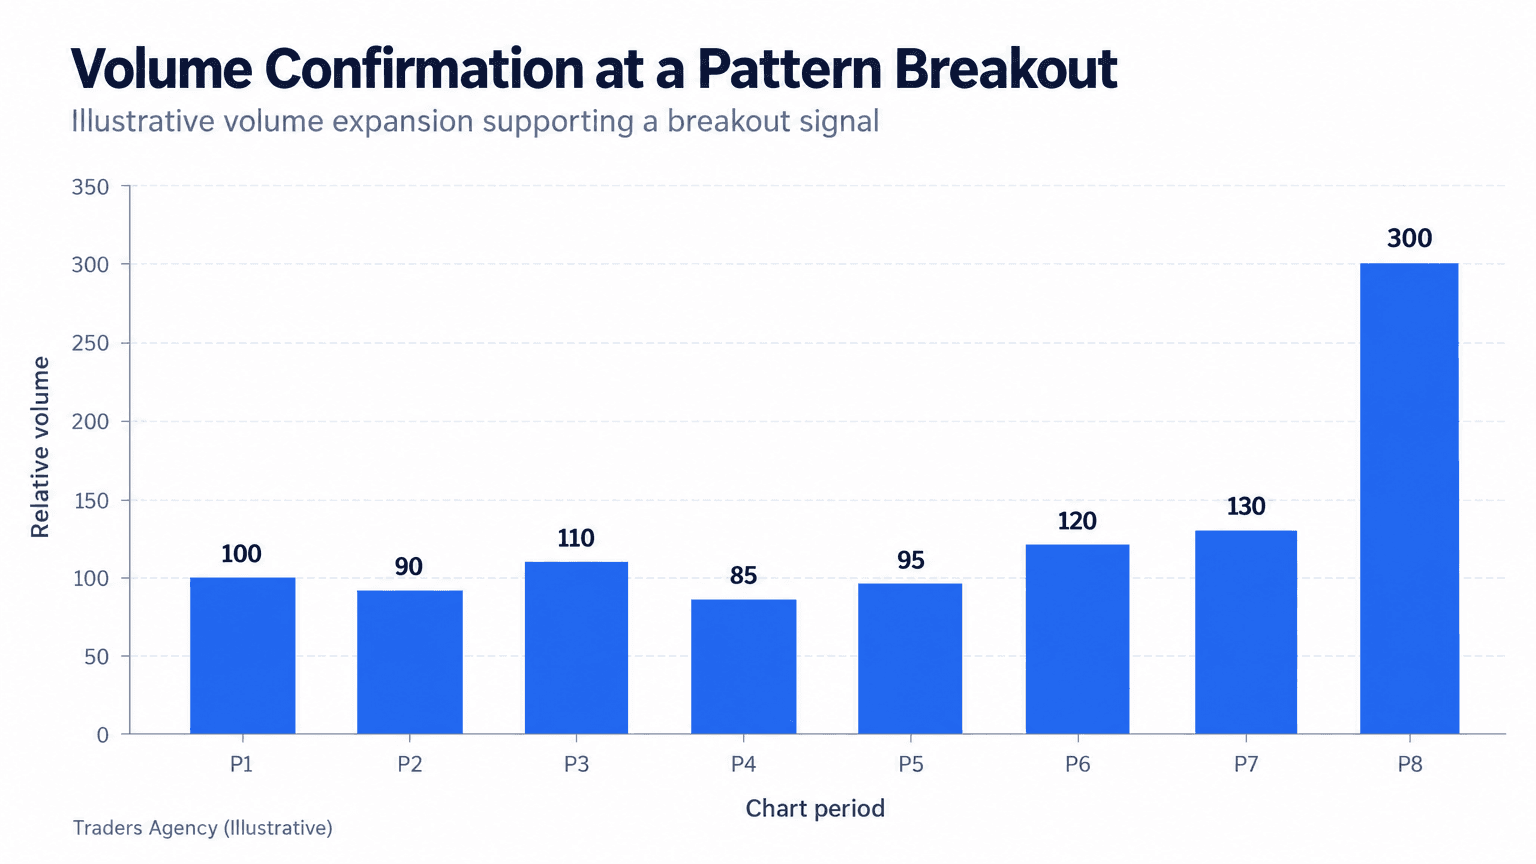
Watch Out: A common mistake beginners make is entering the moment price pokes through a trendline, without checking volume at all. We prefer to wait for the candle to close beyond the line, confirm volume is above its recent average, and then enter on the next candle.
When Should You Use Chart Pattern Trading?
Chart pattern trading works best on daily and 4-hour timeframes, where noise is lower and patterns take days or weeks to form, giving you time to plan an entry calmly. These patterns also show up in chart patterns trading forex markets, though shorter timeframes there tend to produce more false signals.
These patterns work across stocks, forex, and futures, but we'd avoid relying on them alone during major news events, earnings releases, or extremely low-volume sessions, since price can gap through pattern boundaries without respecting them.
Combining Patterns With Other Indicators
For higher-conviction entries, we like pairing chart patterns with:
- RSI (Relative Strength Index): confirms whether momentum supports the breakout direction
- Moving averages: a breakout that also clears the 50-day moving average adds weight to the signal
- Volume: as covered above, this is non-negotiable for us
Risk Management Basics
- Never risk more than 1-2% of account capital on a single pattern trade
- Always place your stop before entering, not after
- Reduce position size when trading chart patterns trading for beginners style setups until you've tracked your own win rate over at least 20 trades
If you're looking for structured practice material, many traders start with a chart patterns pdf or a technical analysis chart patterns pdf reference sheet to keep shapes and rules handy while studying live charts. Free resources exist, including educational material published by exchanges such as the Cboe and CME Group, though we'd caution against any most profitable chart patterns pdf that promises guaranteed win rates. No pattern wins every time.
Frequently Asked Questions About Chart Patterns Trading
What is the price target and stop-loss for chart patterns?
Use the measured move method: measure the pattern's height and project that distance from the breakout point for your target, and place your stop just inside the pattern near the breakout line.
What are the most profitable chart patterns?
Flags and ascending/descending triangles tend to have the most consistent follow-through because they align with an existing trend, though no pattern is reliable 100% of the time.
How do you confirm a chart pattern breakout?
Wait for a closing candle beyond the trendline accompanied by volume meaningfully above the pattern's average volume.
What timeframes work best for chart pattern trading?
Daily and 4-hour charts generally produce cleaner, more reliable patterns than very short timeframes like 1-minute or 5-minute charts.
Where can beginners find chart patterns trading free resources?
Several financial education sites and exchanges publish free introductory material, which pairs well with practicing on a demo account before trading live capital.
Want expert trading insights delivered daily?
Join thousands of traders who rely on Traders Agency for market analysis and trade ideas.
Join Traders AgencyDISCLAIMER: Traders Agency does not offer financial advice. The information provided is for educational purposes only and should not be considered financial advice. Traders Agency is not responsible for any financial losses or consequences resulting from the use of the information provided. Trading carries inherent risks and may not be suitable for all individuals. You are advised to conduct your own research and seek personalized advice before making any investment decisions, recognizing the potential risks and rewards involved.
See more from Traders Agency on Google
Make us a preferred source and our market analysis will appear more prominently in your Google Search, Top Stories, and AI results.
Add to Preferred Sources