
You have probably watched a stock jump 40% in a single day with no news behind it, then seen someone online explain it away with "short squeeze." That explanation only makes sense once you understand short interest data, the numbers that show how many traders are betting against a stock. In this guide, we'll show you where to find this data, how to read it, and how to use it to spot potential short squeeze setups before they happen.
We built this guide for traders who keep hearing terms like days to cover and cost to borrow tossed around on trading forums but have never actually pulled up the reports themselves. Our goal is simple: by the time you finish reading, you'll be able to open a short interest tracker, interpret what you see, and decide whether it matters for a trade you're considering.
What Is Short Interest Data?
Bottom Line: Short interest data only tells you how many traders are betting against a stock, not when or whether a squeeze will actually happen. Combining the share count with days to cover and cost to borrow gives a clearer read on squeeze potential, but position sizing and stop losses still matter since these setups can deflate as fast as they inflate.
Short interest data measures the total number of shares of a stock that are currently sold short. It gets reported either as a raw share count or as a percentage of the stock's float (the shares available for trading).
Here's the mechanic behind it. When a trader thinks a stock will fall, they can borrow shares and sell them, planning to buy them back later at a lower price. That borrowed-and-sold position is a "short." Short interest data aggregates all of those open short positions across a stock, giving you a snapshot of how many traders are currently betting against it.
A stock with short interest at 4% of its float has relatively light bearish positioning. A stock sitting at 32% has a huge chunk of its tradable shares borrowed and sold short, which means a lot of traders need to buy those shares back eventually. That second scenario is where things get interesting, and also where things get risky.
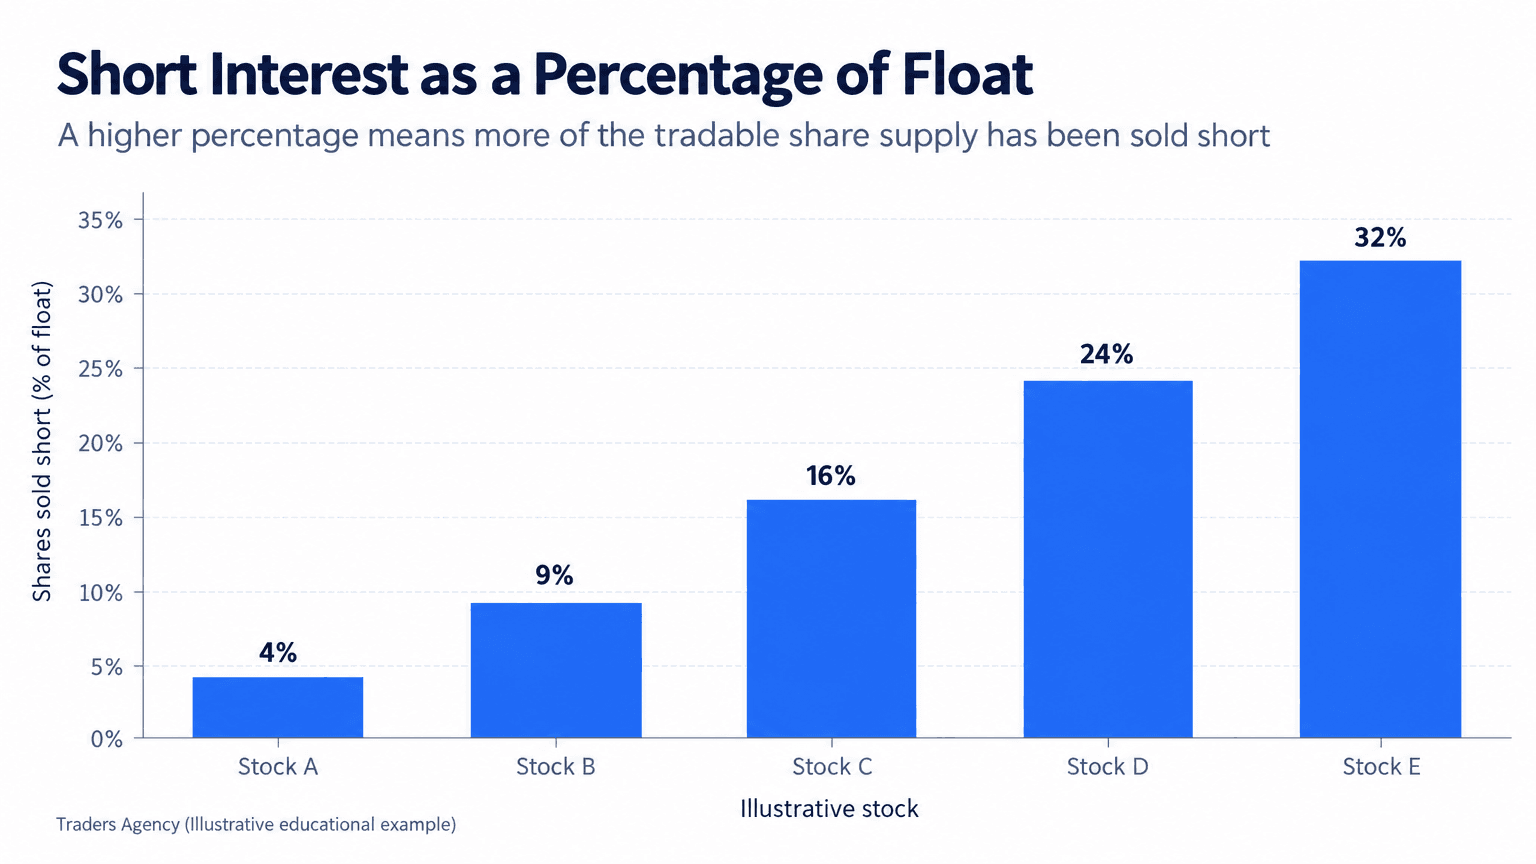
Why does this matter to a retail trader? Because a heavily shorted stock has a built-in pool of forced buyers waiting in the wings. If the price starts rising and those short sellers panic, they have to buy shares to close their positions, which pushes the price up even further. That chain reaction is what people mean when they say "short squeeze."
Key Concept: Short interest tells you how many shares are currently bet against a stock. High short interest alone isn't a trading signal, it's a measure of how much forced buying could happen if the price starts moving against the shorts.
Where Can You Find Short Interest Data?
The most reliable source for short interest data is FINRA itself (the Financial Industry Regulatory Authority), which collects and publishes short interest figures reported by its member firms. Nasdaq short interest data is also published directly on Nasdaq's own site and mirrors the same underlying FINRA reports.
Here's a quick rundown of where to look, depending on what you need:
- FINRA's website: the official regulatory source, bi-monthly updates, free to access
- Nasdaq.com: pulls the same underlying data and presents it by ticker, searchable and free
- Your broker's research tab: many brokers display short interest data directly on the equity research page
- Third-party short interest trackers: aggregate historical data and add visualizations, some free, some paid
If you're just starting out, we recommend bookmarking the Nasdaq short interest search tool and your broker's research section. Those two alone will cover most of what a beginner needs before moving into paid tools.
How Often Is Short Interest Data Updated?
Short interest data from FINRA is updated twice per month, typically settling on the 15th and the last business day of the month, with the official figures published a few business days later. This means the numbers you see are never truly live. They reflect a snapshot from roughly a week or two earlier.
This lag matters. A trader checking short interest data today should understand they're looking at a report that may be 10 to 15 days old by the time it posts.
That delay is exactly why some traders pay for real-time short interest tracker platforms (we'll get to those shortly), since a lot can change in a stock's short positioning over two weeks, especially during a volatile run.
Want expert trading insights delivered daily?
Join thousands of traders who rely on Traders Agency for market analysis and trade ideas.
Join Traders AgencyHow Do I Calculate the Short Interest Ratio (Days to Cover)?
The short interest ratio, also called "days to cover," is calculated by dividing total shares sold short by the stock's average daily trading volume. The result tells you how many trading days it would theoretically take for all short sellers to buy back their shares at normal volume.
Here's a simple example of how we walk traders through this calculation:
| Scenario | Shares Sold Short | Average Daily Volume | Days to Cover |
|---|---|---|---|
| Heavily Shorted Example | 2,000,000 | 400,000 | 5 days |
| Lightly Shorted Example | 500,000 | 1,000,000 | 0.5 days |
In the first case, short sellers would need five full trading days of normal volume to close out their position without moving the price much. In the second case, they could close out in half a day without much trouble.
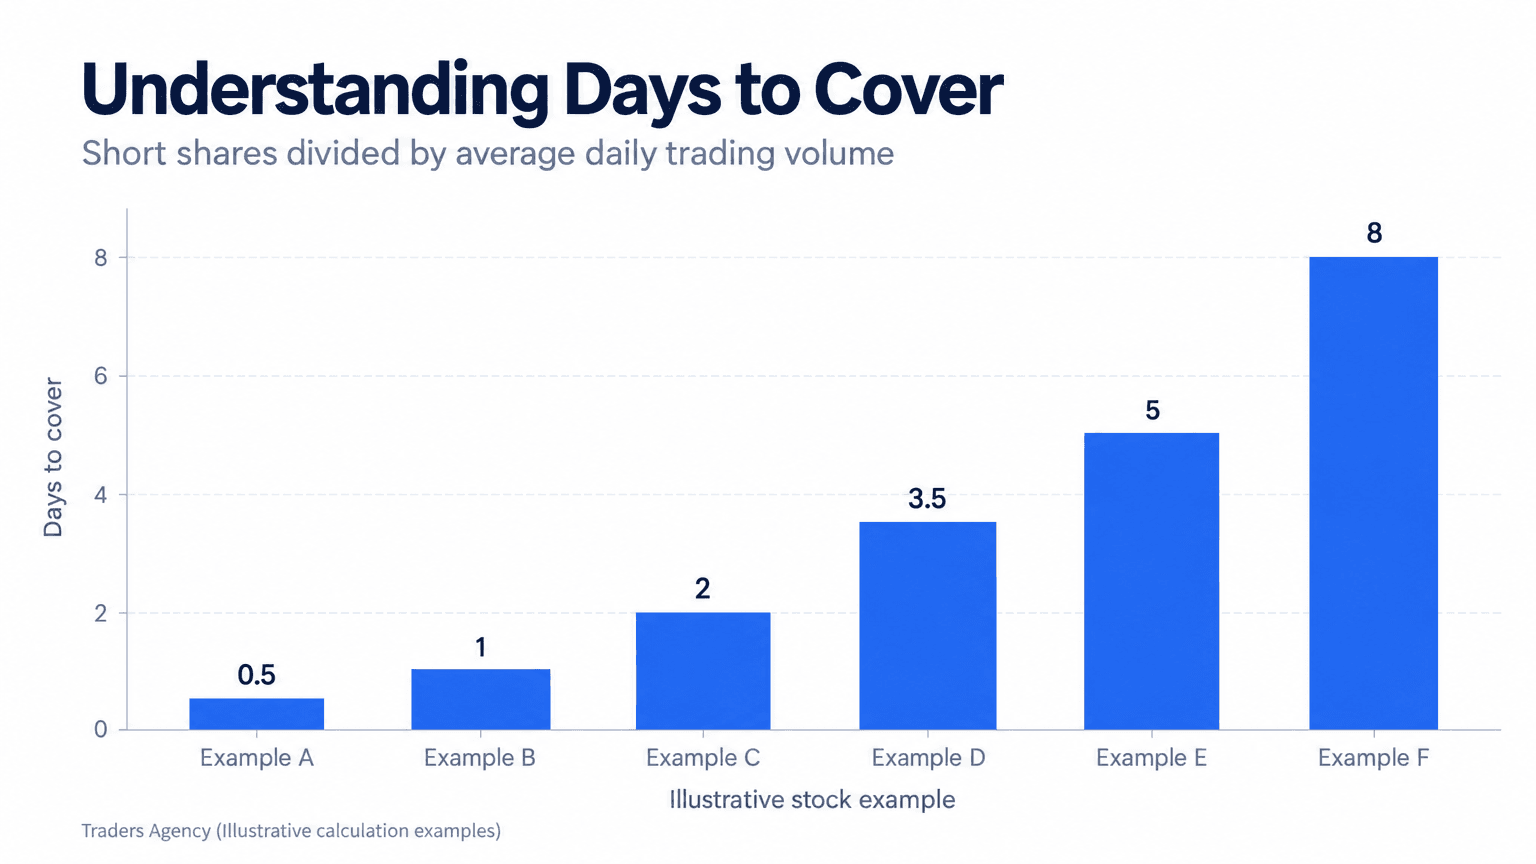
A high days-to-cover number is a warning sign for short sellers and a point of interest for traders watching for a squeeze. It tells you that if the stock starts moving against the shorts, there isn't enough daily volume for them to exit quietly. They'll be forced to chase the price higher, which can snowball.
When Crowded Shorts Lead to a Squeeze
A short squeeze happens when rising prices force short sellers to buy back shares to limit their losses, and that forced buying pushes the price up even more, triggering more short sellers to cover in a feedback loop.
This is the mechanic behind nearly every viral "squeeze" story you've read about on trading forums. It starts with a stock that has high short interest and a high days-to-cover ratio relative to how fast the price is moving. Then some spark (a news event, an earnings beat, coordinated retail buying) pushes the price up, and the short covering does the rest.
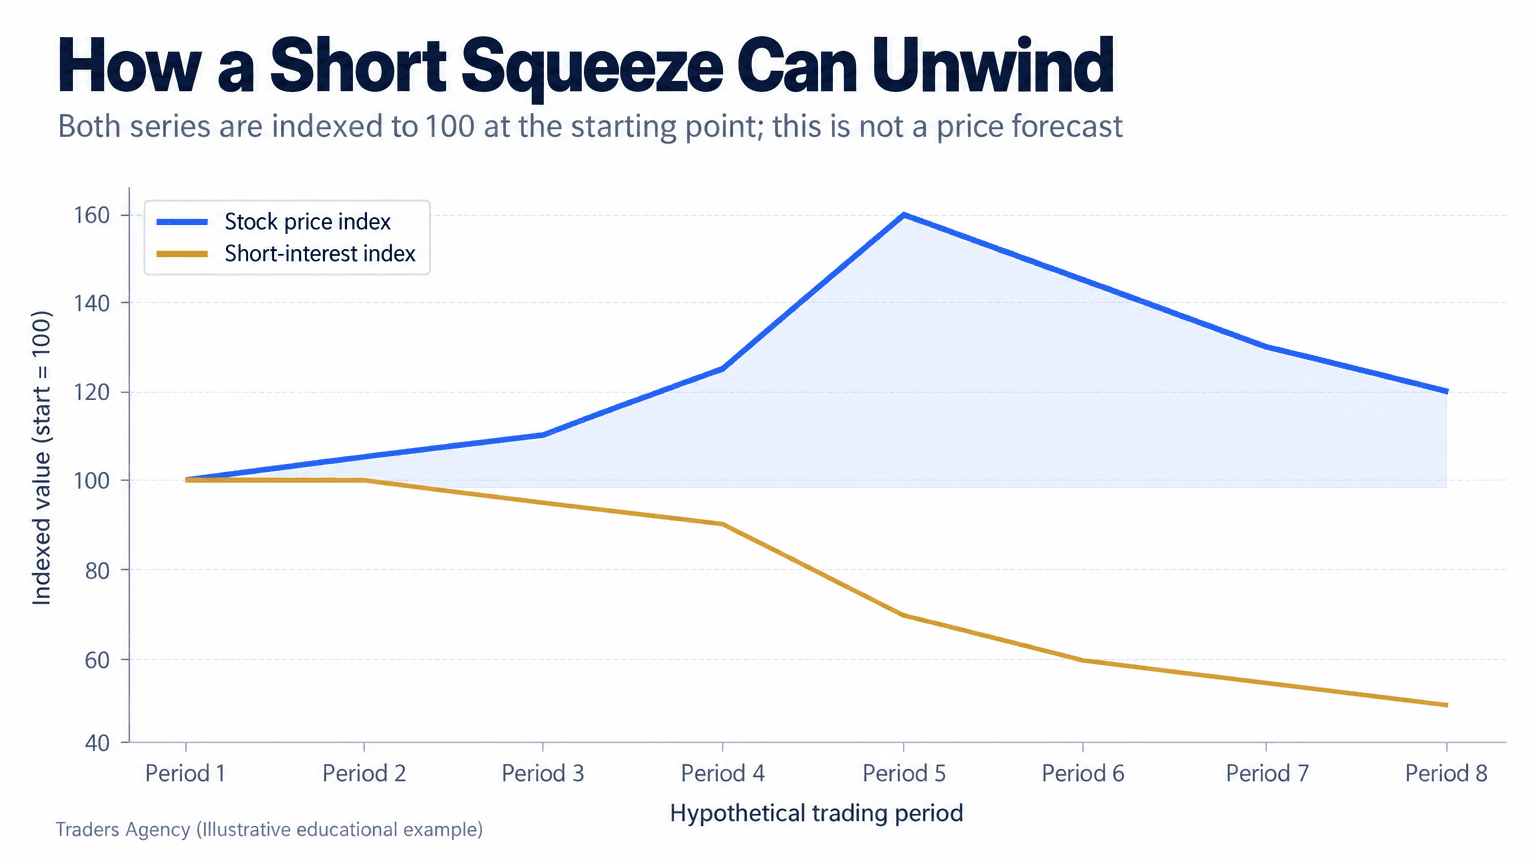
Notice the pattern: price rises while short interest falls. That's the signature of short sellers exiting their positions, and it's exactly what we tell our traders to look for when confirming a squeeze is actually unwinding rather than just a one-day spike.
What Are Fee Rate and Cost to Borrow?
The fee rate, or cost to borrow, is the interest rate a trader pays their broker to borrow shares for a short sale, and it rises when demand to borrow a stock's shares outpaces the available supply. A fee rate of 2% is unremarkable. A fee rate of 35% tells you shares are extremely hard to find.
This number matters just as much as days-to-cover, sometimes more. A stock can have a modest short interest percentage but still have a sky-high borrow fee if very few shares are actually available to lend out.
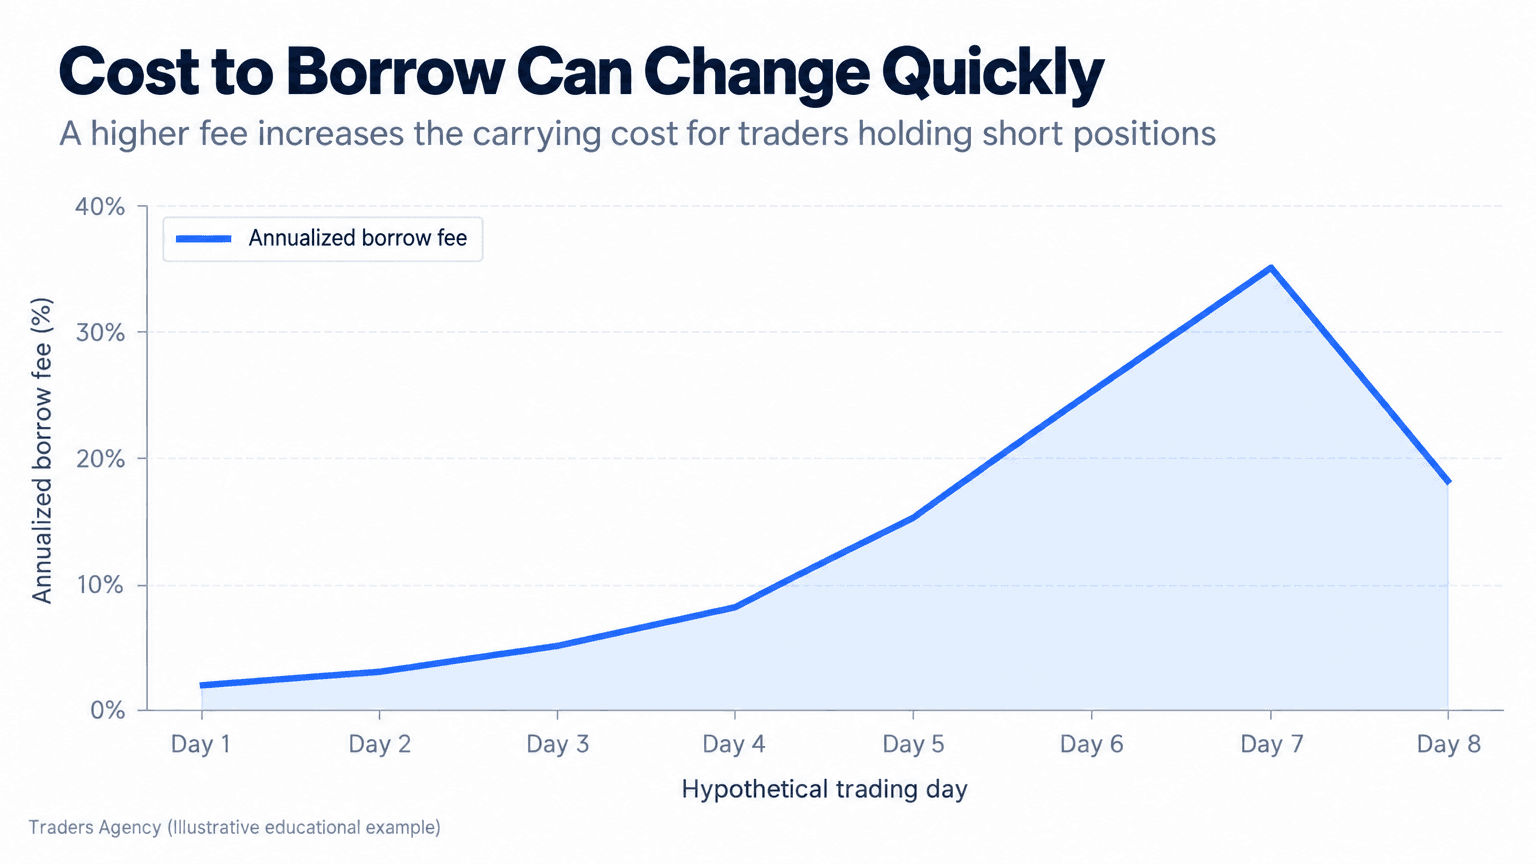
A rising fee rate combined with rising short interest and a falling supply of lendable shares is often the clearest early signal that a squeeze setup is building. When the fee rate starts dropping again, as shown above, it usually means short sellers are covering and the pressure is easing off.
How Do You Use Ortex and S3 Partners for Real-Time Data?
Ortex and S3 Partners are two paid platforms that estimate short interest and cost-to-borrow data in closer to real time, filling the gap left by FINRA's bi-monthly reporting schedule. Both platforms are widely used by traders who want daily or even intraday updates instead of waiting for the official bi-monthly release.
We want to be upfront about what these tools actually offer: they are estimates, not official filings. They use proprietary models built from lending desks, broker data, and other sources to approximate what current short interest and borrow fees likely look like. They're genuinely useful for spotting trend shifts faster than the official historical short interest data release allows, but they are not a substitute for the FINRA numbers when you need something verified.
Here's how our team recommends using these platforms:
- Check the estimate confidence score many trackers provide, since not every stock's data is equally reliable
- Cross-reference against the most recent official FINRA report rather than relying on the estimate alone
- Watch the trend, not just the snapshot, since the direction of change matters more than the exact number on any single day
- Compare fee rate movement alongside short interest percentage, since the two together give a fuller picture than either alone
Building a Short Squeeze Screener
A basic short interest screener combines a handful of data points to flag stocks worth watching, rather than relying on any single number in isolation.
Here's the framework our team uses when building one:
- Short interest percentage of float above 20% as a baseline threshold worth monitoring
- Days to cover above 3, signaling that shares can't be bought back quickly without moving the price
- Fee rate trending upward over the past several sessions, suggesting shares are getting harder to borrow
- Average daily volume increasing, which often comes before a price breakout
- Recent price action showing relative strength compared to the broader market or sector
No single metric on this list should trigger a trade by itself. We treat these as a checklist for building a watchlist, not a buy signal. A stock that checks three or four of these boxes deserves closer attention, not an automatic position.
When Should You Use Short Interest Data, and When Should You Stay Away?
Short interest data is most useful as a filter for building watchlists and understanding the risk profile of a stock you're already considering, not as a standalone signal to enter a trade. It works best alongside price action, volume, and a clear trigger.
We teach traders to use it when they want context on why a stock might be more volatile than its peers, or when trying to understand why a seemingly ordinary stock just moved 20% in an afternoon. It's also genuinely useful defensively: if you're considering shorting a stock yourself, checking the existing short interest and fee rate first can save you from borrowing shares at a punishing cost or getting caught in a squeeze against your own position.
Stay away from treating high short interest as a guaranteed bullish setup. Plenty of heavily shorted stocks stay heavily shorted for months or years because the underlying business is genuinely struggling, and the short sellers are simply right.
Watch Out: Short squeezes are unpredictable and can reverse violently, often within the same trading session. Chasing one after it's already up 50% for the day is a very different trade than spotting the setup early.
Risk Management Basics
- Position size small when trading around high short interest names, since volatility cuts both directions
- Use stop losses, even on momentum trades, since squeezes can deflate as fast as they inflate
- Never allocate a large percentage of your account to a single squeeze-style setup
- Treat options on heavily shorted stocks with extra caution, since implied volatility and premiums tend to be inflated
Want expert trading insights delivered daily?
Join thousands of traders who rely on Traders Agency for market analysis and trade ideas.
Join Traders AgencyDISCLAIMER: Traders Agency does not offer financial advice. The information provided is for educational purposes only and should not be considered financial advice. Traders Agency is not responsible for any financial losses or consequences resulting from the use of the information provided. Trading carries inherent risks and may not be suitable for all individuals. You are advised to conduct your own research and seek personalized advice before making any investment decisions, recognizing the potential risks and rewards involved.
See more from Traders Agency on Google
Make us a preferred source and our market analysis will appear more prominently in your Google Search, Top Stories, and AI results.
Add to Preferred Sources