
If you've ever taken a textbook-perfect breakout on a 15-minute chart only to get reversed twenty minutes later, you already understand why multi-timeframe analysis exists. In this guide, we'll show you how to structure a top-down analysis from the weekly trend all the way down to a 15-minute entry trigger, how to pick the right timeframe combination for your trading style, and how to avoid the mistake that trips up most traders: treating every timeframe's signal as equally important.
What Is Multi-Timeframe Analysis in Trading?
Bottom Line: A multi-timeframe analysis trading strategy works by using a higher timeframe to establish the dominant trend and context, then dropping to a lower timeframe only to time entries that align with that trend. The real edge isn't finding a perfect setup on any single chart, it's weighting timeframes unequally so higher timeframe context filters out the noise and false signals that trip up traders watching only one chart.
Multi-timeframe analysis is the practice of reviewing multiple chart intervals for the same security before placing a trade, rather than relying on a single chart in isolation. A daily chart might show a stock in a strong uptrend, but zoom into the 5-minute chart and you'll find constant back-and-forth chop that has nothing to do with the bigger trend. Traders who only watch one timeframe end up reacting to noise. Traders who check multiple timeframes get context.
Think of it like checking the weather forecast for the week before deciding what to pack, then checking the hourly forecast before you walk out the door. The weekly forecast tells you the season. The hourly forecast tells you whether to grab an umbrella right now. Both matter, but they answer different questions.
A typical multi-timeframe setup layers three views:
- Higher timeframe (weekly or daily): establishes the dominant trend
- Intermediate timeframe (daily or 4-hour): identifies the specific setup or pattern
- Lower timeframe (1-hour, 15-minute, or 5-minute): pinpoints the entry trigger
When these three views agree, you have alignment. When they disagree, you have a warning sign worth paying attention to.
Key Concept: Multi-timeframe analysis isn't a single indicator or signal. It's a framework for stacking evidence from higher timeframes (trend and context) with lower timeframes (timing and execution) before you risk capital.
How Do You Combine Daily and Intraday Charts?
Combining daily and intraday charts starts with reading the daily chart first to define the trend and key levels, then dropping down to a 15-minute or 1-hour chart to time the entry within that larger structure. The daily chart tells you what to trade. The intraday chart tells you when.
- Step 1: Read the Daily Chart for Structure. Before opening any intraday chart, mark up the daily first. Identify the trend direction using a simple moving average (we commonly use the 50-day and 200-day), note recent swing highs and lows, and flag any support or resistance levels within range of current price.
- Step 2: Define Your Trigger Zone. Once you know the daily trend, define a specific price zone where you'd be interested in entering. This might be a pullback to a moving average, a breakout above a prior swing high, or a bounce off a support level.
- Step 3: Drop to the Intraday Chart. Switch to your execution timeframe, commonly the 15-minute or 1-hour chart. Wait for price to actually enter your trigger zone, then look for a confirming pattern: a break of a short-term trendline, a candlestick reversal signal, or a momentum shift on an oscillator like RSI.
- Step 4: Execute With Defined Risk. Place your entry order, set your stop based on intraday structure (often just below a recent intraday low), and set your target based on the daily chart's next resistance or support level.
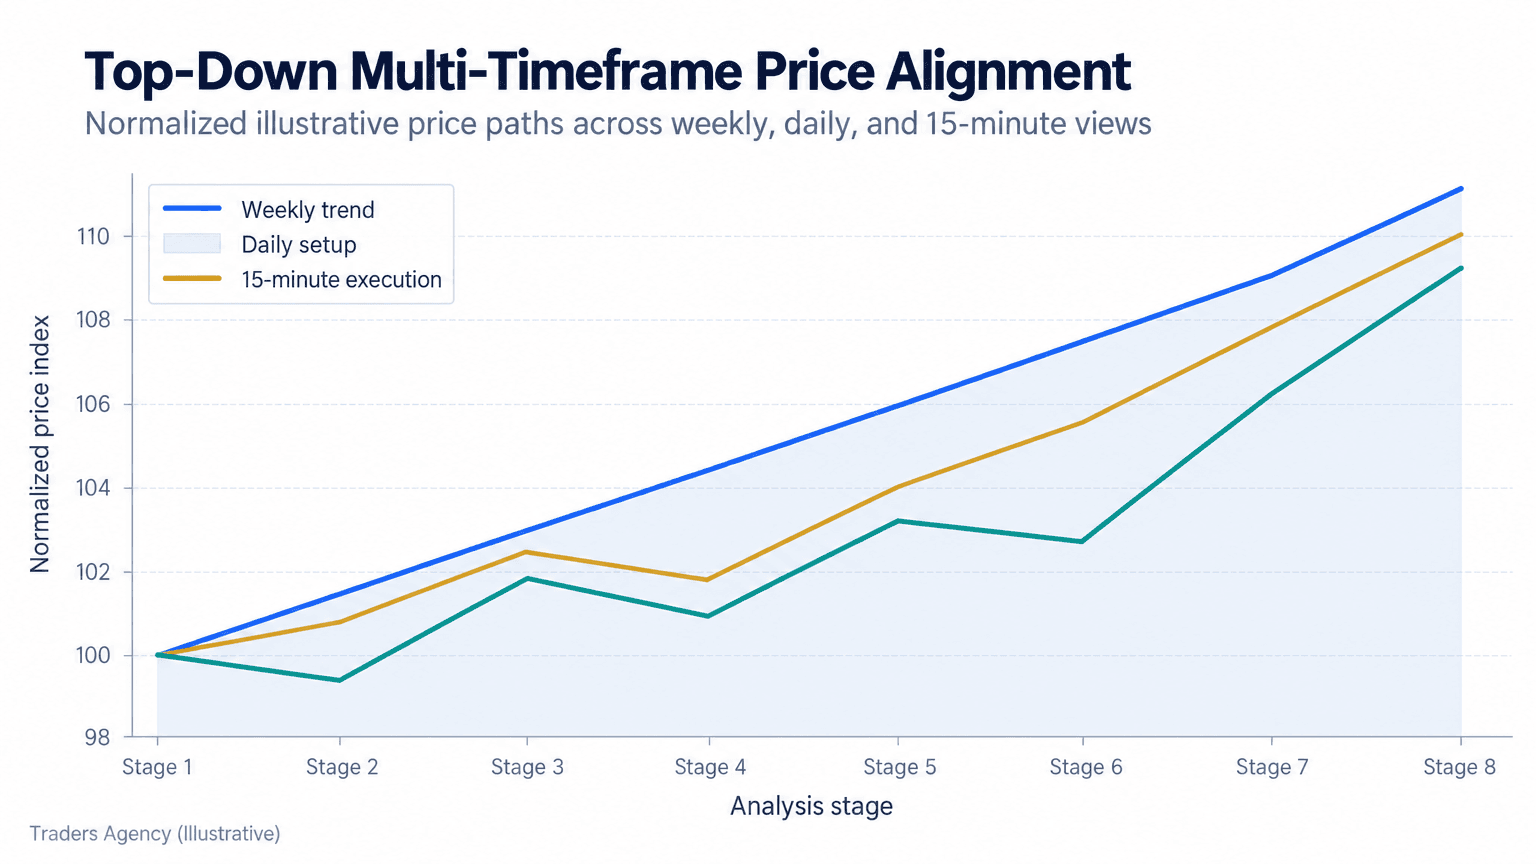
This is the core workflow we teach: weekly confirms the big picture, daily confirms the setup, and the 15-minute chart confirms the exact moment to act.
What Is the Difference Between Top-Down and Bottom-Up Multi-Timeframe Analysis?
Top-down analysis starts with the highest timeframe and works downward to the entry chart, while bottom-up analysis starts with a signal on a lower timeframe and then checks higher timeframes for confirmation before acting.
Most traders using a multi-timeframe approach prefer top-down, and here's why. Starting on the weekly or daily chart forces you to establish bias before you see any short-term noise. If you start on a 5-minute chart, every little wiggle looks tradeable, and it's easy to convince yourself a setup exists when the broader trend actually disagrees.
Bottom-up has its place too. Active intraday traders scanning for momentum often spot something on a 5-minute or 15-minute chart first, a volume spike or a breakout, and then check the daily chart to confirm the move has room to run. This works, but it requires discipline to actually walk away when the higher timeframe says no.
Key Concept: We teach top-down as the better default for most traders, especially swing traders and position traders. Bottom-up suits day traders and scalpers who need to react quickly to intraday volume and price action, provided they still check the daily chart before committing size.
Want expert trading insights delivered daily?
Join thousands of traders who rely on Traders Agency for market analysis and trade ideas.
Join Traders AgencyWhich Timeframes Should You Use?
The right timeframe combination depends on your trading style: swing traders typically pair the weekly and daily charts, day traders pair the daily and 15-minute charts, and scalpers pair the 1-hour and 5-minute charts. There's no single correct combination, only one that matches your holding period.
A common mistake is picking timeframes that are too close together. Comparing a 5-minute chart to a 15-minute chart gives you almost the same information twice, because there isn't enough separation between them. We generally recommend a 4x to 6x ratio between your higher and lower timeframe (daily to 4-hour is roughly 6x, daily to 1-hour is a much wider jump, which still works because the daily adds real structural context).
Common Timeframe Pairings by Trading Style
- Position traders: Monthly for trend, weekly for setup, daily for entry
- Swing traders: Weekly for trend, daily for setup, 4-hour for entry
- Day traders: Daily for trend, 1-hour for setup, 15-minute for entry
- Scalpers: 1-hour for trend, 15-minute for setup, 5-minute or 1-minute for entry
If you're building a multi-timeframe analysis trading strategy from scratch, we suggest starting with three timeframes maximum. Adding a fourth or fifth rarely adds useful information and mostly adds confusion.
5 Multi-Timeframe Trading Strategies
Here's a worked example using a daily and 15-minute combination, the pairing most day traders rely on.
The Setup: A stock is trading at $99.50 on the daily chart, in a clear uptrend above its 50-day moving average, with the next daily resistance zone sitting at $106. Price has pulled back to a daily support zone around $99 to $100.
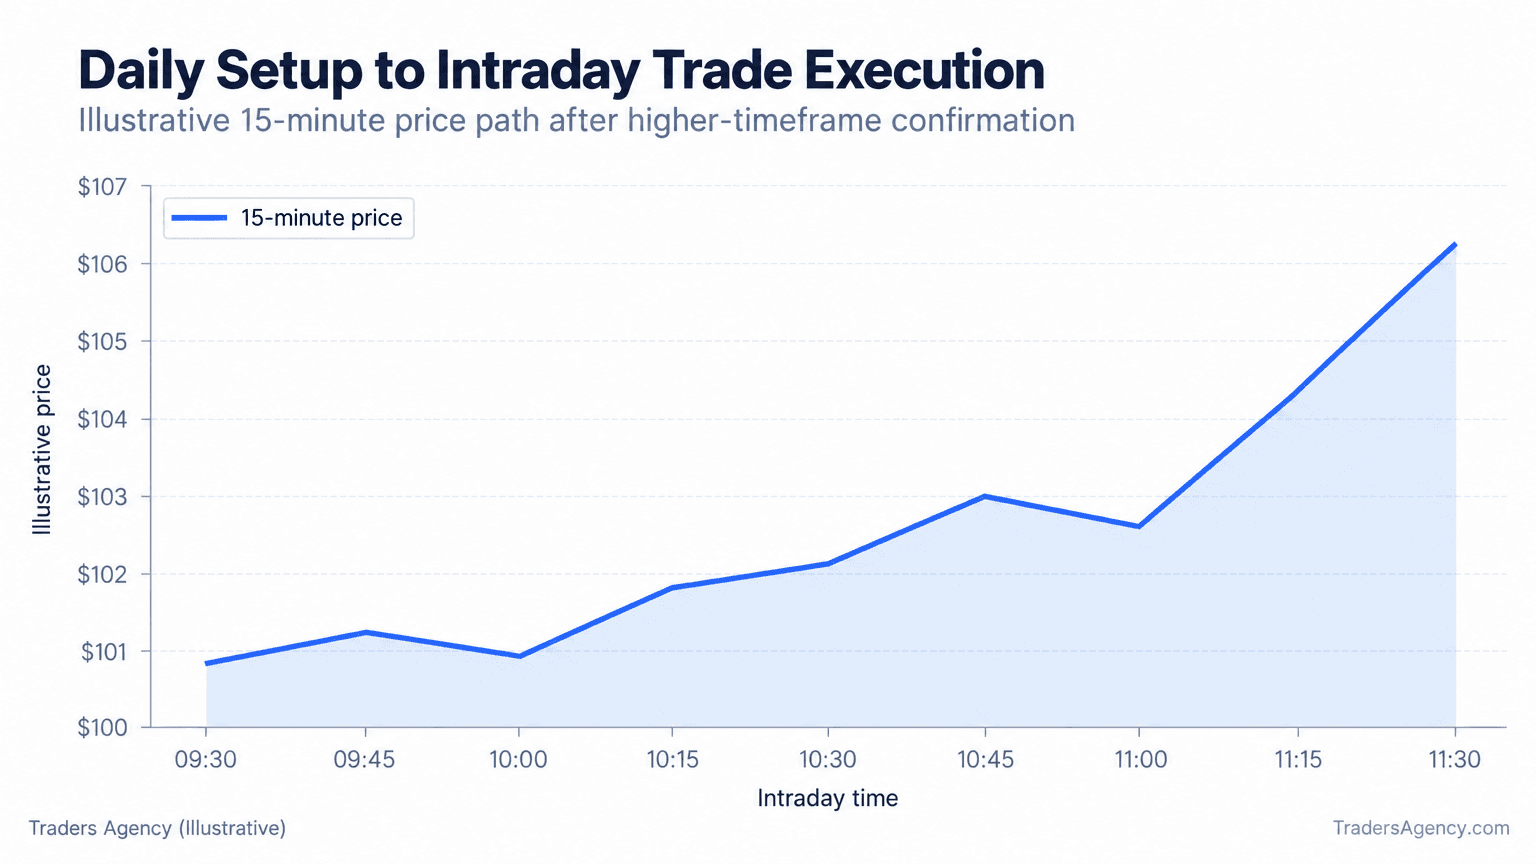
The Trigger: You drop to the 15-minute chart and watch for a bounce confirmation. Price holds above $99.80, forms a higher low, and breaks above a short-term 15-minute trendline at $102.
| Parameter | Value |
|---|---|
| Entry | $102.00 on the 15-minute breakout |
| Stop Loss | $99.80 (at the intraday swing low, inside the daily support zone) |
| Target | $106.00 (next daily resistance zone) |
| Risk per Share | $2.20 |
| Reward per Share | $4.00 |
| Reward-to-Risk Ratio | roughly 1.8:1 |
| Scenario | What Happens | Result per Share |
|---|---|---|
| Best Case | Price moves directly to $106, hitting target within a few sessions, matching the daily trend's momentum | +$4.00 |
| Worst Case | Price breaks $102, stalls, and reverses back through $99.80, stopping you out | -$2.20 |
| Most Likely Case | Price moves choppily toward the target, testing your patience with a pullback or two before hitting target or stop | Variable |
This happens, and it's why the stop placement at the intraday low inside daily support matters. Choppy paths toward the target are normal and expected even when the setup is valid.
Five Core Approaches Worth Knowing
- Trend confirmation strategy: Trade only in the direction of the higher timeframe trend, using the lower timeframe purely for entry timing.
- Pullback strategy: Wait for price to retrace to a higher timeframe support or resistance level, then look for an intraday reversal signal.
- Breakout confirmation strategy: Use the higher timeframe to identify a key level, then require the lower timeframe to close beyond it with volume before entering.
- Divergence strategy: Look for bullish divergence between price and a momentum indicator like RSI on the lower timeframe while the higher timeframe uptrend remains intact, signaling a potential entry on a dip.
- Range-to-trend strategy: Identify a higher timeframe range, then use the lower timeframe to catch the breakout that signals the range is ending.
Most charting platforms let you sync multiple timeframe windows side by side, which makes this workflow significantly faster once you've practiced it a few times.
Common Multi-Timeframe Analysis Mistakes to Avoid
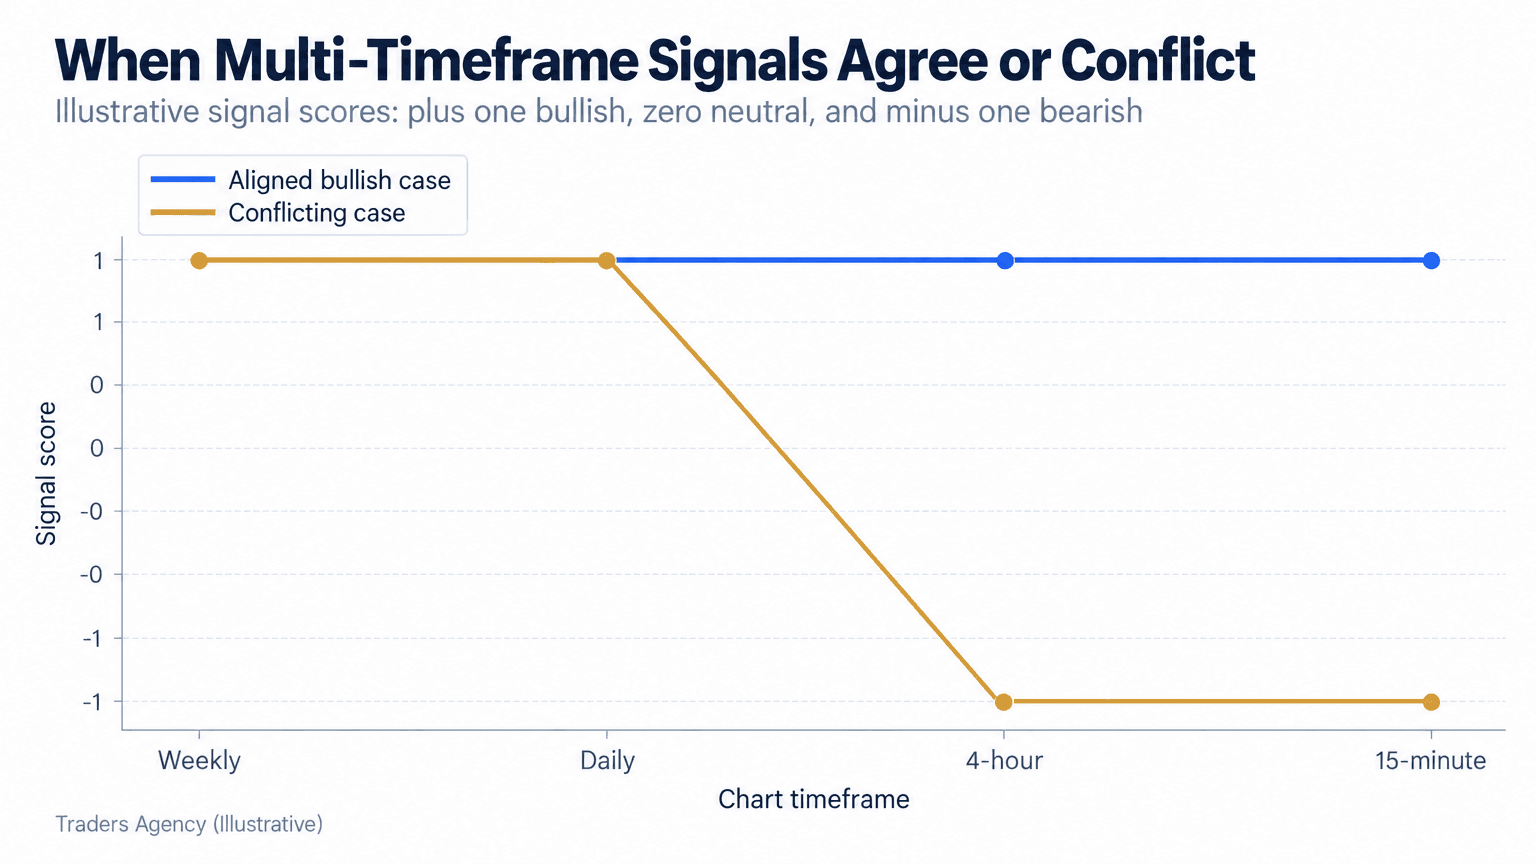
The biggest mistake traders make is giving the lower timeframe equal weight to the higher timeframe when the two disagree. If your daily chart says downtrend and your 15-minute chart flashes a bullish signal, that signal is noise within a bigger down move, not a new uptrend.
Watch Out: When your timeframes disagree, the higher timeframe wins. A bullish signal on a 15-minute chart inside a daily downtrend is noise, not a new trend.
Other Mistakes We See Often
- Constant timeframe switching: Flipping between five or six charts until you find one that agrees with the trade you already want to make. This is confirmation bias disguised as analysis.
- Ignoring the higher timeframe entirely once in a trade: You confirm trend before entry, then forget to recheck it. Trends change, and your bias should update with new daily or weekly closes.
- Using indicator settings that don't match the timeframe: A 14-period RSI on a 5-minute chart behaves very differently than on a daily chart. Adjust your expectations accordingly.
- Overcomplicating with too many timeframes: Three is usually plenty. Watching six charts at once slows decision-making and increases the odds of conflicting signals paralyzing you.
- Treating multi-timeframe analysis as a guarantee: Even perfect alignment across weekly, daily, and intraday charts doesn't guarantee a winning trade. It improves probability, not certainty.
The fix isn't a secret indicator, it's a clear rule for which timeframe wins when there's conflict. The higher one does.
When Should You Not Use Multi-Timeframe Analysis?
Multi-timeframe analysis struggles during low-liquidity conditions and major news events, when price can gap or spike violently regardless of what any chart's structure suggests. In these environments, technical levels across any timeframe can be overrun in seconds.
Situations Where We'd Skip or Scale Back This Approach
- Earnings releases, Fed announcements, and major economic data drops: Price action becomes driven by headlines, not technical structure, and multi-timeframe alignment stops being predictive.
- Thinly traded small-cap stocks: Wide spreads and erratic volume make intraday chart patterns unreliable, even if the daily chart looks clean.
- The first and last few minutes of a trading session: Volatility spikes and false breakouts are common, which can trigger premature entries on a lower timeframe before the higher timeframe setup has actually played out.
- Choppy, range-bound markets with no clear higher timeframe trend: If the daily and weekly charts show no discernible direction, intraday signals have nothing meaningful to align with.
Watch Out: During earnings, Fed announcements, and other major news events, we'd rather sit out or significantly reduce position size than force a trade using a framework that isn't suited to the conditions.
Risk Management and Practical Fit
Multi-timeframe analysis works best as a filter, not a standalone signal generator. Pair it with your existing indicators, whether that's moving averages, RSI, volume analysis, or chart patterns, and use the multi-timeframe check as confirmation before you commit capital.
A Few Rules We Teach Our Members
- Never risk more than 1% to 2% of account equity on a single trade, regardless of how aligned the timeframes appear.
- Set your stop loss based on the intraday chart's structure, not an arbitrary dollar amount.
- Size your position down when the higher timeframe trend is weak or ambiguous, even if the intraday setup looks clean.
- Re-check the higher timeframe at least once per day while a swing position is open.
For traders who want a written reference, building your own multi-timeframe trading strategy document with your specific timeframe pairings, entry rules, and risk parameters written down is one of the simplest ways to stay consistent instead of improvising each time you sit down at the charts. This lines up with a principle you will find across mainstream trading education, including exchange-run resources like Cboe, and most major charting platforms: context from a higher timeframe reduces false signals on a lower one.
Multi-timeframe analysis isn't about finding a perfect setup. It's about stacking enough evidence across timeframes that the trades you do take have a real structural reason behind them.
Want expert trading insights delivered daily?
Join thousands of traders who rely on Traders Agency for market analysis and trade ideas.
Join Traders AgencyDISCLAIMER: Traders Agency does not offer financial advice. The information provided is for educational purposes only and should not be considered financial advice. Traders Agency is not responsible for any financial losses or consequences resulting from the use of the information provided. Trading carries inherent risks and may not be suitable for all individuals. You are advised to conduct your own research and seek personalized advice before making any investment decisions, recognizing the potential risks and rewards involved.
See more from Traders Agency on Google
Make us a preferred source and our market analysis will appear more prominently in your Google Search, Top Stories, and AI results.
Add to Preferred Sources