
You've probably seen this happen on a chart: price climbs steadily, stalls at the exact same level three times, then drops hard. Or it falls, bounces off the same floor twice, and rallies. That's not a coincidence. That's support and resistance at work, and it's one of the first real skills every trader needs to build. In this guide, we'll show you how to find these levels on your own charts, how to calculate them with a basic formula, and how to pair them with volume so you're not reacting to false signals.
Support and resistance levels are price points on a chart where an asset has historically struggled to fall below (support) or rise above (resistance). Traders use a support and resistance indicator or simple manual drawing to mark these zones because price tends to react at them again and again. This is a beginner-friendly walkthrough, so we'll define every term as we go.
What Are Support and Resistance Levels?
Bottom Line: Support and resistance mark price zones where buyers or sellers have repeatedly reacted, but the levels only hold value when paired with volume confirmation, a retest, and proper risk control. Treat them as a foundation for a trade, not a standalone signal to act on.
Support is a price area where buying pressure has historically stepped in to stop a decline. Resistance is a price area where selling pressure has historically capped a rally. Together, these are the two most basic reference points in all of technical analysis.
Think of support as a floor and resistance as a ceiling. Price bounces between them like a ball in a room. Every time price approaches the floor, buyers show up because they see "value." Every time price nears the ceiling, sellers show up because they think it's "expensive." This is simple supply and demand, playing out visibly on a chart.
Here's what makes support and resistance levels in trading so useful: they're visual and they repeat. A support and resistance indicator on most charting platforms will automatically highlight areas where price reversed multiple times in the past, which saves you from having to eyeball every swing high and low yourself.
Key Concept: Support and resistance levels are zones, not exact lines. The more times a level has been tested, the more traders are watching it, and old highs and lows are the simplest starting point for drawing your first levels.
How Do I Find Support and Resistance Levels?
To find support and resistance levels, scan a price chart for areas where price reversed direction at least twice, then draw a horizontal line connecting those points. The more touches a level has, the more significant it tends to be.
Here's the sequence we teach:
- Step 1: Start on the highest timeframe. Open the daily chart and look left across several months of price history.
- Step 2: Mark the obvious turns. Find the clearest swing highs (peaks) and swing lows (valleys), then draw horizontal lines through them. Those are your starting support and resistance levels.
- Step 3: Zoom in to refine. Drop to lower timeframes to tighten up your entry once the bigger structure is mapped.
- Step 4: Draw by hand before automating. Many platforms, TradingView included, have tools that auto-detect horizontal zones. Use them later. Drawing your own lines first trains your eye to recognize structure without relying entirely on software.
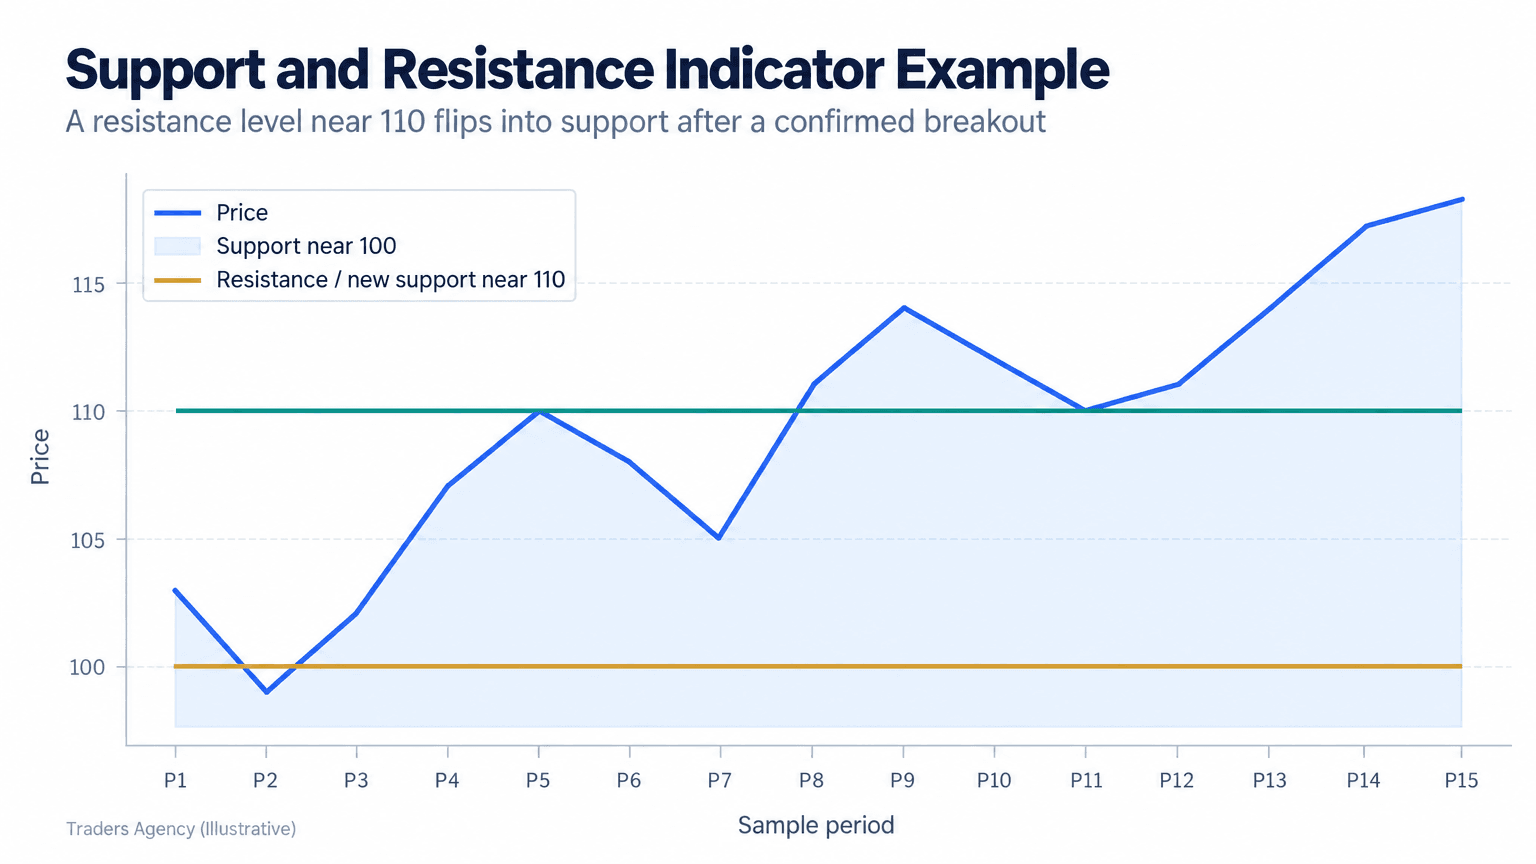
Notice in the chart above how price tests 100 as a floor multiple times, then breaks through 110. Once that resistance breaks, it becomes the new support floor on the retest. This flip is one of the most widely watched behaviors in price action.
What Is S1, S2, S3, R1, R2, R3 in Trading?
S1, S2, S3 and R1, R2, R3 are calculated support and resistance levels derived from the previous session's high, low, and close using a support and resistance formula, commonly called pivot points. S1 and R1 are the nearest levels to the current price, while S2/R2 and S3/R3 represent increasingly distant targets.
The classic pivot point formula works like this:
- Pivot Point (P) = (High + Low + Close) / 3
- R1 = (2 × P) - Low
- S1 = (2 × P) - High
- R2 = P + (High - Low)
- S2 = P - (High - Low)
Let's run the numbers. Say yesterday's session had a high of 105, a low of 95, and a close of 102.
| Level | Calculation | Result |
|---|---|---|
| R2 | 100.67 + (105 - 95) | 110.67 |
| R1 | (2 × 100.67) - 95 | 106.34 |
| Pivot Point (P) | (105 + 95 + 102) / 3 | 100.67 |
| S1 | (2 × 100.67) - 105 | 96.34 |
| S2 | 100.67 - (105 - 95) | 90.67 |
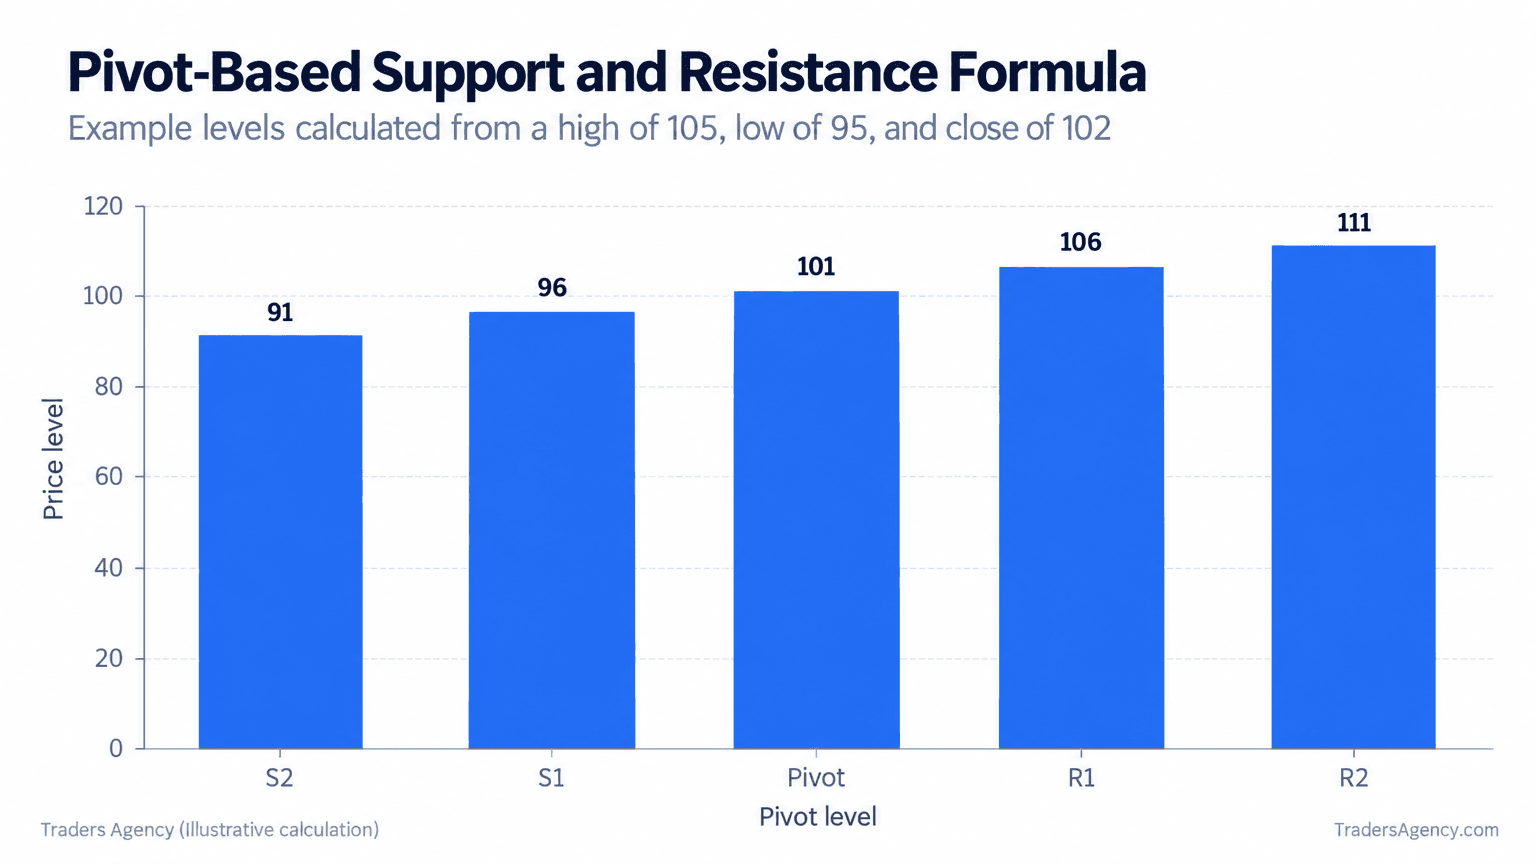
Day traders use these calculated levels alongside hand-drawn horizontal support and resistance to spot where price is likely to pause or reverse during the session. If you trade futures or index products, the session hours and daily settlement data published by the CME Group will tell you which high, low, and close to feed into this formula.
Want expert trading insights delivered daily?
Join thousands of traders who rely on Traders Agency for market analysis and trade ideas.
Join Traders AgencySupport and Resistance Levels Trading Strategy
A basic support and resistance levels strategy involves buying near support with a stop below the level, and selling or shorting near resistance with a stop above it. The goal is to enter where the risk is smallest, since a clear invalidation point sits just below (or above) your entry.
Step-by-Step: Example Trade
Let's say a stock has bounced off $40 three separate times over the past two months. That's your support. It has also stalled at $48 twice during the same period. That's your resistance.
- Step 1: Identify the Setup. Price pulls back toward $40 again on light selling pressure, with no major news driving the move.
- Step 2: Execute the Entry. You buy at $40.50, slightly above the level, to confirm buyers are actually showing up.
- Step 3: Define Your Risk. Stop loss goes at $38.50, below the support zone, risking $2 per share.
- Step 4: Set the Target. Take profit at $47.50, just under resistance, for a reward of $7 per share.
- Step 5: Manage the Position. Honor the stop without exception, and consider scaling out partway if price stalls well short of the target.
| Scenario | What Happens | Result per Share |
|---|---|---|
| Best Case | Price rallies to the $48 resistance area, target fills at $47.50 | +$7.00 (3.5:1 reward-to-risk) |
| Base Case | Price chops, retests $40, you scale out or get stopped | Small gain to small loss |
| Worst Case | Support fails, price breaks below $38.50 | -$2.00 (stop limits the damage) |
This is a simple, repeatable framework, but it only works if you respect the stop loss every single time.
Using Round Numbers as Psychological Support and Resistance
Round numbers like $50, $100, or 1.2000 on a currency pair act as psychological support and resistance because large numbers of traders place orders around them. This is especially visible in support and resistance levels forex charts, where pairs often hesitate at whole-number price levels like 1.1000 or 1.2000.
There's no magic to this. Humans round numbers in their heads, and so do the algorithms that institutions program to place large orders. When thousands of stop losses, take-profits, and limit orders cluster near the same price, that price becomes a real wall of supply or demand, even without a prior technical reason.
What Happens When a Support or Resistance Level Breaks?
When a resistance level breaks, it commonly flips and becomes a new support level on the next pullback. The reverse is also true: a broken support level often becomes resistance once price rallies back to retest it.
Here's a worked example. A stock has resistance at $75 that it's tested four times without breaking. On the fifth attempt, it finally closes above $75 on strong buying volume. Over the next week, it pulls back to $75.20 before bouncing higher again. That retest and bounce confirms $75 has flipped from a ceiling into a floor.
The logic behind this flip is straightforward:
- Traders who sold at $75 expecting resistance to hold are now underwater and may buy back at breakeven, creating new demand at that price.
- Traders who missed the breakout see the pullback to $75 as a second chance to buy, adding further demand.
Key Concept: Broken resistance becomes support, and broken support becomes resistance. This role reversal is one of the most widely watched behaviors in price action, and it works identically in both directions.
What Are the Best Timeframes for Support and Resistance Levels?
Support and resistance levels tend to become more reliable as you move to higher timeframes, since daily and weekly charts filter out short-term noise and reflect decisions made by larger, more committed market participants.
A level drawn on a 5-minute chart might get tested and broken within the hour. A level drawn on the daily or weekly chart has often survived weeks or months of selling and buying pressure, which gives it more weight.
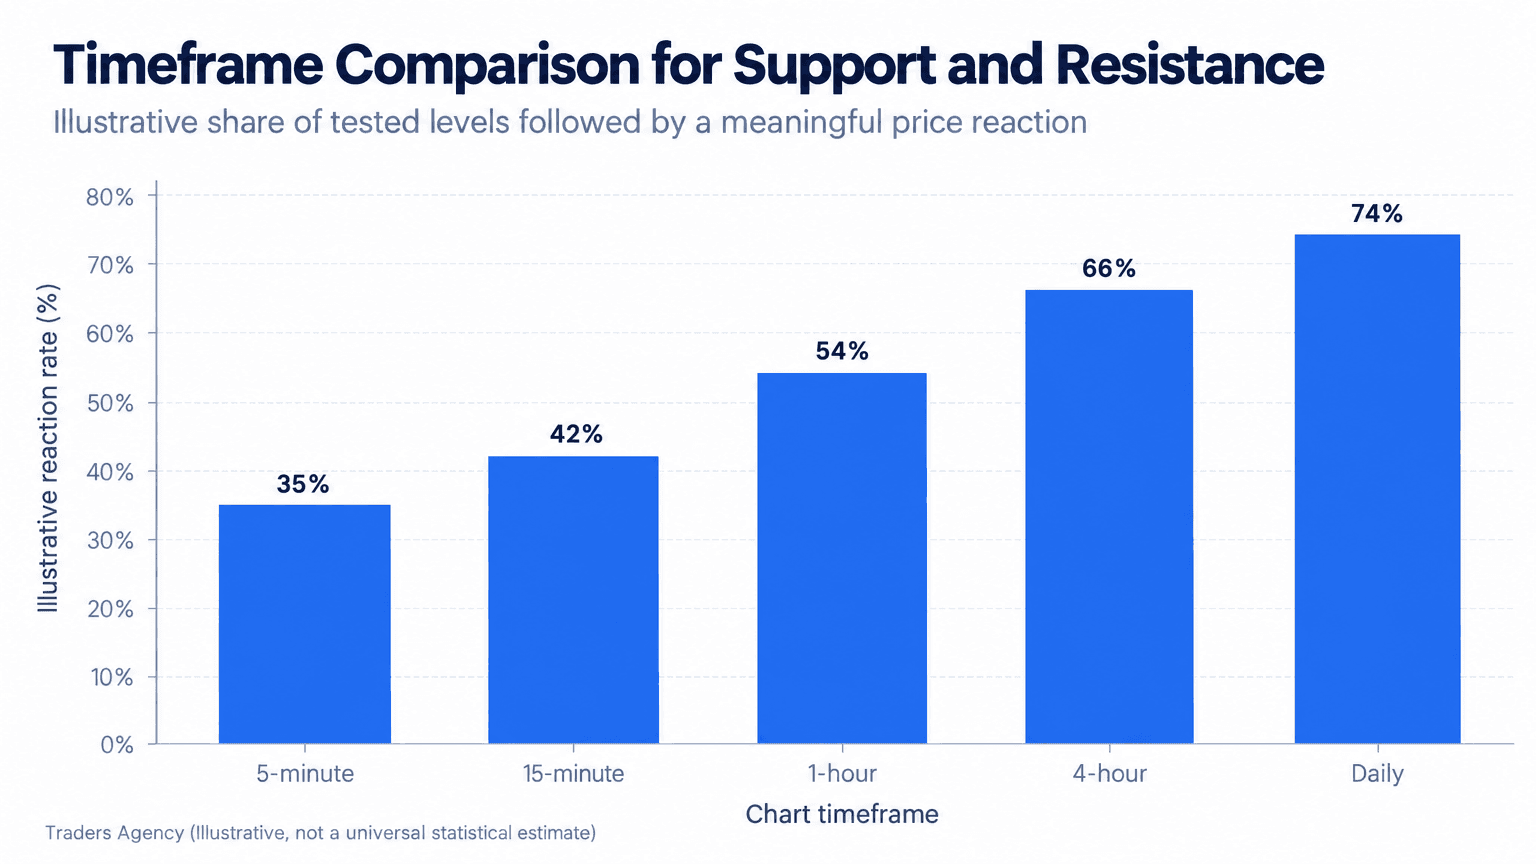
We generally recommend beginners anchor their support and resistance levels chart analysis on the daily timeframe first, then drop down to 1-hour or 15-minute charts for precise entries.
How Do You Combine Support and Resistance with Volume for Confirmation?
Volume, the number of shares or contracts traded in a period, tells you whether a support or resistance break is likely to hold or fail. A breakout on low volume is more likely to reverse, while a breakout on high volume suggests real conviction behind the move.
Here's the simple rule we use: look for volume at least 1.5 times the recent average when price breaks a key level. Without that confirmation, treat the breakout with caution, since it may just be noise.
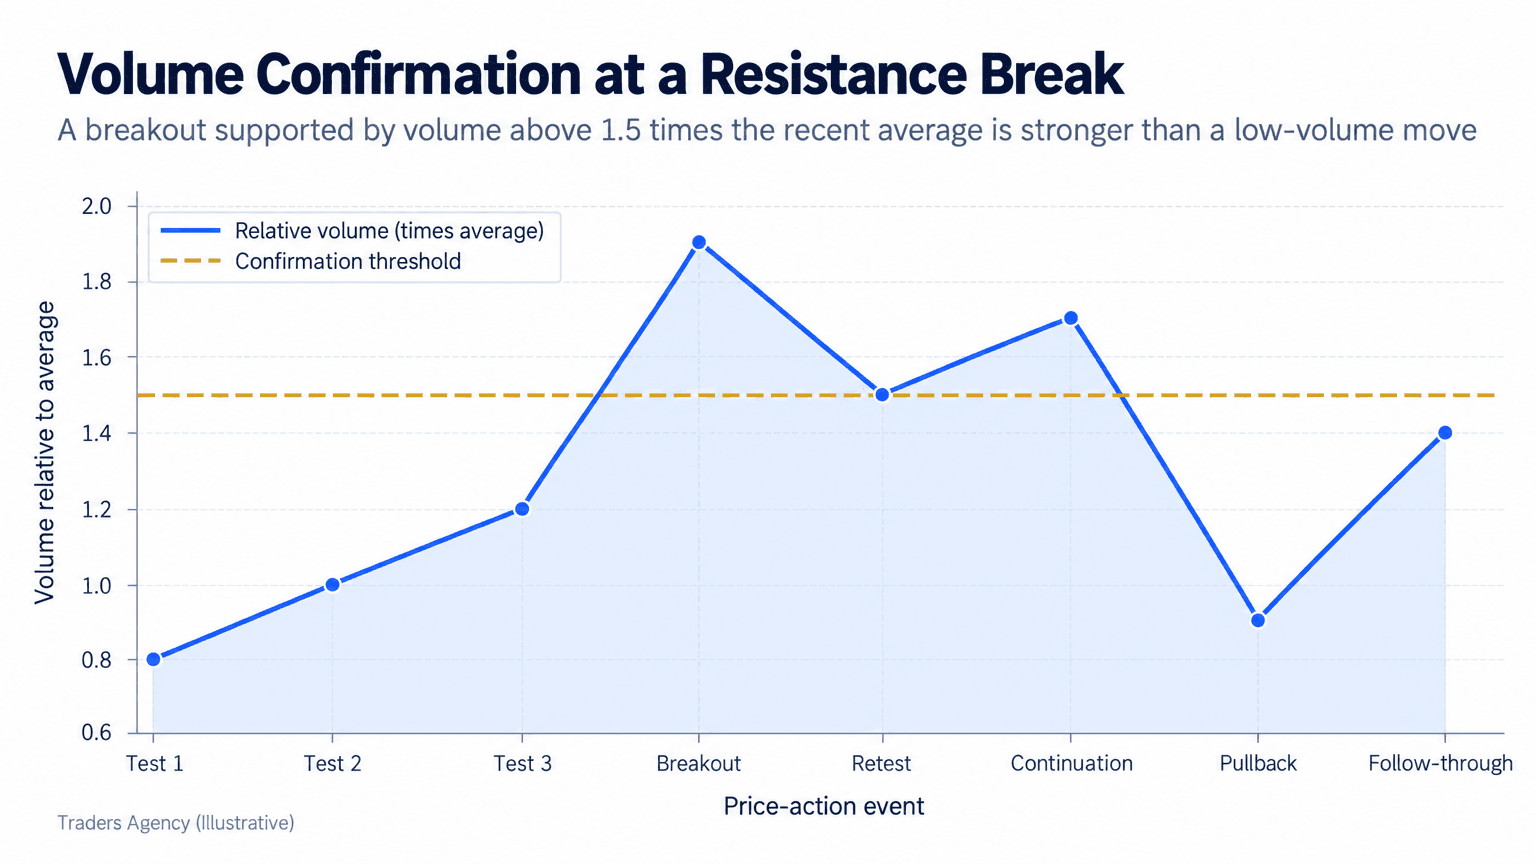
If you see a stock push through resistance on average or below-average volume, we'd treat that as a warning sign rather than a green light.
What Is the Difference Between Support Level and Resistance Level?
A support level is a price floor where buying interest has historically stopped declines, while a resistance level is a price ceiling where selling interest has historically stopped rallies. They sit on opposite sides of current price and serve opposite roles in a trader's plan.
| Feature | Support | Resistance |
|---|---|---|
| Position vs. price | Below current price | Above current price |
| Dominant participant | Buyers | Sellers |
| Typical use | Entry zone for longs, target for shorts | Entry zone for shorts, target for longs |
| Stop placement | Just below the zone | Just above the zone |
| On a break | Often becomes resistance | Often becomes support |
Both are drawn the same way, using prior highs and lows, round numbers, or pivot formulas. The only real difference is their position relative to price and whether they attract buyers or sellers.
When Should You Avoid the Support and Resistance Strategy?
Support and resistance works best in markets that are ranging or trending in a clear, orderly way. It becomes less reliable during high-volatility news events, earnings releases, or thin, illiquid sessions where price can gap straight through levels without any warning.
A few practical risk rules we teach:
- Never risk more than 1-2% of your account on a single support or resistance trade.
- Always place your stop loss just beyond the level, not exactly on it, since levels are zones rather than precise lines.
- Avoid trading a level the first time price approaches it after major news. Wait for the retest.
- Combine levels with volume and, if you use them, basic trend tools like a moving average for added confidence.
Watch Out: Support and resistance is not a standalone system. It's a foundation you layer other tools on top of. Trading a level with no stop loss, no volume confirmation, and no position sizing rule is how beginners turn a good concept into a losing account.
That's exactly how we teach it inside Traders Agency: levels first, then confirmation, then risk control, in that order every time.
Want expert trading insights delivered daily?
Join thousands of traders who rely on Traders Agency for market analysis and trade ideas.
Join Traders AgencyDISCLAIMER: Traders Agency does not offer financial advice. The information provided is for educational purposes only and should not be considered financial advice. Traders Agency is not responsible for any financial losses or consequences resulting from the use of the information provided. Trading carries inherent risks and may not be suitable for all individuals. You are advised to conduct your own research and seek personalized advice before making any investment decisions, recognizing the potential risks and rewards involved.
See more from Traders Agency on Google
Make us a preferred source and our market analysis will appear more prominently in your Google Search, Top Stories, and AI results.
Add to Preferred Sources