
The PEG ratio divides a company's price-to-earnings ratio by its expected earnings growth rate, giving you a fast way to judge whether a stock's price is reasonable relative to how quickly it's growing. A PEG ratio near 1.0 has traditionally been viewed as fair value, while readings meaningfully above or below that line tell very different stories. By the end of this guide, you'll know how to calculate it, where to find the inputs, and exactly where this metric quietly falls apart.
You've probably seen this play out: a stock trades at a P/E ratio of 40 and everyone online calls it "overpriced," while another sits at a P/E of 12 and gets labeled a "bargain." But P/E alone tells you nothing about how fast each company is growing. That's the gap the PEG ratio was built to fill.
We'll walk you through the formula, a full worked example, sector benchmarks, and the real limitations our team flags before anyone uses this number to make a decision.
What Is the PEG Ratio?
Bottom Line: The PEG ratio adjusts the P/E ratio for expected earnings growth, with a reading near 1.0 traditionally seen as fair value, but it's only useful as one screen among several. Because it relies on forecasted growth rates rather than fact, and breaks down for unprofitable or early-stage companies, it should be paired with revenue trends, margins, and balance sheet health, never used as a standalone buy signal.
The PEG ratio (price/earnings to growth ratio) takes the standard P/E ratio and adjusts it for a company's expected growth rate. Instead of only asking "is this stock expensive," it asks "is this stock expensive relative to how fast it's growing earnings."
Here's the logic. A company trading at a P/E of 30 sounds pricey in isolation. But if that company is growing earnings at 30% per year, the price might be entirely justified. A company trading at a P/E of 12 sounds cheap, but if earnings are only growing at 2% per year, it may not be a bargain at all.
Think of it like comparing two runners. One runs a 10-minute mile but is 8 years old. The other runs a 10-minute mile but is 35 and out of shape. Same raw number, completely different context. The PEG ratio is the "adjusted for context" version of the P/E ratio.
Key Concept: The PEG ratio answers a question P/E can't: is the price you're paying reasonable given the growth you're expecting? A reading near 1.0 is the traditional fair-value marker.
How Does the PEG Ratio Differ From the P/E Ratio?
The PEG ratio vs P/E ratio comparison comes down to one missing variable: growth. The P/E ratio measures price relative to current earnings and stops there. The PEG ratio layers in the expected growth rate, which makes it far more useful when you're comparing companies growing at very different speeds.
A mature utility and a fast-growing software company might both trade at a P/E of 25. Looking at P/E alone, they appear equally valued. Run the PEG ratio on both and you'll likely see a very different picture once growth rates enter the equation.
How Do You Calculate the PEG Ratio?
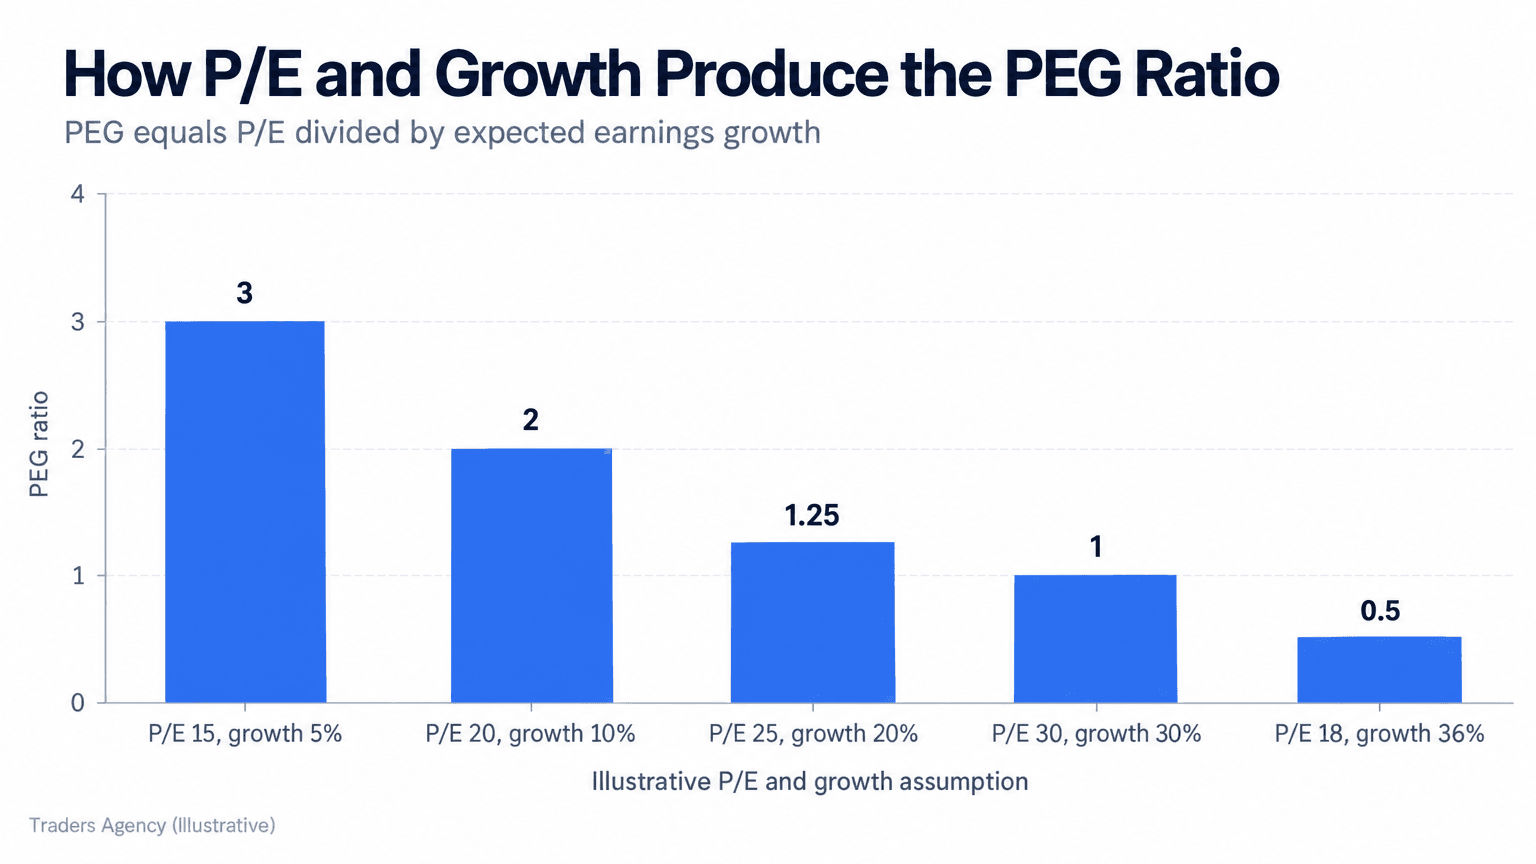
The formula is simple: PEG = P/E ratio ÷ annual earnings growth rate (expressed as a whole number). You need two inputs: the trailing or forward P/E ratio, and the projected annual earnings growth rate, usually covering the next 3 to 5 years.
- Step 1: Find the P/E ratio: Divide the current stock price by earnings per share (EPS). Most financial data sites and broker platforms display this directly, so you rarely need to calculate it by hand.
- Step 2: Find the growth rate estimate: This is typically an analyst consensus estimate for annual earnings growth, sourced from earnings reports, company guidance, or financial data providers.
- Step 3: Divide: Take the P/E and divide it by the growth rate as a whole number. A P/E of 20 with 10% expected growth gives you 20 ÷ 10 = 2.0.
Now compare that to a company with a P/E of 15 and expected growth of 20%. That PEG ratio is 15 ÷ 20 = 0.75, which traditionally reads as more attractively priced relative to its growth.
Worked Example: A Large E-Commerce Company
Here's a worked example using the kind of numbers traders search for when they look up "PEG ratio Amazon." These figures are illustrative, not live data. If a large e-commerce company trades at a P/E of 45 and analysts project 25% annual earnings growth, the math runs like this:
| Input | Value |
|---|---|
| Stock P/E ratio | 45 |
| Projected annual earnings growth | 25% |
| Calculation | 45 ÷ 25 |
| PEG ratio | 1.8 |
| Traditional fair-value marker | 1.0 |
| Read | Premium to growth, market pricing in optimism |
A PEG of 1.8 sits well above the textbook fair-value line, which tells you the market is pricing in quite a bit of optimism about future growth. That isn't automatically a reason to pass, but it does tell you the growth has to show up for the price to make sense.
Want expert trading insights delivered daily?
Join thousands of traders who rely on Traders Agency for market analysis and trade ideas.
Join Traders AgencyIs a 1.5 PEG Ratio Good?
A PEG ratio of 1.5 is generally considered moderate: not a screaming bargain, but not wildly overpriced either. It tells you the stock trades at a premium to its growth rate, though plenty of growth stocks in fast-moving sectors trade well above 1.5 without being automatically overvalued.
Context matters more than the raw number. A 1.5 PEG ratio on a slow-growing industrial company may signal the stock is pricier than its growth justifies. The same 1.5 on a company in an early growth phase, where estimates are deliberately conservative, might be perfectly reasonable.
Is a PEG Ratio Below 1 Good?
Traditionally, yes. A PEG ratio below 1.0 suggests a stock's price may be low relative to its expected earnings growth, and that's the core signal that made this metric popular in the first place.
But "good" doesn't mean "guaranteed." A PEG below 1.0 can also appear when the market doubts the growth estimate will actually be hit, or when a stock has been sold off for reasons that have nothing to do with its earnings outlook. A low PEG is an invitation to research, not a conclusion.
| PEG Ratio Range | Traditional Read | What We Actually Check |
|---|---|---|
| Below 1.0 | Potentially undervalued | Is the growth estimate credible, or is the market discounting it? |
| 1.0 | Fair value | Which growth window was used, 1-year or 5-year? |
| 1.0 to 1.5 | Moderate premium | How does it compare to sector peers? |
| Above 1.5 | Premium to growth | Is the sector normally priced this way? |
| Negative | No meaningful reading | Use a different valuation tool entirely |
What Counts as a Good PEG Ratio by Sector?
What qualifies as a "good" PEG ratio depends heavily on the sector. A reading considered attractive in banking can look overpriced in software, because growth expectations differ wildly across industries. Comparing PEG ratios only makes sense within similar sectors.
Looking at PEG ratio by sector patterns, slower-growth, capital-intensive sectors like financials and utilities often trade with lower typical PEG ratios, sometimes near 1.0 or below, because growth expectations are modest and more predictable. Technology and other high-growth sectors frequently trade at higher typical PEG ratios, since investors pay up for future growth they expect to materialize.
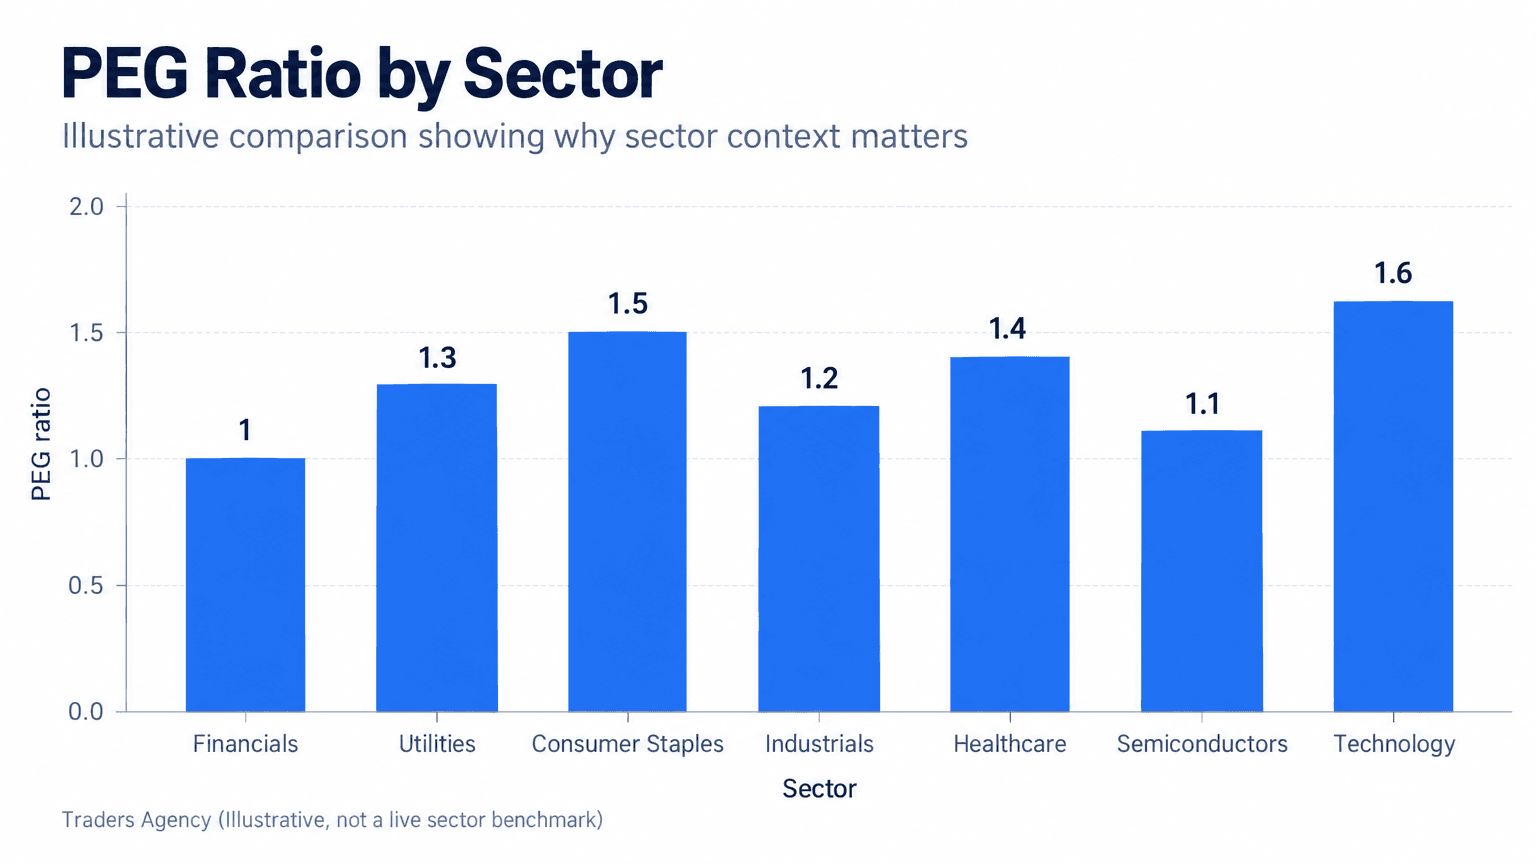
This is also where a search like "Nvidia current PEG ratio" comes up constantly. We won't quote a live number here, because it shifts daily with price moves and estimate revisions. The right way to think about any chip or semiconductor stock's PEG ratio is against other semiconductor peers, never against a bank or a utility.
Key Takeaways on Sector Comparisons
- Compare PEG ratios within the same sector, not across sectors.
- High-growth sectors naturally support higher PEG ratios than mature sectors.
- A PEG ratio that looks high in isolation may be completely normal for that industry.
- Always check which growth rate was used, since different data providers apply different estimate windows.
Why Is the PEG Ratio Used as a Screening Standard?
The PEG ratio earned its reputation as a fund manager's quick screening tool, popularized during the era of large growth-oriented mutual funds. The classic application favored companies with a PEG ratio well below 1.0, treating that as a sign the market hadn't fully priced in a company's growth potential.
That original approach always treated the PEG ratio as a starting point, not a final answer. The business itself, the competitive position, and the balance sheet still got examined before any capital was committed. We teach the same sequence: use PEG to narrow a list of candidates, then verify with real research.
Where Can You Find the Data to Calculate the PEG Ratio?
You don't need to build this from scratch every time. Most trading platforms and financial data sites publish PEG ratios directly beside the P/E ratio. If you'd rather calculate it yourself, here's where the inputs live:
- Stock price and EPS: available on any broker platform or financial data site, used to derive the P/E ratio.
- Earnings growth estimates: found in analyst consensus data, company earnings calls, or guidance published in quarterly filings.
- SEC filings: public companies file 10-K (annual) and 10-Q (quarterly) reports with the U.S. Securities and Exchange Commission, which contain the raw earnings figures behind these ratios.
- Financial screeners: many screening tools let you filter stocks by PEG ratio directly, which saves you the manual math.
What Are the Limitations of the PEG Ratio?
The PEG ratio carries one structural weakness: the growth rate is an estimate, not a fact. Those estimates come from analysts or company guidance, and both can be wrong, sometimes by a wide margin.
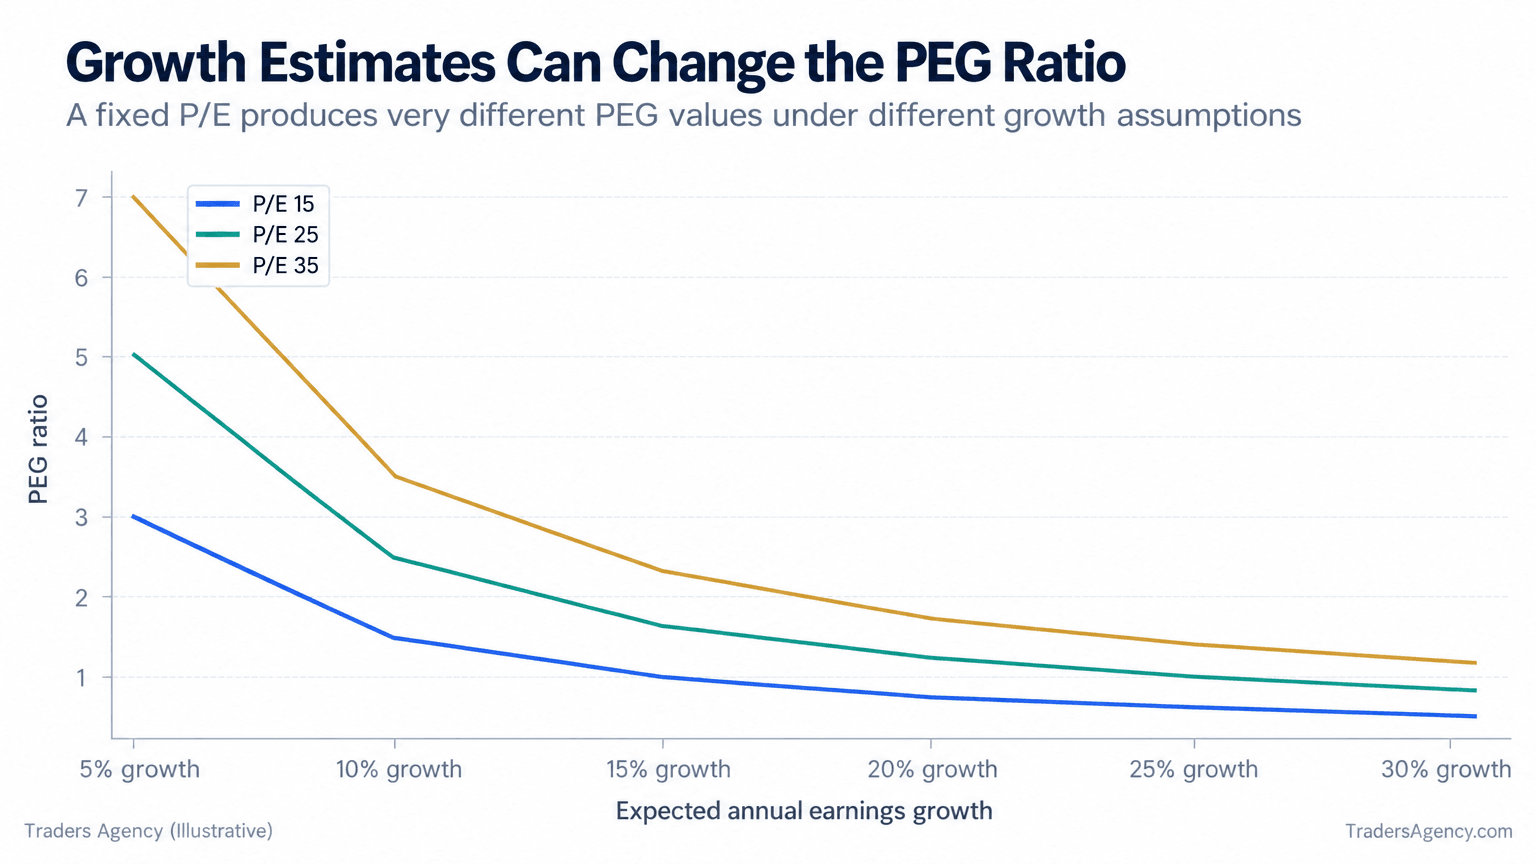
As the chart above shows, the same P/E ratio can produce wildly different PEG ratios depending purely on which growth estimate you plug in. Change the growth assumption and the PEG ratio moves significantly, even though nothing about the actual business changed.
Watch Out: Negative growth breaks the formula entirely. If earnings are expected to shrink, dividing by a negative number produces a negative PEG ratio with no meaningful interpretation. In that scenario the metric simply doesn't apply, and you need a different valuation tool.
Practical Application: When Should You Use the PEG Ratio?
The PEG ratio works best as a screening tool for comparing similarly sized companies within the same sector, especially when you're trying to separate "expensive but justified" from "expensive and overhyped." It's far less useful on its own for companies with unstable or negative earnings.
Common Mistakes We See: Comparing PEG ratios across unrelated sectors without adjusting expectations. Treating a single analyst's growth estimate as fact instead of a forecast. Ignoring debt levels, margins, and competitive position because the PEG ratio "looked good." Applying PEG to early-stage or unprofitable companies where earnings aren't yet meaningful.
Our team treats the PEG ratio as one screen among several, paired with revenue trends, margin direction, and balance sheet health. Never as a standalone buy signal. Position sizing and risk management still apply regardless of how attractive a PEG ratio looks on paper.
Want expert trading insights delivered daily?
Join thousands of traders who rely on Traders Agency for market analysis and trade ideas.
Join Traders AgencyDISCLAIMER: Traders Agency does not offer financial advice. The information provided is for educational purposes only and should not be considered financial advice. Traders Agency is not responsible for any financial losses or consequences resulting from the use of the information provided. Trading carries inherent risks and may not be suitable for all individuals. You are advised to conduct your own research and seek personalized advice before making any investment decisions, recognizing the potential risks and rewards involved.
See more from Traders Agency on Google
Make us a preferred source and our market analysis will appear more prominently in your Google Search, Top Stories, and AI results.
Add to Preferred Sources