
Support and resistance trading is a method of identifying price levels where a stock, currency pair, or asset has repeatedly stopped falling or stopped rising, then using those levels to plan entries, exits, and stop losses. These levels act like invisible floors and ceilings on a price chart. Once you learn to spot them, you'll start seeing the same patterns on almost every chart you open.
You've probably watched this play out before: a stock drops to a certain price, bounces hard, and climbs for days. Then weeks later, it falls back to that exact same price and bounces again. That's not luck. That's support and resistance doing its job, and it's one of the first real skills we teach every trader to build.
By the end of this guide, you'll know how to draw these levels yourself, confirm them with volume, spot when a broken support level flips into resistance, and sidestep the false breakout traps that catch beginners off guard.
What Is Support and Resistance in Trading?
Bottom Line: Support and resistance trading works because these levels reflect real trader memory and behavior, not magic numbers, so their value comes from confirming them with volume, multiple timeframes, and patience rather than drawing a line and trading it blindly. The real skill isn't spotting the levels, it's waiting for confirmation and avoiding false breakouts before committing capital.
Support is a price level where buying pressure has historically been strong enough to stop a decline and push price back up. Resistance is the opposite: a price level where selling pressure has repeatedly stopped a rally and pushed price back down.
Think of it like a floor and a ceiling in a room. Price bounces off the floor (support) and bumps its head on the ceiling (resistance), moving back and forth until it finally breaks through one side with enough force.
These levels form because traders remember prices. If a stock bounced at $100 three times last month, buyers start watching for that price again, and sellers who missed their exit near $110 start waiting to sell there too. That collective memory is what creates repeatable, tradable zones instead of random price action.
Key Concept: Support is a price floor where buyers have repeatedly stepped in. Resistance is a price ceiling where sellers have repeatedly taken control. Both exist because traders remember what happened at those prices and act on that memory again.
This is also where the support and resistance vs. supply and demand question comes up a lot for new traders. Support and resistance usually refers to specific price lines drawn from past highs and lows, while supply and demand trading focuses more on zones where large institutional orders likely entered the market. They overlap constantly, but support and resistance is the simpler, more visual starting point.
How Do You Draw Support and Resistance Levels on a Chart?
Drawing these levels is a skill you build with repetition, but the process itself is straightforward once you know what to look for. Here's the sequence we walk our members through:
- Step 1: Identify Previous Highs and Lows – Scan your chart for places where price clearly reversed direction. A swing low that got touched and bounced away from twice or more is a strong support candidate. A swing high that got rejected multiple times is a strong resistance candidate.
- Step 2: Draw a Horizontal Line – Connect those matching highs or matching lows with a flat horizontal line. You're not drawing a single, impossibly precise price. You're marking a zone, usually a small range rather than one exact number.
- Step 3: Watch for Round Numbers – Psychological levels like $50, $100, or $1,000 often act as support or resistance even without a clear chart pattern backing them up. Traders round their orders to these clean numbers, which creates clusters of buy and sell activity right at those prices.
- Step 4: Mark the Strength of Each Level – The more times price has tested a level without breaking through, the more significant that level becomes. A level tested five times carries more weight than one tested only once.
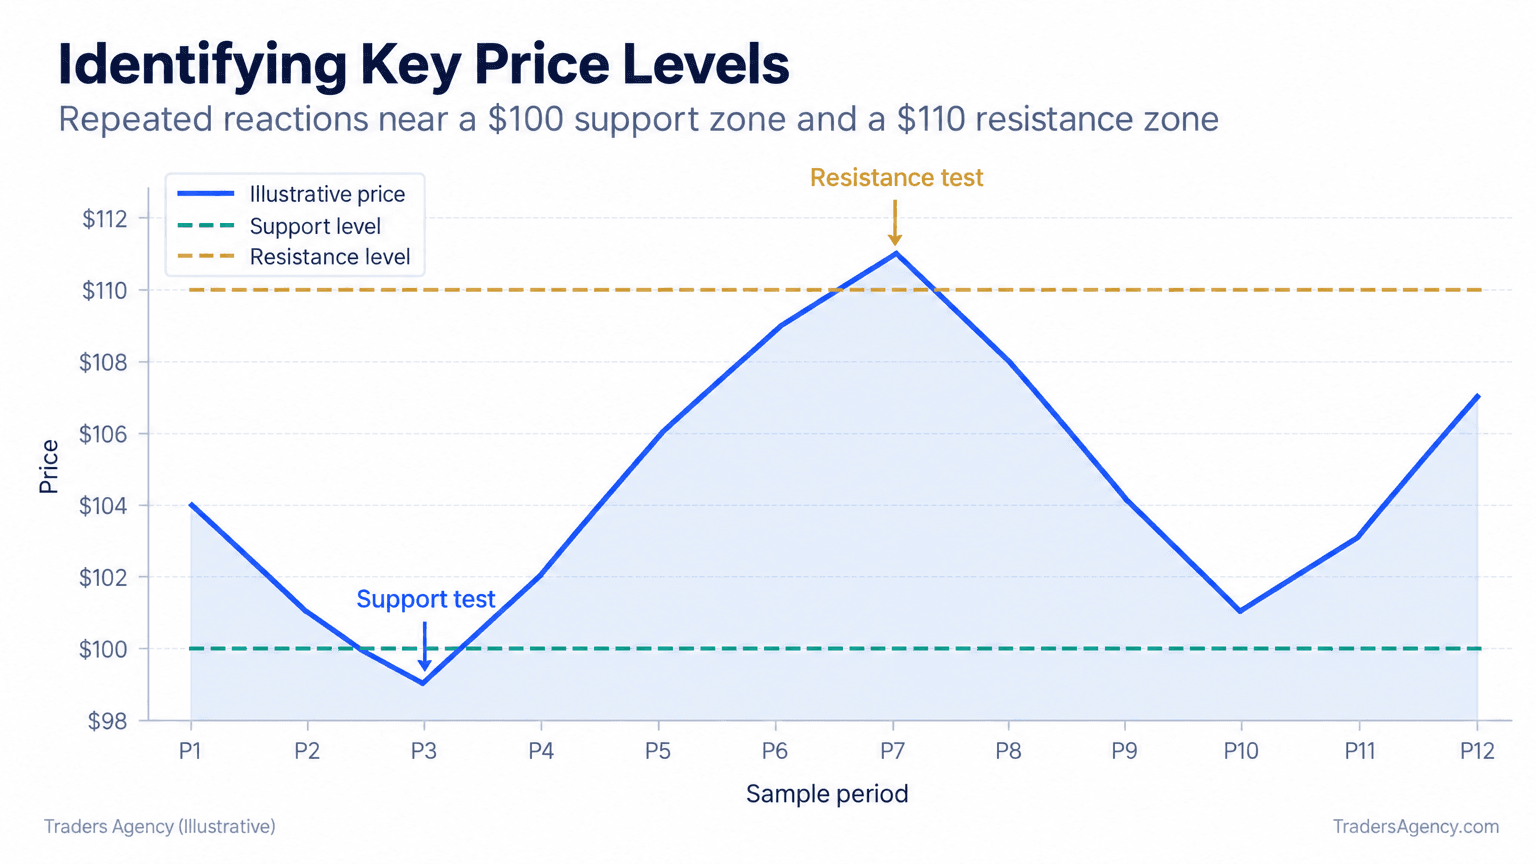
Notice how price keeps bouncing between the two horizontal lines above. That's a trading range, and it's the cleanest visual example of support and resistance doing exactly what it's supposed to do.
How Does Broken Support Become Resistance?
When price breaks below a support level and later rallies back up to it, that old support level frequently turns into new resistance. This happens because traders who bought at the old support and are now underwater often sell to break even as soon as price returns to that level.
This concept, sometimes called role reversal, is one of the most useful ideas in support and resistance trading. It explains why a stock that breaks down often struggles to climb back above the price it just fell through.
Here's a concrete example. Say a stock has held support at $100 for months. One day, bad earnings news pushes it down to $92. Over the next two weeks, buyers step back in and price climbs back toward $100. Instead of blowing through that old support level, price stalls right at $100 and reverses lower again.
| Stage | Price Level | What's Happening |
|---|---|---|
| Established Support | $100 | Buyers defend the level repeatedly for months |
| Breakdown | $92 | Bad news overwhelms buyers and price breaks through |
| Recovery Rally | $92 → $100 | Buyers step back in and push price toward the old floor |
| Role Reversal | $100 | Old support rejects price and now acts as resistance |
That stall happens for three reasons:
- Traders who bought near $100 before the drop are relieved to finally sell at break-even
- New sellers see $100 as a logical place to short, since it just failed as support
- Short sellers who entered on the breakdown often add to their positions near $100, since the level now caps the bounce
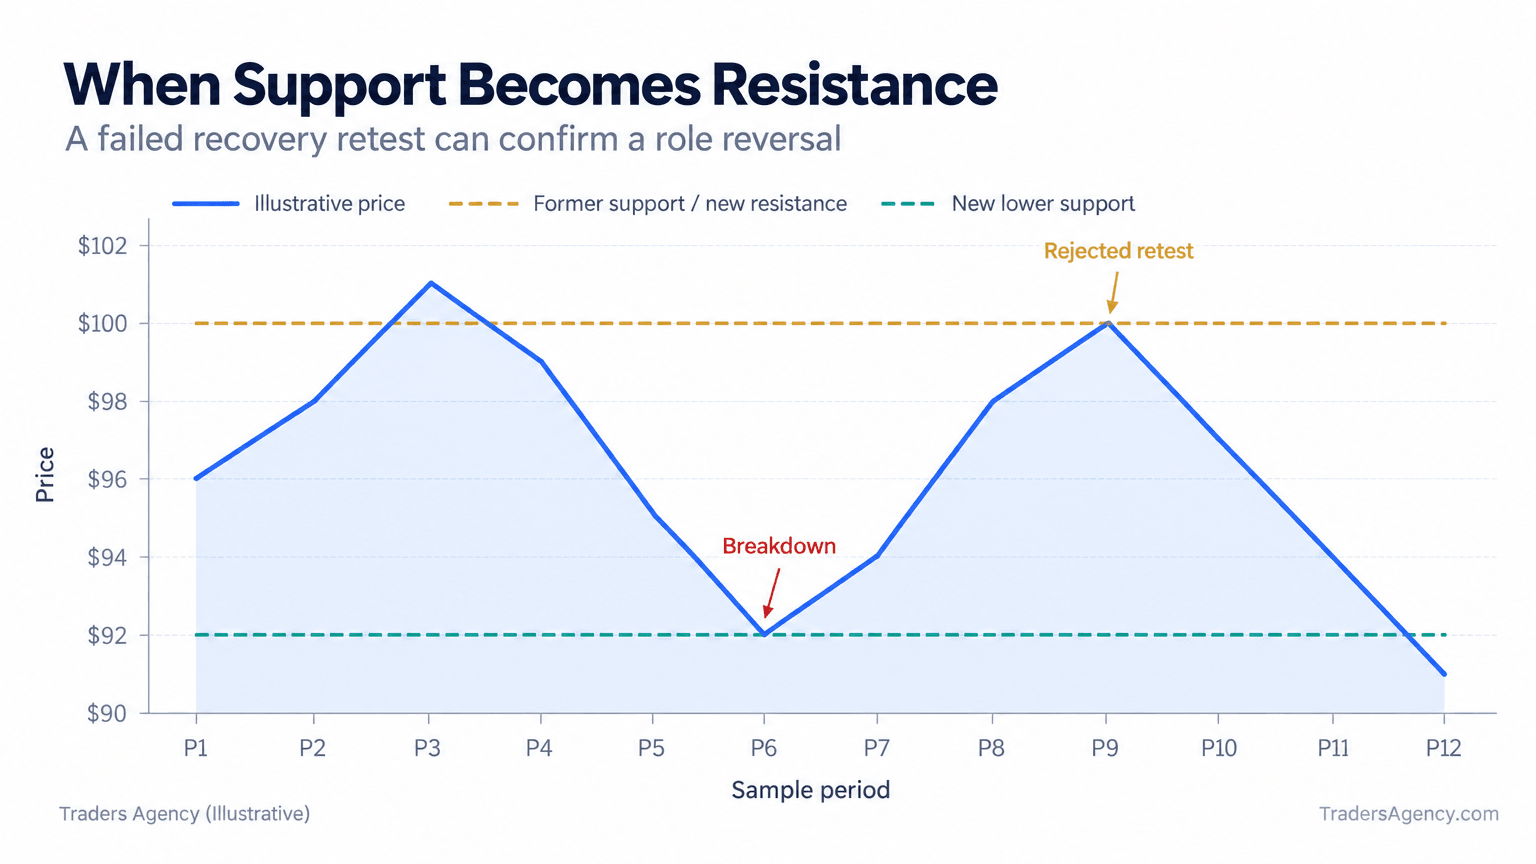
Understanding this flip is a big part of why experienced traders rarely buy right at an old support level without first checking whether that level recently broke down.
Want expert trading insights delivered daily?
Join thousands of traders who rely on Traders Agency for market analysis and trade ideas.
Join Traders AgencyHow Do You Use Volume to Confirm Support and Resistance Levels?
Price alone can mislead you. That's why we always pair horizontal levels with a volume reading before trusting a bounce or a breakdown.
Volume measures how many shares or contracts traded during a given period. When price tests a support or resistance level on heavy volume, that test carries far more weight than a quiet, low-volume touch. Exchange volume and open interest data for listed options and futures is published daily by venues like Cboe and the CME Group.
Here's what we look for:
- High volume on a bounce off support: a strong signal that buyers are genuinely stepping in, not just drifting
- High volume on a rejection at resistance: confirms sellers are actively defending that ceiling
- High volume on a breakout: suggests the move has real conviction and is less likely to be a trap
- Low volume on any of the above: treat the signal with caution, since it may reverse quickly
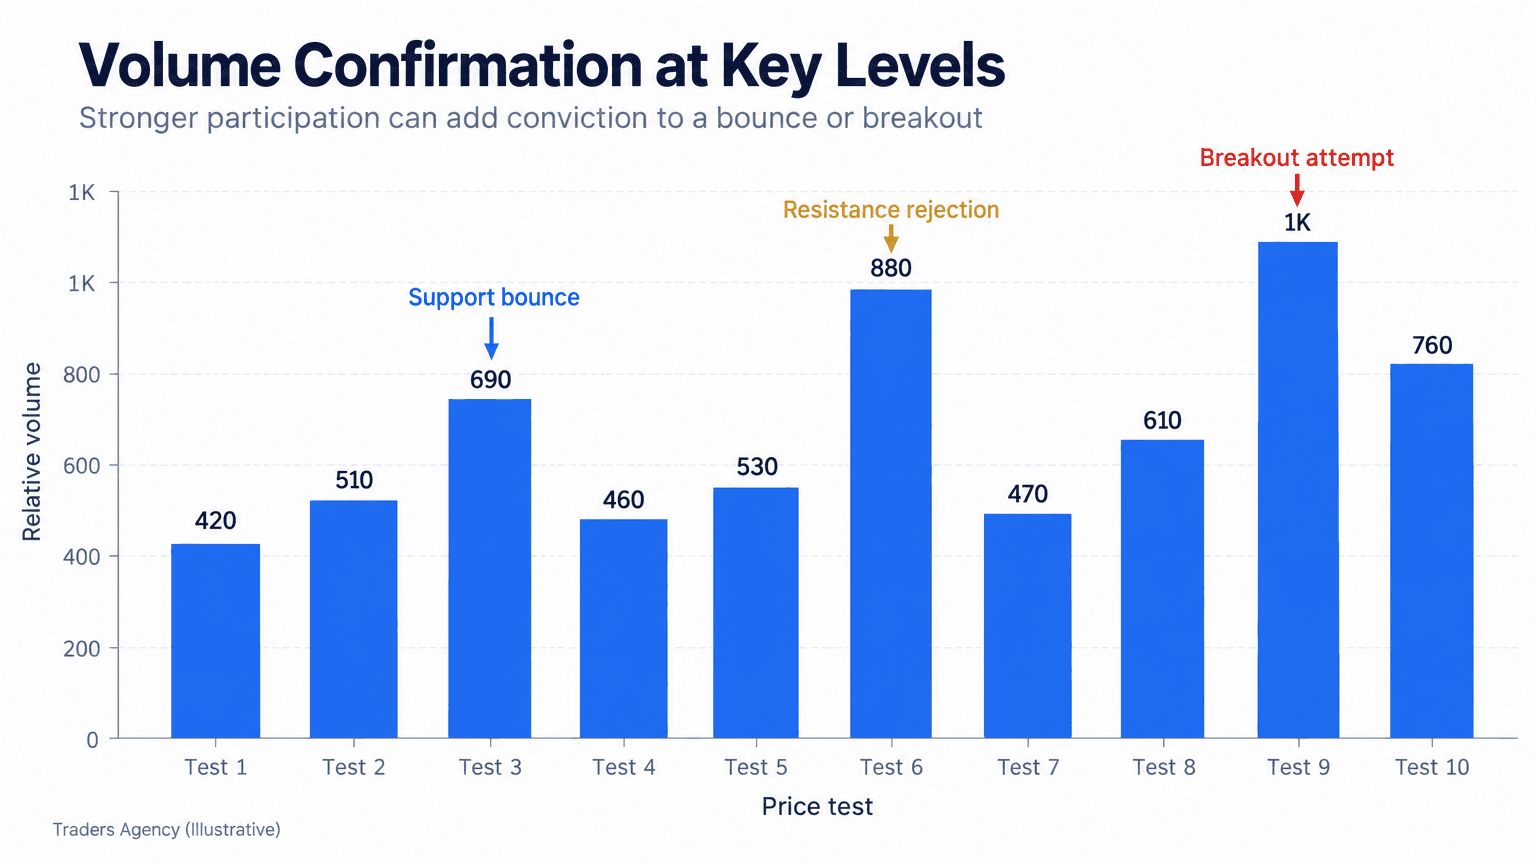
If you're building a full support and resistance trading strategy, volume should never be an afterthought. It's often the single detail that separates a real breakout from a fake one that snaps back within hours.
Which Time Frame Is Best for Support and Resistance Trading?
There's no single best time frame. Daily and weekly charts tend to produce the most reliable, longer-lasting levels, while shorter time frames like the 15-minute or hourly chart produce levels that work for quicker, more short-term trades.
The right choice depends entirely on your trading style. A swing trader holding positions for days or weeks should anchor their analysis on the daily chart, pulling in the weekly chart for bigger-picture context. A day trader closing positions before the bell will rely more on the 5-minute, 15-minute, or hourly chart.
| Trading Style | Primary Chart | Context Chart | Typical Hold |
|---|---|---|---|
| Position Trader | Weekly | Monthly | Months |
| Swing Trader | Daily | Weekly | Days to weeks |
| Day Trader | 15-minute | Hourly / Daily | Minutes to hours |
It really comes down to matching your chart to your holding period. Longer time frames filter out noise and tend to hold up better over time, which is why we teach beginners to start there before layering in shorter time frames.
Multiple Timeframe Confluence for Stronger Signals
Confluence happens when a support or resistance level lines up across more than one time frame at roughly the same price. These overlapping zones are far more reliable than a level that only appears on a single chart.
For example, if the weekly chart shows support at $98 to $100, the daily chart independently shows support near $100, and the 4-hour chart shows a minor support line at $99, you've got three time frames agreeing on roughly the same zone. That kind of agreement meaningfully increases your confidence in the level.
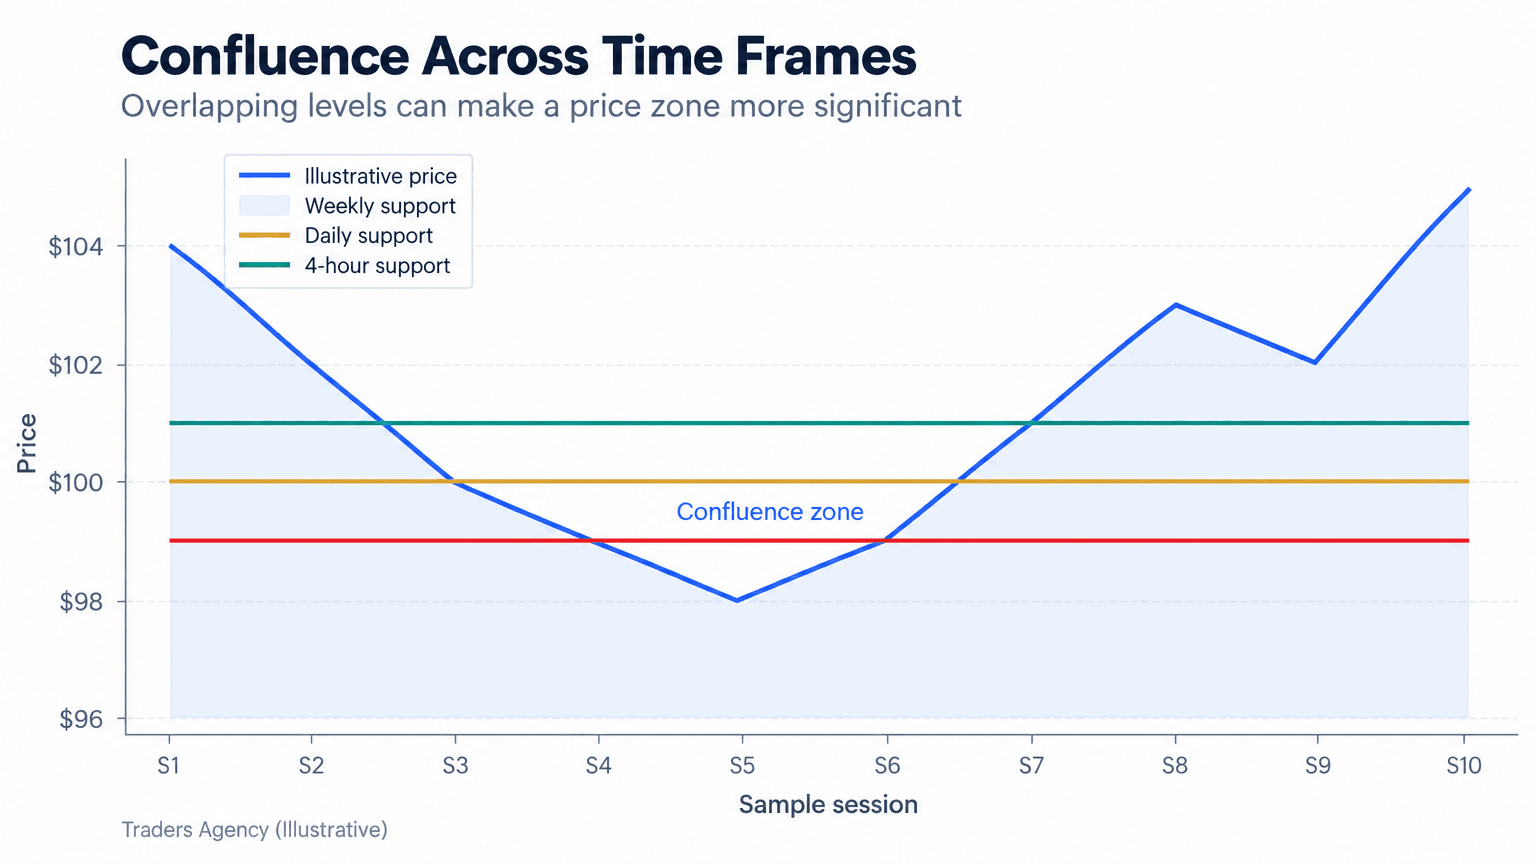
Remember This: Confluence doesn't guarantee a bounce, but it does shift probability in your favor. It's one of the clearest ways to improve your results with key levels without adding a single new indicator to your chart.
What Are the Most Common False Breakout Mistakes to Avoid?
A false breakout happens when price pushes through a support or resistance level, tempts traders into entering, then quickly reverses back inside the original range. These traps catch beginners more than almost any other pattern in technical analysis.
Here are the mistakes we see most often:
- Entering immediately on the break – jumping in before the candle closes beyond the level
- Ignoring volume – entering on a breakout that happened on weak, unconvincing participation
- Trading every level equally – instead of favoring levels tested multiple times across multiple time frames
- Skipping confirmation – not waiting for a retest of the broken level before entering
- Setting stops too tight – placing them right at the level itself, where normal price noise triggers an early exit
Watch Out: The most expensive false breakouts look the most convincing in the moment. If a breakout happens on light volume and you have no plan for being wrong, you're not trading the level, you're guessing at it.
New traders often ask about the 3-5-7 rule in this context, but it is a risk management guideline rather than a breakout filter: risk no more than 3% of your account on a single trade, keep no more than 5% exposed to any one market or correlated group, and target winners that are at least 7% larger than your average loss. It won't tell you whether a break is real, which is why we pair position sizing rules like this with patient confirmation at the level itself.
Practical Application: When to Use This Strategy
Support and resistance trading works best in markets that are ranging or showing clear, repeated turning points. It tends to struggle in fast-moving, news-driven conditions where price can blow through multiple levels in minutes.
We recommend using this approach when:
- Price has touched the same horizontal zone at least twice already
- Volume data is available to confirm the strength of the test
- You can check at least two time frames for confluence before entering
- You have a clear, pre-planned stop loss below support or above resistance
Be careful relying on this strategy alone during major earnings releases, Federal Reserve policy announcements, or other high-volatility economic data drops, since levels can be overrun instantly regardless of their historical strength.
A Simple Risk Management Framework
| Element | Our Guideline |
|---|---|
| Position Size | Risk no more than 1% to 2% of your account per trade |
| Stop Placement | Just beyond the level, not directly on top of it |
| Profit Target | The next major level in the direction of your trade |
| Confirmation | Wait for a retest or a volume-backed close beyond the level |
Many traders also combine key levels with moving averages, trendlines, or basic momentum indicators for extra confirmation. If you want to study this further, a well-structured support and resistance trading book or strategy guide can reinforce the chart-reading skills covered here with additional historical examples.
Start by marking two or three levels on a single chart you already follow. Watch how price behaves around them for a week before risking a dollar. That repetition is how this skill gets built.
Want expert trading insights delivered daily?
Join thousands of traders who rely on Traders Agency for market analysis and trade ideas.
Join Traders AgencyDISCLAIMER: Traders Agency does not offer financial advice. The information provided is for educational purposes only and should not be considered financial advice. Traders Agency is not responsible for any financial losses or consequences resulting from the use of the information provided. Trading carries inherent risks and may not be suitable for all individuals. You are advised to conduct your own research and seek personalized advice before making any investment decisions, recognizing the potential risks and rewards involved.
See more from Traders Agency on Google
Make us a preferred source and our market analysis will appear more prominently in your Google Search, Top Stories, and AI results.
Add to Preferred Sources