
You've probably stared at a chart with a strange squiggly line sitting below the price, wondering what it actually tells you. That line is the MACD, one of the most widely used momentum indicators in technical analysis, and it's one of the best places to start if you're new to reading charts. In this guide, our education team will show you exactly what MACD is, how to read its signals, and how to build a simple, repeatable MACD trading strategy you can practice on a demo account before risking real money.
A MACD strategy for beginners uses the Moving Average Convergence Divergence indicator to spot shifts in price momentum by tracking the relationship between two moving averages. Traders watch for crossovers, zero line crosses, and histogram changes to time entries and exits. It works best when paired with a second confirmation tool like RSI.
By the time you finish reading, you'll know how to set up MACD on your own chart, interpret buy and sell signals, and sidestep the mistakes that trip up most beginners. We'll also cover which timeframes work best, which settings to use, and which second indicator we recommend pairing with MACD for higher-conviction trades.
What Is The MACD Strategy And How Does It Work?
Bottom Line: MACD works best as a momentum guide, not a standalone signal, since crossovers and zero line crosses can misfire in sideways markets. Pairing it with a confirmation tool like RSI and practicing on a demo account first helps beginners filter out false signals before trading with real money.
The MACD strategy is a trend-following approach that uses the difference between two exponential moving averages (EMAs) to measure momentum. When the faster average pulls away from or drifts back toward the slower one, it signals that buying or selling pressure is either building or fading.
Here's the math behind it, explained simply:
- MACD Line: the 12-period EMA minus the 26-period EMA
- Signal Line: a 9-period EMA of the MACD line itself
- Histogram: the MACD line minus the signal line, shown as bars above or below a zero line
Think of the MACD line as a fast runner and the signal line as a slower runner trying to keep pace. When the fast runner pulls ahead, momentum is building in that direction. When the fast runner falls behind, momentum is fading. The histogram simply measures the gap between them, growing taller when momentum is strong and shrinking as it weakens.
This works because moving averages smooth out price noise, and the MACD indicator essentially measures the distance between two of those smoothed averages. It isn't predicting the future. It's showing you, in a visual way, whether recent price action is accelerating or decelerating compared to the recent past.
Key Concept: MACD is a momentum speedometer built from two moving averages. It tells you how fast price is moving and in which direction, not where price is headed next.
How Do You Read MACD Crossovers And Signals?
MACD crossovers happen when the MACD line crosses above or below the signal line, generating the indicator's primary buy and sell signals. A cross above the signal line is typically read as bullish, while a cross below is read as bearish.
There are actually three signals built into MACD, and beginners often only learn the first one.
1. Signal Line Crossovers
This is the most common signal. When the MACD line crosses above the signal line, it suggests upward momentum is building, often read as a buy signal. When it crosses below, it suggests downward momentum, often read as a sell signal.
2. Zero Line Crosses
The zero line represents the point where the 12-period and 26-period EMAs are equal. When the MACD line crosses above zero, the shorter-term average has moved above the longer-term average, confirming a broader bullish trend shift. A cross below zero confirms the opposite.
3. Histogram Divergence
Watch for histogram bars shrinking even while price keeps climbing. That's a warning sign: momentum is fading even though price hasn't turned yet. This is called divergence, and it often shows up before a crossover signal does.
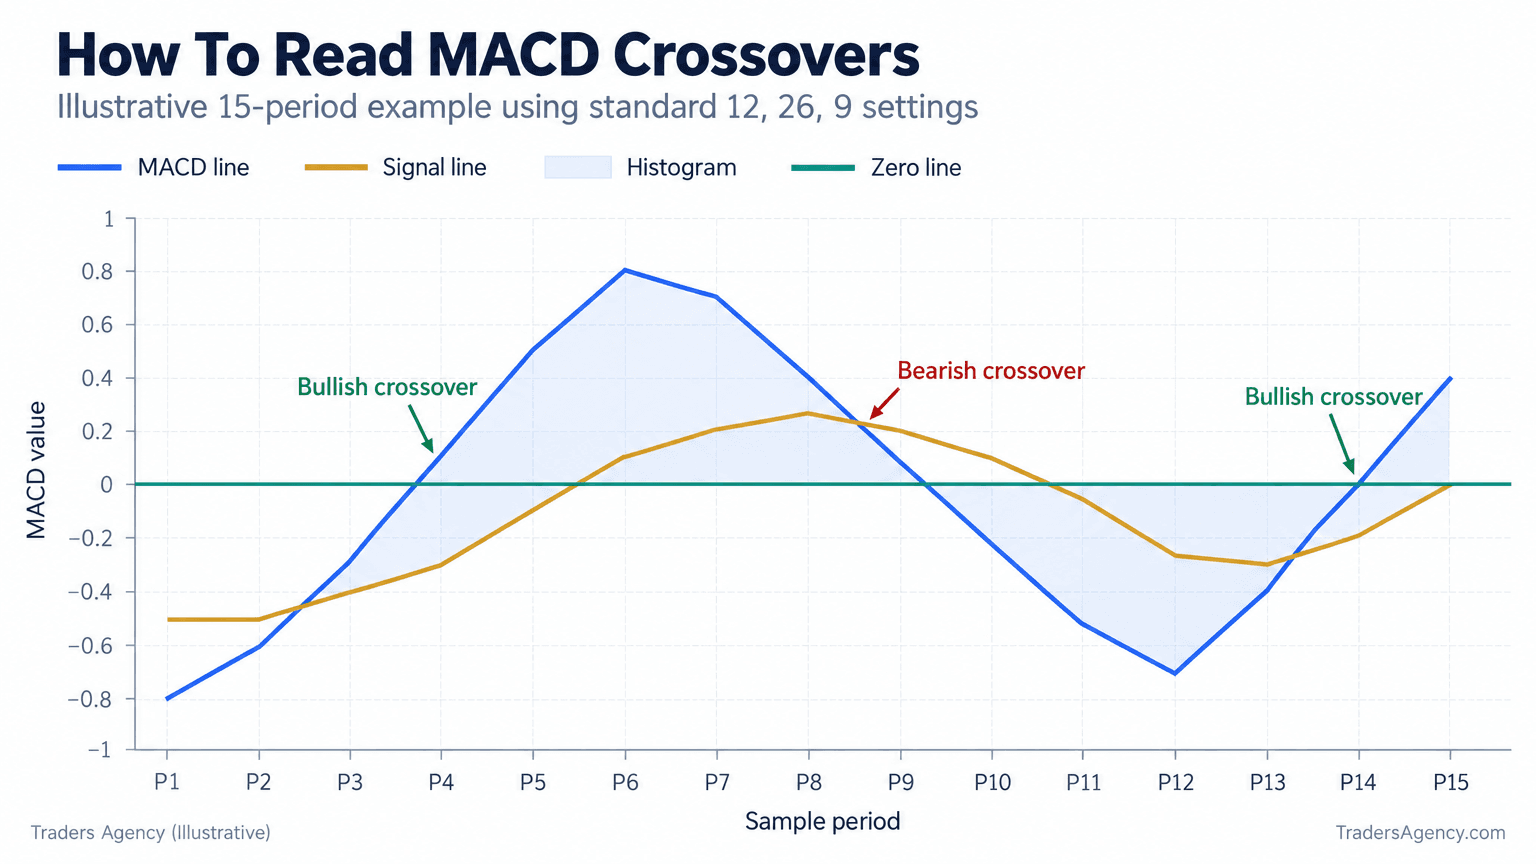
Here's an important truth we share with every new member: the MACD crossover success rate isn't fixed. It varies heavily by market condition. In strongly trending markets, crossovers tend to perform well. In choppy, sideways markets, crossovers generate frequent false signals because the indicator keeps flipping back and forth with no real follow-through.
Watch Out: This is the single biggest reason beginners lose confidence in MACD early on. The indicator isn't broken, it's being used in the wrong environment.
Which Timeframe Works Best For MACD Trading?
MACD can be applied to any timeframe, but it performs differently depending on how much noise exists in that timeframe. Daily and 4-hour charts tend to produce fewer, more reliable signals, while 1-minute and 5-minute charts generate more signals with a higher false-signal rate.
On longer timeframes like the daily chart, MACD signals tend to align with larger trend shifts and give you more time to react. On shorter timeframes like a 1-minute chart, price moves faster and more randomly, so the standard MACD settings often produce whipsaws: rapid back-and-forth crossovers that don't lead anywhere.
| Timeframe | Signal Frequency | Reliability | Best Suited For |
|---|---|---|---|
| Daily | Low | Highest | Swing and position trading |
| 4-Hour | Moderate | High | Multi-day swing trades |
| 5-Minute | High | Moderate | Day trading with confirmation |
| 1-Minute | Very high | Lowest | Experienced scalpers only |
Best MACD Settings For A 5-Minute Chart
For short-term or day trading setups, many traders adjust the standard 12, 26, 9 settings to something faster, like 5, 13, 4, to make the indicator more responsive to quick price swings. Faster settings react sooner but also produce more false signals, so that trade-off needs to be weighed carefully.
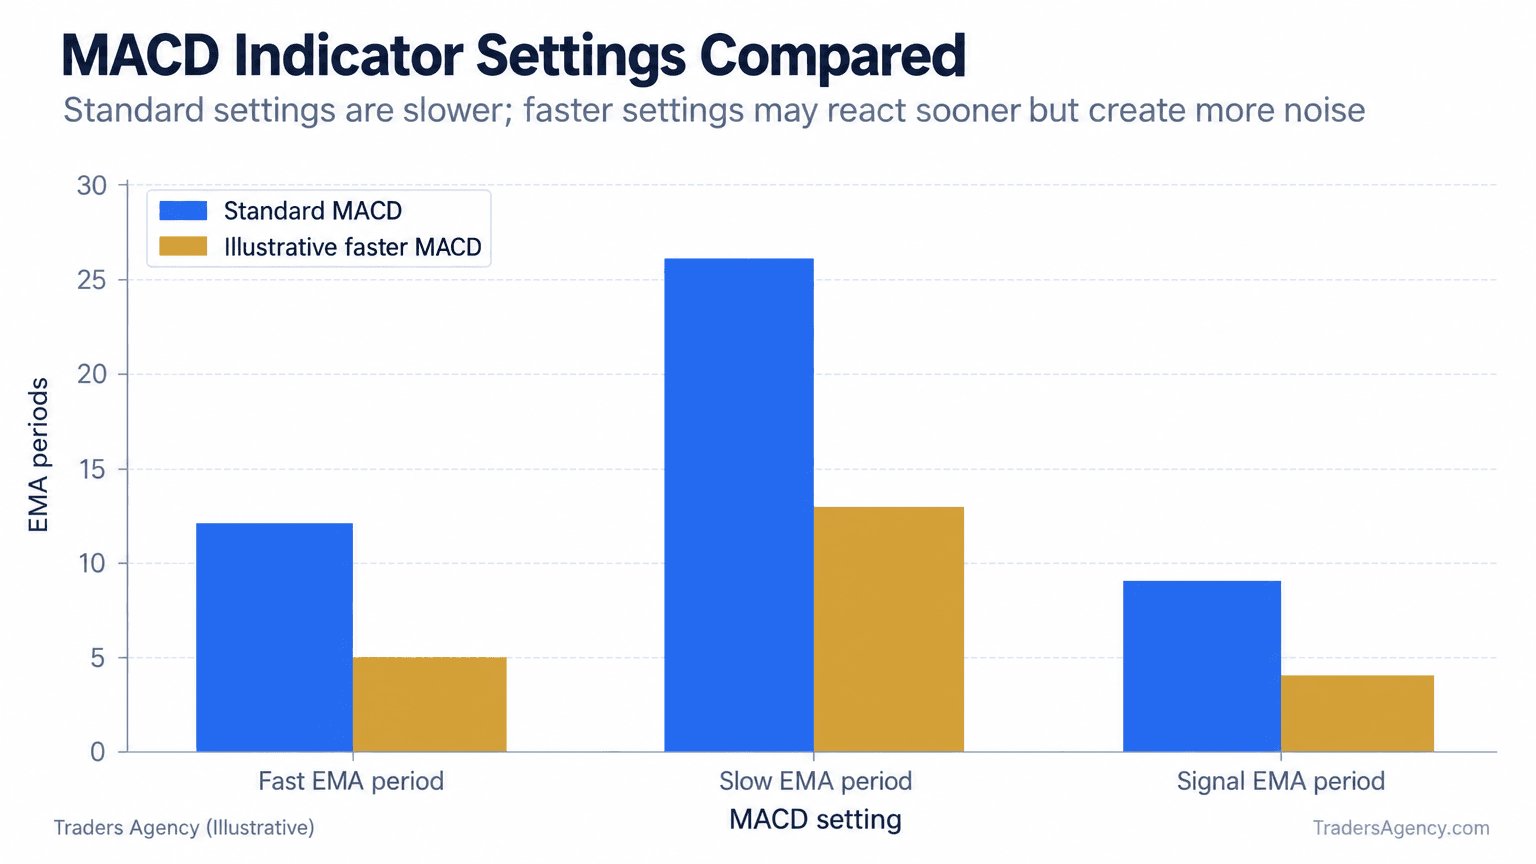
Our team's general rule: the shorter your timeframe, the more you need a confirmation tool alongside MACD, because the raw signal alone becomes noisier.
Want expert trading insights delivered daily?
Join thousands of traders who rely on Traders Agency for market analysis and trade ideas.
Join Traders AgencyWhat Is The Best Indicator To Pair With MACD?
RSI (Relative Strength Index) is one of the best indicators to pair with MACD because it measures whether an asset is overbought or oversold, adding a second layer of confirmation to momentum signals. That combination helps filter out weak crossovers before they cost you money.
Volume is another solid option. Rising volume alongside a MACD crossover adds confidence that real buying or selling interest is behind the move, rather than a quiet, low-conviction drift. If you want to study how momentum behaves across listed products and options markets, the Cboe publishes free market data and educational resources worth bookmarking.
Step-By-Step: The MACD Plus RSI Framework
Here's the simple, beginner-friendly framework we teach for combining MACD with RSI confirmation:
- Step 1: Set Your Chart, Use a daily or 4-hour timeframe with standard MACD settings of 12, 26, 9.
- Step 2: Add RSI, Place RSI on the same chart in its own panel, using the standard 14-period setting.
- Step 3: Wait For A Bullish Crossover, Look for the MACD line crossing above the signal line. No cross, no trade.
- Step 4: Check RSI, Confirm RSI is above 50 and ideally rising, but not above 70 (overbought territory).
- Step 5: Enter The Trade, Only once both conditions align, with a predefined stop loss placed below recent support.
- Step 6: Exit, Close the position when MACD crosses back below the signal line, or when RSI drops back under 50.
A Concrete Example
Say a stock is trading at $48.20. The MACD line crosses above the signal line at the same moment RSI moves from 46 up through 50 and continues climbing toward 58. That alignment is a higher-conviction signal than the MACD crossover alone.
| Scenario | What Happens | How You Manage It |
|---|---|---|
| Best Case | Price trends higher over several sessions, MACD and RSI stay aligned | Ride the trend until MACD crosses back below the signal line |
| Most Likely Case | Price moves modestly in your favor, then stalls | Manage with your stop loss, exit for a small controlled gain or breakeven |
| Worst Case | The crossover was a false signal and price reverses quickly | Your predefined stop loss limits the damage before it compounds |
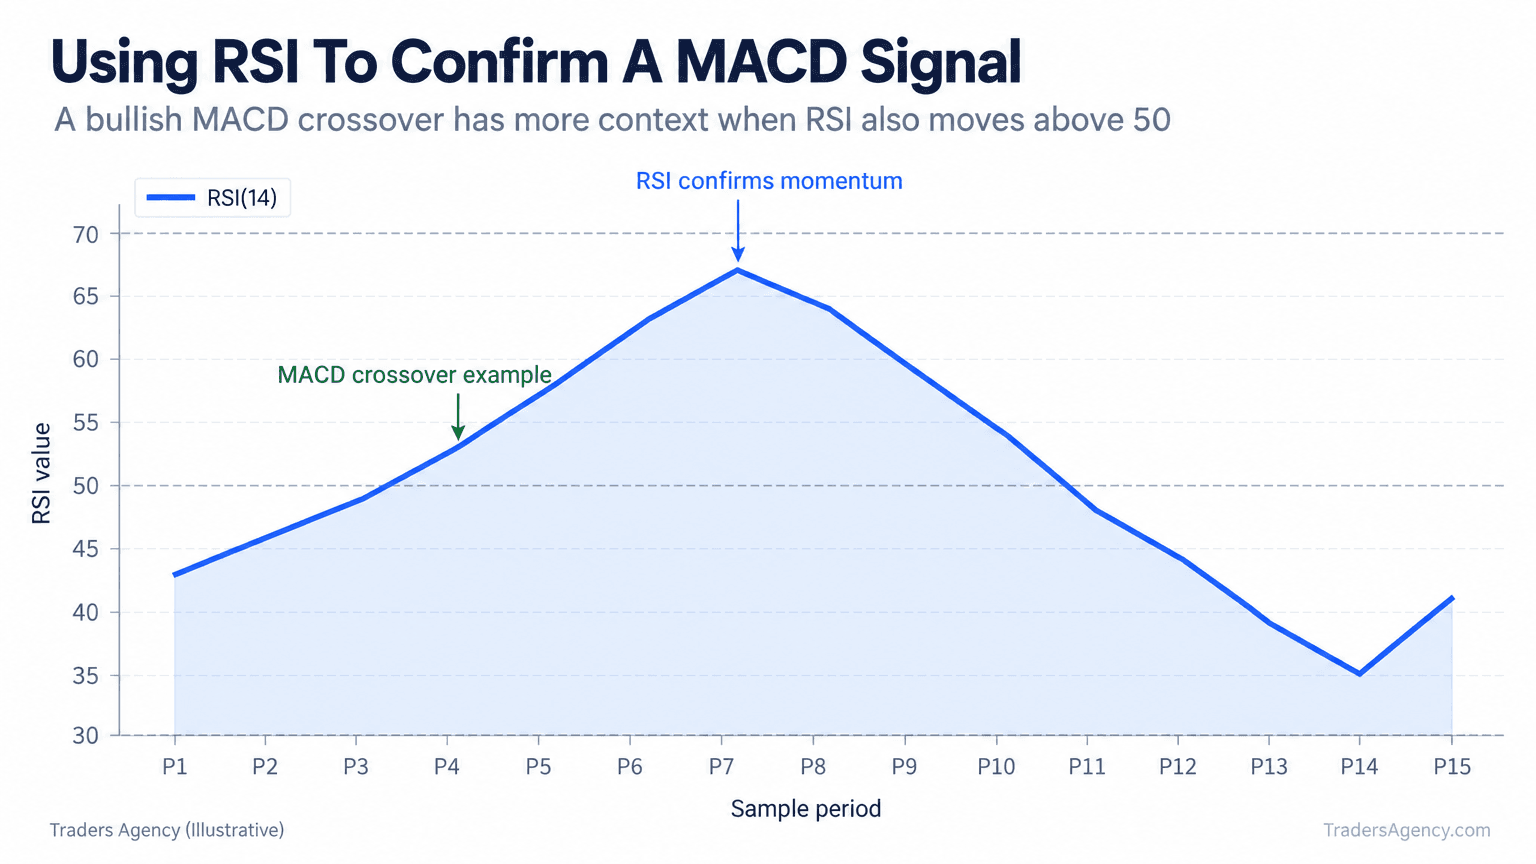
This is exactly the kind of setup we break down for members with annotated chart examples, so you can see dozens of real instances before you ever risk capital.
How Do You Set Up MACD On A Trading Chart?
Most charting platforms, including TradingView, come with MACD built in as a free indicator you can add in a few clicks. Here's the setup process we walk new traders through:
- Open your chart and search for "MACD" in the indicator library.
- Apply the defaults, Start with the standard 12, 26, 9 settings before experimenting with anything faster.
- Adjust the colors so the histogram, MACD line, and signal line are easy to tell apart at a glance.
- Add RSI or another confirmation indicator in a separate panel below the MACD panel.
- Practice on history, Scroll back through past price data and identify crossovers and zero line crosses before trading live.
Do professional traders use MACD? Many do, but typically as one input among several rather than as a standalone system. That's a useful mindset for beginners to adopt early.
What MACD Mistakes Should Beginners Avoid?
Even with a clear setup, new traders tend to repeat the same handful of errors. Avoiding these will save you real money.
- Trading every crossover: Not every signal deserves a trade, especially in sideways markets where false signals cluster.
- Ignoring the broader trend: A bullish MACD crossover against a strong downtrend is a far weaker signal than one that aligns with the trend.
- Using MACD alone: Without a confirmation tool like RSI or volume, you're basing a decision on a single data point.
- Overreacting on short timeframes: 1-minute and 5-minute charts demand tighter risk management because signals flip far more often.
- Skipping a stop loss: MACD tells you about momentum, not where to exit if you're wrong.
When Should You Use A MACD Strategy And When Should You Avoid It?
MACD performs best in trending markets where price is making sustained moves in one direction, giving crossovers room to play out. It tends to underperform in tight, range-bound markets where price oscillates without clear direction.
Our team generally avoids relying on MACD crossovers alone during low-volume periods or right before major news events, since price can gap or whip around in ways that have nothing to do with underlying momentum. We also recommend keeping position sizes modest while you're still learning to read signals, because early-stage traders routinely size positions too large relative to their actual confidence in the setup. Scheduled events published by the Federal Reserve are a good example of the kind of calendar risk worth checking before you enter.
A reasonable starting framework for risk management:
- Risk no more than 1% to 2% of account capital on any single MACD-based trade.
- Set your stop loss before entering, based on recent support or resistance, not an arbitrary dollar amount.
- Use MACD and RSI together rather than in isolation, especially on shorter timeframes.
- Treat zero line crosses as trend confirmation, not standalone entry signals.
Risk Warning: MACD is rarely effective as a complete trading system on its own, and we don't recommend treating it that way. Pair it with trend lines, support and resistance levels, and volume analysis before committing real capital.
Frequently Asked Questions
What is the most effective MACD trading strategy?
Combining signal line crossovers with a confirmation tool like RSI, applied on daily or 4-hour timeframes, tends to produce more reliable results than relying on crossovers alone.
Do professional traders use MACD?
Yes, many do, but usually as one input within a broader system that includes trend analysis, volume, and risk management rather than as a standalone signal.
What is the best indicator to pair with MACD?
RSI is the most commonly paired indicator, since it adds overbought and oversold context that MACD alone doesn't provide.
Which timeframe is best for MACD?
Daily and 4-hour charts tend to produce more reliable MACD signals than 1-minute or 5-minute charts, which generate faster but noisier signals.
What do the standard MACD settings mean?
The standard settings, 12, 26, 9, refer to the periods used for the fast EMA, the slow EMA, and the signal line smoothing, respectively.
Can MACD be used on its own without other indicators?
It can, but it's far more prone to false signals when used alone, which is why we recommend pairing it with a confirmation tool like RSI or volume.
Why does MACD give false signals in sideways markets?
In range-bound markets, price lacks sustained direction, so the MACD line and signal line cross back and forth frequently without any real follow-through.
Want expert trading insights delivered daily?
Join thousands of traders who rely on Traders Agency for market analysis and trade ideas.
Join Traders AgencyDISCLAIMER: Traders Agency does not offer financial advice. The information provided is for educational purposes only and should not be considered financial advice. Traders Agency is not responsible for any financial losses or consequences resulting from the use of the information provided. Trading carries inherent risks and may not be suitable for all individuals. You are advised to conduct your own research and seek personalized advice before making any investment decisions, recognizing the potential risks and rewards involved.
See more from Traders Agency on Google
Make us a preferred source and our market analysis will appear more prominently in your Google Search, Top Stories, and AI results.
Add to Preferred Sources



