
The April 2026 inflation data just dropped, and consumer prices are running hotter than expected on an annual basis. The CPI report market reaction is already taking shape across major indices as traders digest a complex mix of energy spikes and sticky core inflation. Our team is watching these developments closely to determine the next major market moves, and the signals are sending a clear message: buyers aren't backing down.
What Did the April 2026 CPI Report Show?
The headline figures present a challenging setup for anyone expecting a smooth path back to the Fed's target. Consumer prices rose 0.6% in April compared to the previous month. This matched expectations and came in below the 0.9% increase we saw in March.
The annual data tells a different story entirely. The headline inflation measure jumped 3.8% year over year, exceeding expectations of 3.7% and beating the 3.3% reading from March.
Key Number: April's 3.8% year-over-year CPI increase is the largest jump since May 2023, signaling a clear acceleration in the broader inflation trend.
Our analysis confirms that April's year-over-year increase marks the largest such jump since May 2023. This indicates a clear acceleration in the broader trend that traders cannot ignore.
The core Consumer Price Index, which strips out volatile food and energy categories, also ran hot. Core CPI rose 0.4% month over month and 2.8% year over year. Both of these core readings topped economist expectations. The market was looking for a 0.3% month-over-month increase and a 2.7% year-over-year print. The monthly reading for core inflation also outperformed March's data, which showed a 0.2% monthly rise and a 2.6% yearly increase.
How Did Stocks React to the CPI Inflation Data?
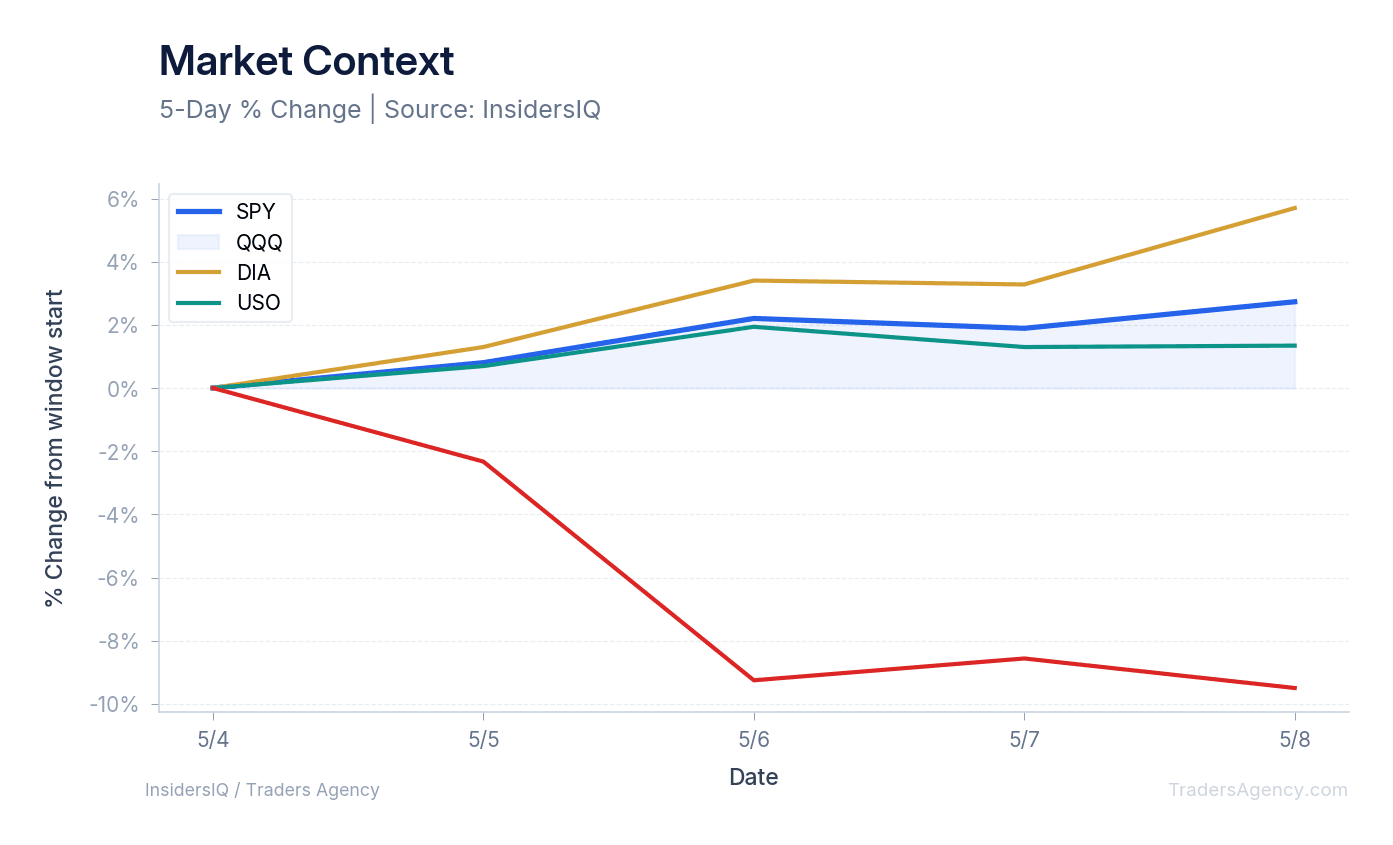
The immediate market reaction shows resilience in major indices despite the hot inflation print. Over the last 10 days, the Nasdaq 100 ETF (QQQ) surged +5.70%, while the S&P 500 ETF (SPY) gained +2.73%. The Dow Jones Industrial Average ETF (DIA) also posted a positive return of +1.34%.
We track these specific ETF movements to gauge true market sentiment. The price action tells us that buyers are stepping in heavily across the board.
Right now, the Fear & Greed index sits at 68. This indicates a market leaning heavily toward greed, ignoring the macroeconomic headwinds presented by the inflation data. Retail engagement also remains highly active, with WallStreetBets sentiment registering at 0.03 with 2,748 mentions. The crowd is clearly participating in this upward momentum.
Why Is Inflation Still Running Hot in 2026?
Inflation remains elevated primarily due to massive spikes in energy costs and rising food prices. The top-line energy price index climbed 3.8% in April alone. On an annual basis, energy prices have skyrocketed 17.9%, heavily driven by surging gasoline and fuel oil costs.
Digging into the specific energy commodities, the data shows gasoline up 28.4% year over year. Fuel oil has seen an even more dramatic surge, up 54.3% over the previous year. These categories are pushing the top-line inflation figure significantly higher. Energy commodities overall rose 5.6% in April.
Energy Shock: Fuel oil prices surged 54.3% year over year, while gasoline climbed 28.4%. The loss of fertilizers from the Persian Gulf tied to the ongoing conflict in Iran is adding direct upward pressure on global food prices.
Energy services, which include electricity and utility-supplied natural gas, increased 1.6%. This helped balance out the top-line energy figure slightly, but the overall trend remains heavily upward.
Food prices are also contributing to the pressure. The data shows food prices rising 0.5% for the month and 3.2% year over year. A major factor we are monitoring is the loss of fertilizers from the Persian Gulf, directly tied to the ongoing war in Iran. This geopolitical conflict is set to put further upward pressure on food prices. The war's impact is also visible in travel costs: airline fares jumped 20.7% year over year in April, with a 6.3% monthly increase contributing heavily to this annual spike.
What Does This Mean for the Market Reaction?
The data indicates that traders are currently looking past the headline inflation numbers and focusing on specific sector momentum. Despite core inflation printing above expectations, the heavy buying in tech-heavy indices suggests the market is absorbing the higher costs without triggering a broad selloff.
Our analysis shows a clear divergence between the inflation data and the price action in equities. When core inflation beats expectations, we typically expect to see immediate downward pressure on growth stocks. Instead, the +5.70% 10-day price change in the QQQ tells us that buyers are stepping in aggressively. The tech sector is leading the charge higher.
Traders need to recognize that the market is treating this inflation data as a known variable. The year-over-year headline jump to 3.8% is the largest since May 2023. Yet, the SPY still managed a solid +2.73% gain over the last 10 days. This resilience is a key signal for our trading strategies.
Want expert trading insights delivered daily?
Join thousands of traders who rely on Traders Agency for market analysis and trade ideas.
Join Traders AgencyWhich Sectors and Commodities Moved Most After the CPI Report?
While equities have shown strength, the commodity space is telling a very different story. We are closely tracking the United States Oil Fund (USO), which has experienced a sharp -9.50% drop over the last 10 days.
This creates a massive divergence in the data. The inflation report explicitly cites energy prices as primary drivers of the 3.8% annual CPI increase. Specifically, gasoline and fuel oil are pushing the numbers north. Yet, the recent price action in the USO shows significant downward momentum.
For traders, this disconnect between the backward-looking BLS data and the forward-looking price action in oil markets presents a unique setup. The massive 54.3% year-over-year increase in fuel oil is already priced into the inflation data. The recent -9.50% drop in the USO suggests energy pressures might be cooling right now.
We believe this commodity weakness is giving equity bulls the confidence to keep buying the SPY and QQQ.
What Should Traders Watch Next?
Traders should watch the ongoing divergence between equity strength and commodity weakness in the weeks ahead. We are specifically monitoring the tech sector's ability to hold its recent gains, the stabilization of crude oil prices, and the impact of geopolitical conflicts on global food supplies.
Based on the BLS data and our internal market tracking, here is exactly what our team is monitoring right now:
- Tech Sector Resilience: The QQQ is leading the market with a +5.70% gain. We are watching to see if this momentum holds despite the 2.8% year-over-year core inflation print.
- Energy Market Reversals: With the USO down -9.50% over the last 10 days, we are looking for stabilization in crude oil prices. A continued drop here could signal relief for future headline inflation numbers.
- Geopolitical Impacts on Food: The war in Iran and the resulting loss of fertilizers from the Persian Gulf remain major wildcards. We expect this to keep upward pressure on the 3.2% annual food price increase.
- Travel and Transportation Costs: Airline fares are up 20.7% year over year. We are tracking transportation stocks to see how they handle these increased operational costs and fare hikes.
- Broad Market Sentiment: The Fear & Greed index at 68 shows strong bullish conviction. We are monitoring this metric to see if the hot inflation data eventually cracks investor confidence.
The Bottom Line for Traders
The April inflation data confirms that consumer prices are running hotter than expected. The specific pressure points are clearly defined in the energy and food sectors.
However, the market reaction proves that equities are currently shrugging off these macroeconomic headwinds. The buyers are firmly in control of the major indices.
Our team is staying focused on the price action. We are prioritizing the strength in the QQQ and SPY while monitoring the sharp pullback in the USO. We will continue to track these specific ETF levels as the market digests the reality of sticky inflation. Traders must stay objective and follow the data.
Want expert trading insights delivered daily?
Join thousands of traders who rely on Traders Agency for market analysis and trade ideas.
Join Traders AgencyKey Takeaways
- April 2026 headline CPI rose 3.8% year over year, beating the 3.7% forecast and accelerating sharply from March's 3.3% reading. This is the largest annual jump since May 2023.
- Monthly CPI came in at 0.6%, matching expectations and cooling from March's 0.9% surge, offering a small offset to the hotter annual print.
- Core CPI (excluding food and energy) rose 0.4% month over month and 2.8% year over year, both above economist forecasts. Sticky core inflation complicates any near-term Fed pivot narrative.
- Despite the hotter-than-expected data, major equity indices held firm. QQQ and SPY showed resilience, signaling that buyers are currently treating inflation as a known risk rather than a new shock.
- Energy was the primary pressure point driving the headline beat, while USO pulled back sharply on the day, creating a notable divergence between commodity and equity market reactions.
DISCLAIMER: Traders Agency does not offer financial advice. The information provided is for educational purposes only and should not be considered financial advice. Traders Agency is not responsible for any financial losses or consequences resulting from the use of the information provided. Trading carries inherent risks and may not be suitable for all individuals. You are advised to conduct your own research and seek personalized advice before making any investment decisions, recognizing the potential risks and rewards involved.
See more from Traders Agency on Google
Make us a preferred source and our market analysis will appear more prominently in your Google Search, Top Stories, and AI results.
Add to Preferred Sources