
Every major financial disaster leaves the same fingerprints. If you want to know the stock market crash signals that show up before a top, the historical record spells it out. Before the tech top on March 10, 2000, and before the housing top on October 9, 2007, a specific sequence of measurable events unfolded.
There are exactly 14 stock market crash signals. Today, 13 of them have already triggered.
What Are the 14 Stock Market Crash Signals?
Bottom Line: The historical fingerprints of a major market top are nearly complete: 13 of 14 measurable signals have fired across debt, speculation, and credit markets. The single open signal is the high yield spread crossing and holding above 3.5%. Credit markets have historically forced honest price discovery before equities follow, so watching that spread is the most actionable thing left to do.
Fourteen specific, measurable events that show up before every top
A market crash is signaled by 14 dated events across corporate debt, retail speculation, and credit markets. Record debt issuance. Off-balance sheet risk. Insider selling. Tightening funding markets. When these stock market crash signals fire together, a major correction historically follows.
Here is the full checklist:
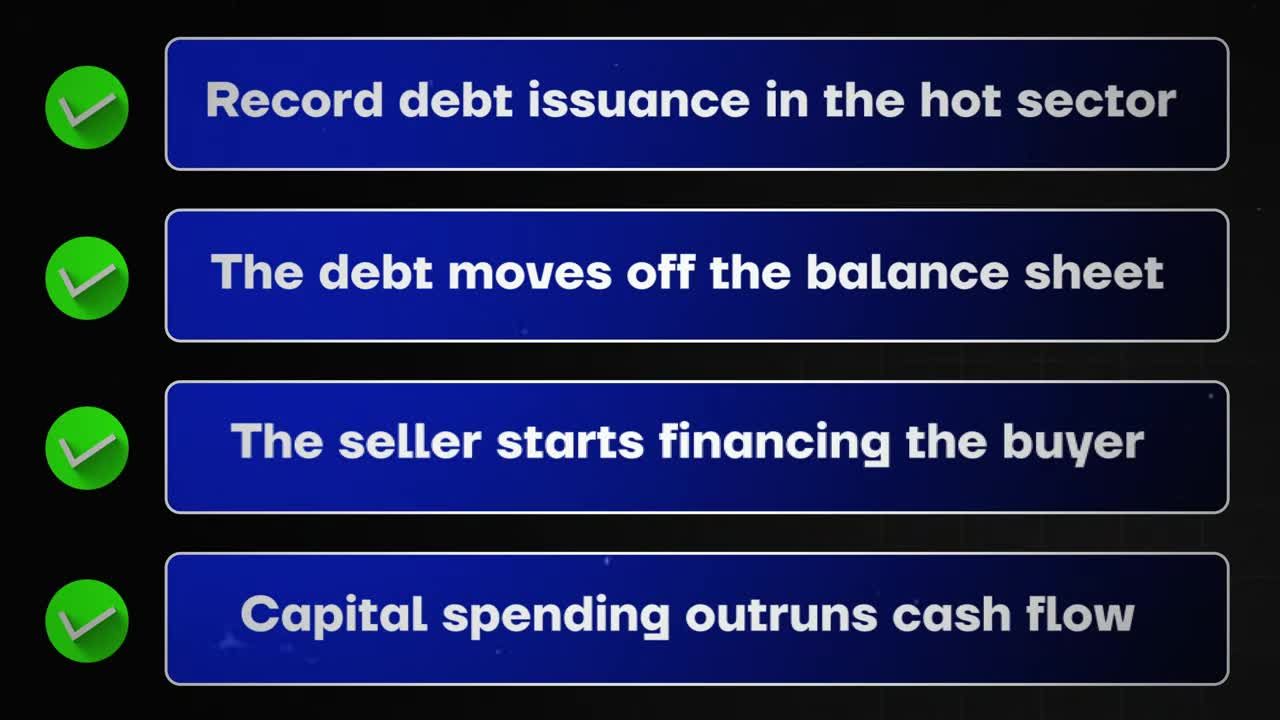
- Record debt issuance in the hot sector
- High debt levels moving off balance sheets
- The seller starts financing the buyer
- Capital spending outruns cash flow
- Record margin debt
- Record IPO volume
- Retail piles into leverage
- Insiders sell and nobody buys
- The Super Bowl indicator
- The picks-and-shovel supplier becomes the most valuable company
- Regulators start writing memos
- Credit in the hot sector turns while everything else stays calm
- The funding market starts choking
- Lenders get scared
How Does Today's Market Compare to the 2000 and 2007 Tops?
The parallels to previous bubbles are undeniable. I went back to the NASDAQ peak in 2000 and the S&P 500 peak in 2007 to ask one question: what actually happened before the collapse?
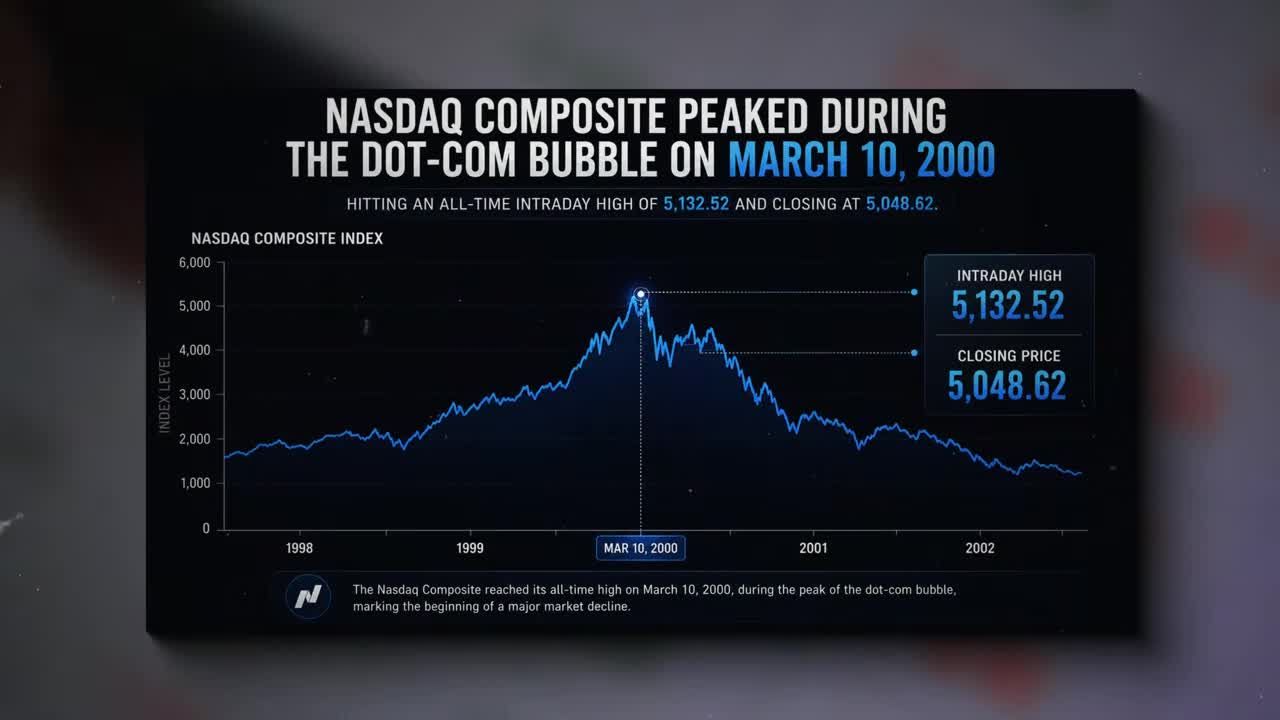
These markers build a framework for spotting an overcooked market. Once you learn the sequence, you'll know when to get out and avoid an expensive correction.
Record Debt and Sky-High Valuations
The first four markers involve money, which can be counted
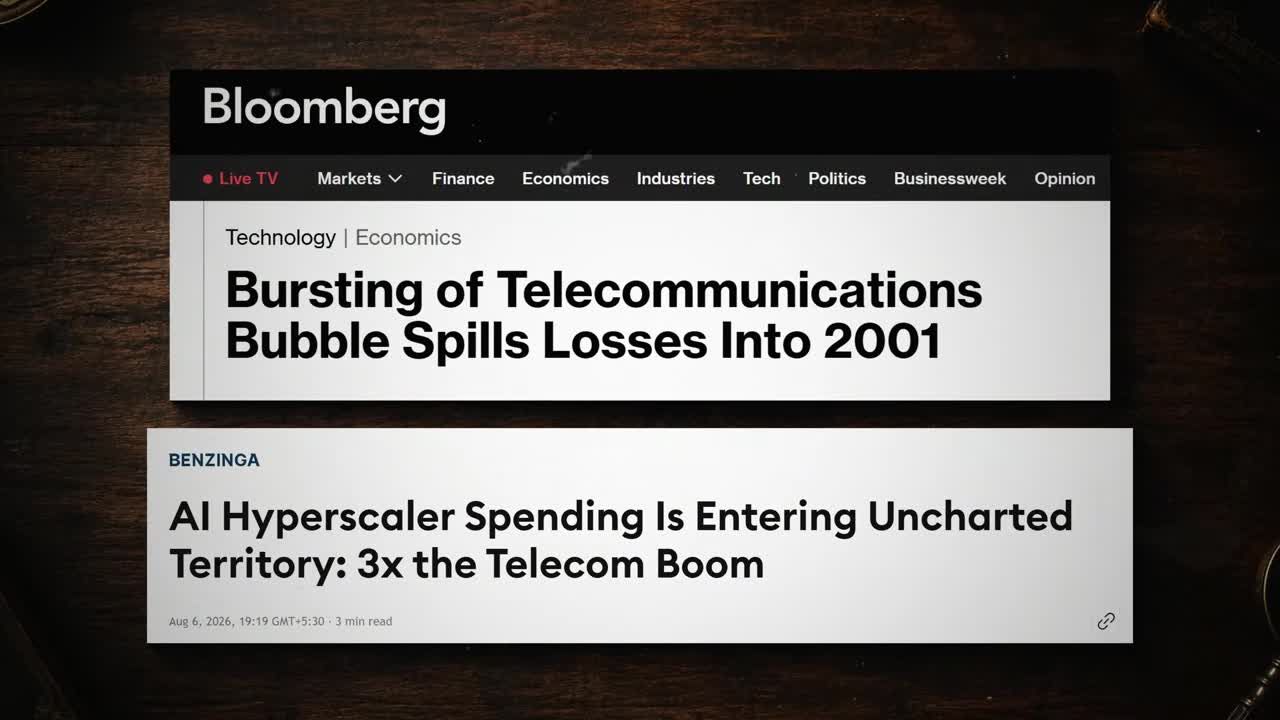
Marker 1: Record debt issuance in the hot sector. Between 1996 and 2001, telecom companies issued over $500 billion of bonds. That was the fuel. Today, Morgan Stanley puts AI-related debt issuance at roughly $570 billion just this year. Bonds from the hyperscalers hit $225 billion by midyear, up nearly 1,000% from last year. Check.
Marker 2: High debt levels moving off balance sheets. In 2006, Wall Street issued about $521 billion of collateralized debt obligations to hide mortgage risk where nobody could see it. Today, Moody's counts $1.2 trillion of off-balance sheet AI commitments. Microsoft alone disclosed $329 billion of leases that haven't even started yet, up from $93 billion a year earlier.
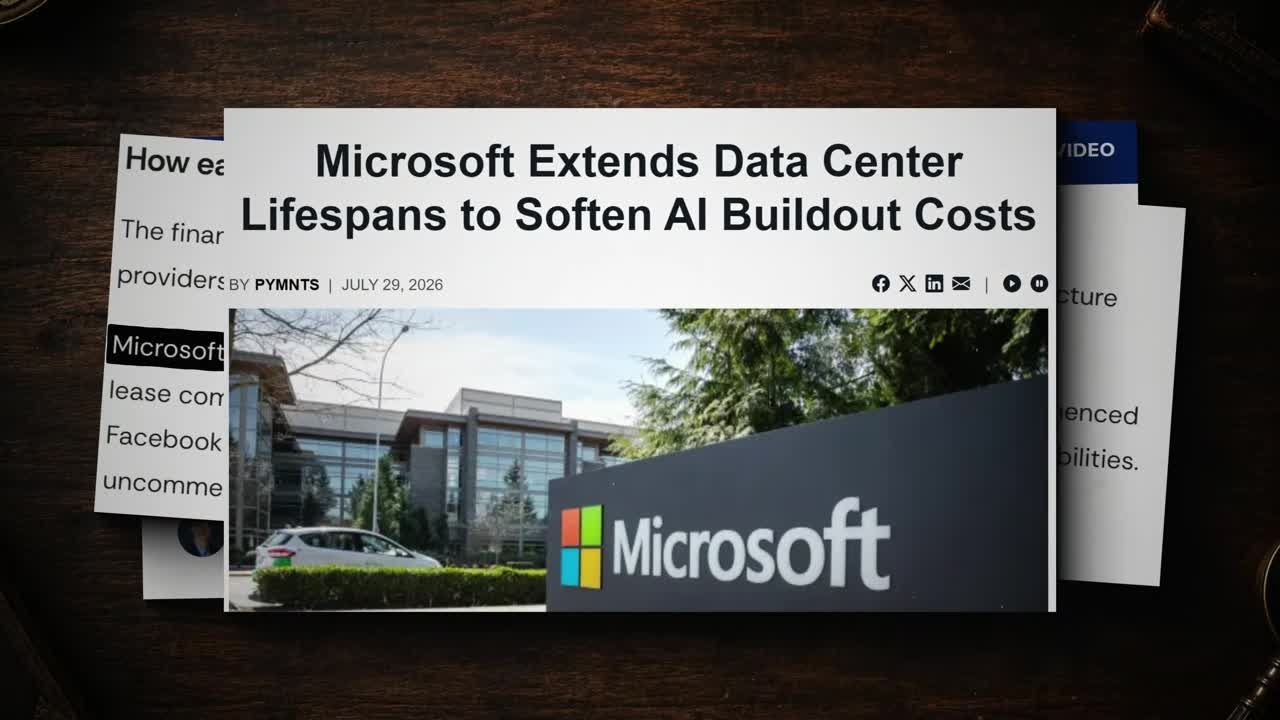
Starting next fiscal year, Microsoft is extending the useful life of its data centers from 15 years to 25. Nothing has changed about the buildings. They're just fabricating less depreciation. Check.
Marker 3: The seller starts financing the buyer. In the late 1990s, Lucent lent $8 billion to its own customers so they could buy Lucent equipment, then booked those loans as revenue. Nortel did the same. By 2000, McKinsey counted $25.66 billion of this across nine equipment makers.
Today, Nvidia holds $30 billion of equity at OpenAI, committed $10 billion to Anthropic, and signed an agreement to buy CoreWeave's unsold capacity through 2032. Check.
Marker 4: Capital spending outruns cash flow. In the 2001 telecom cycle, capital spending outran revenue by about 32%. Everyone swore the demand was coming. Today, CreditSights data shows AI capex outrunning revenue by 46%, even wider than the telecom bust. Oracle spent $55 billion on capex last fiscal year against just $23 billion of cash flow. It doesn't add up. Check.
What Happens When Retail Investors Go All In Before a Crash?
The next four markers come from retail investors, who act predictably at euphoric peaks
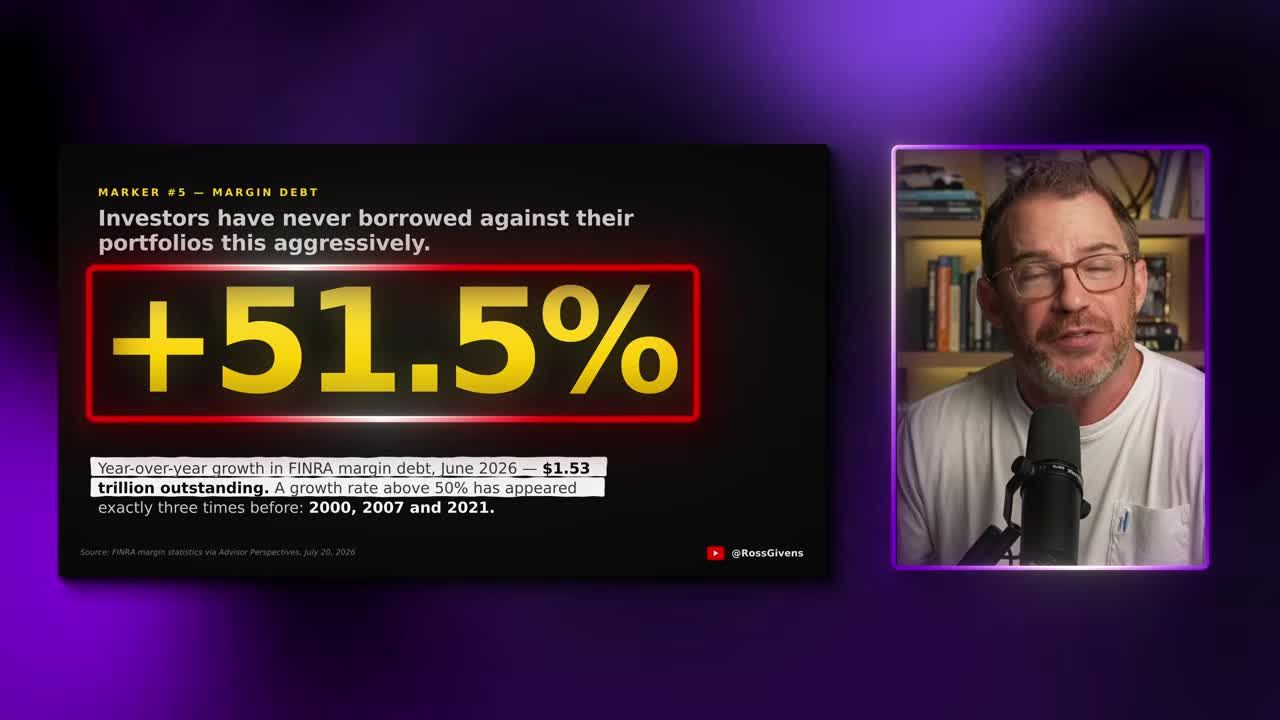
Marker 5: Record margin debt. Margin debt is money investors borrow against their own portfolios to buy more stock. It peaked six months before the 2000 top and four months before the 2007 top. Today, margin debt sits at $1.53 trillion, up 51.5% in a year. That growth rate has appeared exactly three times before: 2000, 2007, and 2021. Check.
Marker 6: Record IPO volume. In 1999, we saw roughly 480 internet IPOs with an average first-day pop of 71%. In the first half of this year, American companies raised an all-time record $251 billion of equity. IPOs alone were $141 billion, matching the entire record year of 2021. SpaceX by itself raised $86 billion in six months, the largest IPO in history.
First-day pops are now running 11 to 15%, not 70. The mania this time isn't about speculation, it's about size. Check, with an asterisk.
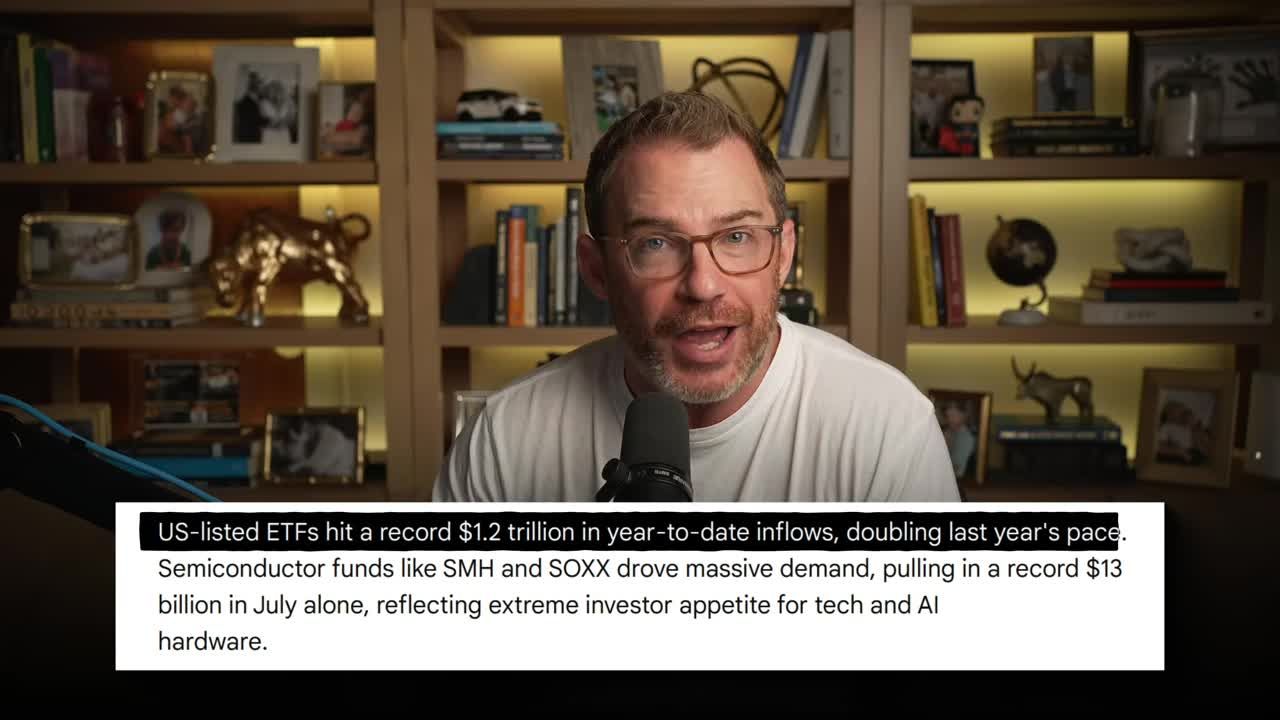
Marker 7: Retail piles into leverage. A massive $1.2 trillion flowed into US-listed ETFs this year, doubling last year's pace. Semiconductors are the number one sector. Leveraged chip funds, single tickers that hand you two or three times the daily move of an already violent sector, are pulling in record money. They even had them for SpaceX the week after it went public. Check.
Marker 8: Insiders sell and nobody buys. Angelo Mozilo sold $139 million of Countrywide stock in 2006 and 2007 while defending the quality of the loan book on television. The company went bankrupt. Over the last 12 months, insiders at Nvidia, Palantir, Alphabet, and Meta sold $3.4 billion of stock. Insider purchases over that same stretch? Zero. Not one share. Check.
Get an entire year of live weekly mentoring sessions, my newsletter, indicators, bonus reports, tons more. Click the link and I'll see you in the next live session.
Join my Black Ops Trading ClubThe Symbolic Markers
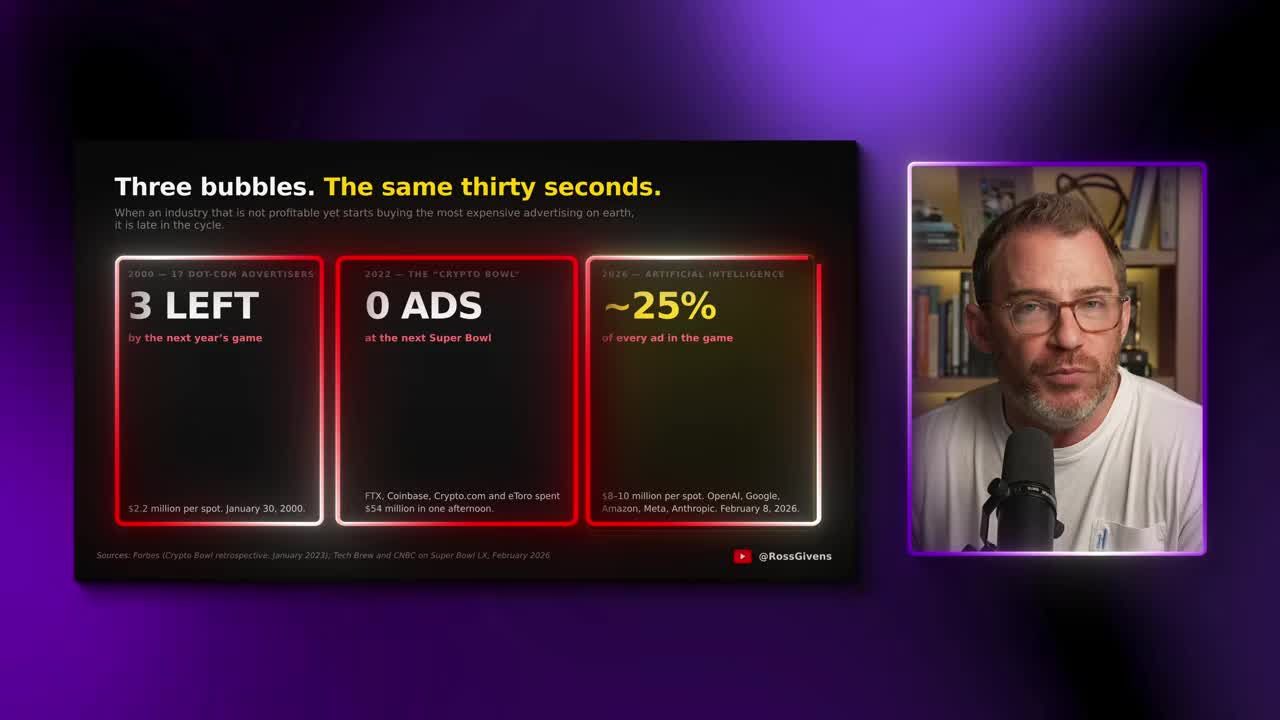
Marker 9: The Super Bowl indicator. On January 30, 2000, 17 dot-com companies bought Super Bowl ads at $2.7 million apiece. By the next year's game, only three still existed. It happened again in the 2022 Crypto Bowl. FTX, Coinbase, Crypto.com, and eToro spent $54 million in a single afternoon. FTX filed for bankruptcy, and the founder went to prison nine months later. Coinbase stock finished 2022 down 86%. The following Super Bowl featured zero crypto ads.
On February 8 of this year, 23% of Super Bowl ads came from AI companies. 15 ads out of 66, from OpenAI, Google, Amazon, Meta, and Anthropic. This doesn't tell you the day of the top, but it tells you we're in the neighborhood. Check.
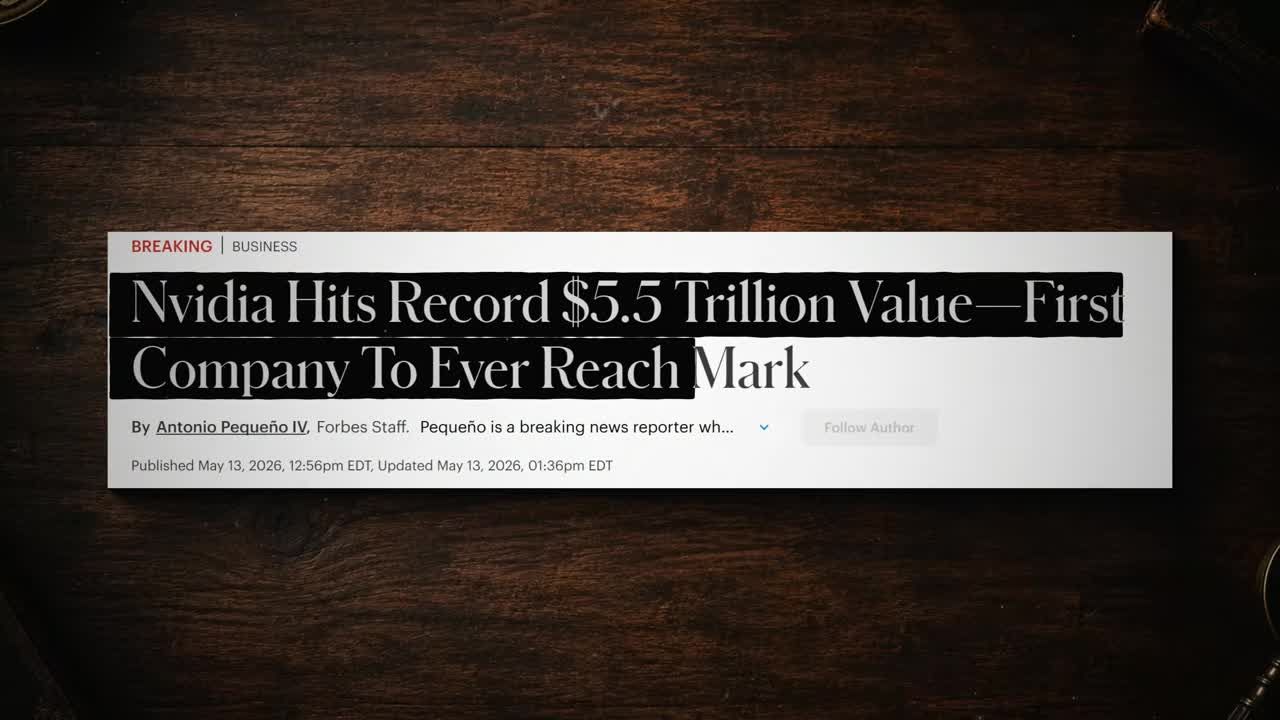
Marker 10: The picks-and-shovel supplier becomes the most valuable company. Cisco sold the routers that built the internet. On March 27, 2000, Cisco passed Microsoft to become the most valuable company in the world, just 17 days after the NASDAQ peaked. On May 13 of this year, Nvidia became the first company in history worth $5.5 trillion. The NASDAQ high came three weeks later, on June 3. Check.
The Credit Market Cracks
The final markers come from credit, and these are the ones that truly matter
Marker 11: Regulators start writing memos. The Bank for International Settlements in March, the Federal Reserve in May, the Bank of England in July, and Moody's on July 24 all issued warnings. They stated that unprecedented AI spending threatens the credit quality of Amazon, Meta, and Alphabet.
The BIS calls this "shadow borrowing." Roughly 15% of the entire private direct lending market, a market north of a trillion dollars, is now lending into AI and tech. Four years ago, that was basically nothing.
The scariest one came from the Bank of England. In July, they published a chart of how expensive American stocks are relative to bonds and wrote that valuations have moved toward "levels not seen since the dot-com bubble." That's a central bank talking, not me. Check.
Marker 12: Credit in the hot sector turns while everything else stays calm. On January 19, 2007, the ABX index tracking subprime mortgage bonds traded the BBB- slice at 97.5. By February 27, five weeks later, it was at 62. A 36% drop. The S&P went on to make a new all-time high seven months later.
Today, Oracle's five-year credit default swaps went from 145 basis points in January to over 215 in July. That's an all-time record, above where they traded in the 2008 crisis. CoreWeave is north of 800. Check.
Marker 13: The funding market starts choking. In June 2007, Merrill Lynch seized $850 million of AAA-rated collateral from a Bear Stearns hedge fund and couldn't find a buyer. That was the market discovering in public that the paper had no price.
Today, buyer coverage on hyperscaler bond deals fell from about five times in February to under two times in July. CoreWeave's term loan repriced 125 basis points higher, and lenders forced back maintenance covenants that have been absent from leverage loans for over a decade. This one fired inside the last 60 days. Check.
The One Signal Still Unchecked
Thirteen boxes checked. One is open.
Marker 14: Lenders get scared.
When you loan money to the US government, you get paid a little interest. When you loan money to a risky company that might not pay you back, you demand more. That difference is the whole thing: how much extra a company has to pay compared to Uncle Sam. It's called the high yield spread, and it is the single most reliable warning light of a pending crash.
When lenders are relaxed, the gap is small. When they get scared, the gap gets wide.
In 2007, the spread sat at 2.3% in the spring. Everything looked fine. By August it hit 4%, just four months before the S&P peaked. Back in 2000, the gap started widening in the spring, and once it exceeded 3.5%, it never came back. By November of that year, the Bank of England noted junk borrowing costs had reached the levels of the early 1990s recession.
Look at today. Oracle's default insurance is at a record above 2008. Lenders are demanding covenants they haven't asked for in a decade. CoreWeave is borrowing at 15% interest. Yet broad corporate credit is priced like nothing is wrong at all. That's a contradiction, and that's the point. This is exactly what early 2007 looked like before peaking later. This final signal is still unchecked.
What Investors Should Actually Do About These Stock Market Crash Signals
Before you rush to liquidate your IRA, understand the timeline. No one, not Warren Buffett, not the head of the Federal Reserve, can pinpoint the exact top. Most of these stock market crash signals were flashing in 1999, and the NASDAQ doubled the next year before it finally came crashing down.
The exact date is impossible to know. But this sequence has played out like clockwork before every market top. If you know you're walking on shaky ground, you're much more likely to find the exit when the music stops.
Here's your personal warning system. It takes 60 seconds a month.
1. Track the high yield spread
The Federal Reserve publishes this spread for free every day. No subscription, no paywall. Go to the FRED website (fred.stlouisfed.org) and search "high yield spread." You're looking for the ICE BofA US High Yield Index Option-Adjusted Spread. If you use TradingView, the ticker is BAMLH0A0HYM2.
2. Watch for the 3.5% threshold
The current number is 2.7. The market is asleep, and lenders are charging almost nothing for risk. Your target number is 3.5. When that line reaches 3.5% and stays there for a month, the last box gets checked.
It's not the quick spike that tells you to act. It's the jump that refuses to come back down. Look at the last times it held above 3.5%: during the trade war before that bear market, in early 2022 before that bear market, and in February 2020 right before the COVID crash.
The Credit Market Never Lies
In 2000, credit and stocks turned together, but credit kept screaming for a year while stocks insisted it was just a dip. In 2007, the warning came four months before the top. Either way, you got a warning.
Thirteen boxes are checked. One is open. The music is still playing, but now you know exactly what song to listen for. Watch the high yield spread. When it breaks 3.5% and holds, the final signal has fired.
Get an entire year of live weekly mentoring sessions, my newsletter, indicators, bonus reports, tons more. Click the link and I'll see you in the next live session.
Key Takeaways
- 13 of 14 historically documented stock market crash signals have already triggered, based on patterns observed before the March 10, 2000 NASDAQ peak and the October 9, 2007 S&P 500 peak.
- The one remaining signal is the high yield (junk bond) spread: a break above 3.5% that holds would constitute the 14th and final warning.
- In past cycles, credit markets led equities lower by as much as a full year (2000) or four months (2007), giving investors a measurable early warning window.
- The checklist spans corporate behavior, retail speculation, and credit markets: record margin debt, record IPO volume, insider selling with no institutional buying, off-balance sheet debt, and tightening funding markets all appear on the list.
- The picks-and-shovel supplier becoming the most valuable company is one of the symbolic markers on the checklist, a pattern that echoes Cisco in 2000 and parallels today's AI infrastructure leaders.
DISCLAIMER: Traders Agency does not offer financial advice. The information provided is for educational purposes only and should not be considered financial advice. Traders Agency is not responsible for any financial losses or consequences resulting from the use of the information provided. Trading carries inherent risks and may not be suitable for all individuals. You are advised to conduct your own research and seek personalized advice before making any investment decisions, recognizing the potential risks and rewards involved.
See more from Traders Agency on Google
Make us a preferred source and our market analysis will appear more prominently in your Google Search, Top Stories, and AI results.
Add to Preferred Sources