
Two squiggly lines drawn through price on a chart, both labeled "moving average," and they never quite agree with each other. If you've ever wondered why, or which one you're supposed to trust, you're in the right place. We'll show you exactly how the Simple Moving Average (SMA) and the Exponential Moving Average (EMA) are calculated, why they diverge, and how our team decides which one belongs on a chart.
SMA vs EMA is the comparison between two ways of smoothing price data. The Simple Moving Average treats every price in the lookback window equally. The Exponential Moving Average gives more weight to recent prices. Both lines help you see trend direction without the noise of day-to-day swings. The main difference comes down to speed: EMA reacts faster to new price action, while SMA moves slower and smoother.
We're going to work through real number examples, show you what golden cross and death cross signals look like on a chart, and give you a framework for pairing these tools with other indicators. This is a beginner-friendly breakdown, so we'll define every term as we go.
What Is the Difference Between SMA and EMA?
Bottom Line: SMA and EMA aren't competing signals, they're different lenses: EMA's speed suits traders who need early entries, while SMA's smoothness suits those confirming an established trend. Neither works alone, so pair the crossover with other indicators and a trading plan rather than treating the line itself as a buy or sell call.
The core difference comes down to how each line weighs price data over time. SMA adds up a set number of closing prices and divides by that number, treating the oldest and the newest price exactly the same. EMA applies a weighting formula that gives more influence to recent closes, so it changes direction sooner than SMA does.
Here's the way we explain it in our training sessions. Think of SMA as a class grade that averages every test equally, including the one you took in week one. EMA is more like a grade that counts your most recent test more heavily, because that test better reflects what you can do right now. Neither method is wrong. They simply answer different questions: SMA answers "what has the average price been," while EMA answers "what is price doing lately."
Key Concept: SMA weighs every price in the window equally. EMA weighs recent prices more heavily. That single difference is the source of every other difference between the two lines.
This distinction matters because the moving average you choose changes how quickly your signals fire and how many false alarms you sit through along the way.
Simple Moving Average: How It Works
A Simple Moving Average is calculated by adding the closing prices of a set number of periods and dividing by that number. For a 5-day SMA, you add the last five closing prices and divide by five. That's the whole formula.
Let's use real numbers. Say a stock closes at $100, $102, $101, $104, and $103 over five days. Add them up and you get 510. Divide by five. Your 5-day SMA is $102.
Tomorrow a new close of $105 arrives. You drop the oldest price ($100) and add the newest: (102 + 101 + 104 + 103 + 105) ÷ 5 = $103. Notice the average only moved up $1, even though the latest print landed well above the previous average. That's because the old $100 close is still in the window, dragging things down until it rolls off.
| Day | Close | 5-Day SMA |
|---|---|---|
| Days 1-5 | $100, $102, $101, $104, $103 | $102.00 |
| Day 6 ($100 rolls off) | $105 | $103.00 |
Common SMA Periods We Watch
- 20-day SMA: short-term trend, popular with swing traders
- 50-day SMA: medium-term trend, widely tracked by institutional desks
- 100-day SMA: longer-term trend confirmation
- 200-day SMA: the benchmark line for deciding whether a market is broadly bullish or bearish
Exponential Moving Average: How It Works
An Exponential Moving Average uses a weighting multiplier so recent prices count for more than older ones. The formula applies a smoothing constant, typically 2 ÷ (number of periods + 1), to blend the newest close with yesterday's EMA value. For a 5-period EMA, that multiplier works out to 2 ÷ 6, or about 0.33.
Run the same price series ($100, $102, $101, $104, $103, then $105) through an EMA and you'll see it was already tilting upward before that final print landed, and it reacts to the $105 close more sharply than the SMA does. The practical effect: EMA lines hug price more closely and turn corners faster.
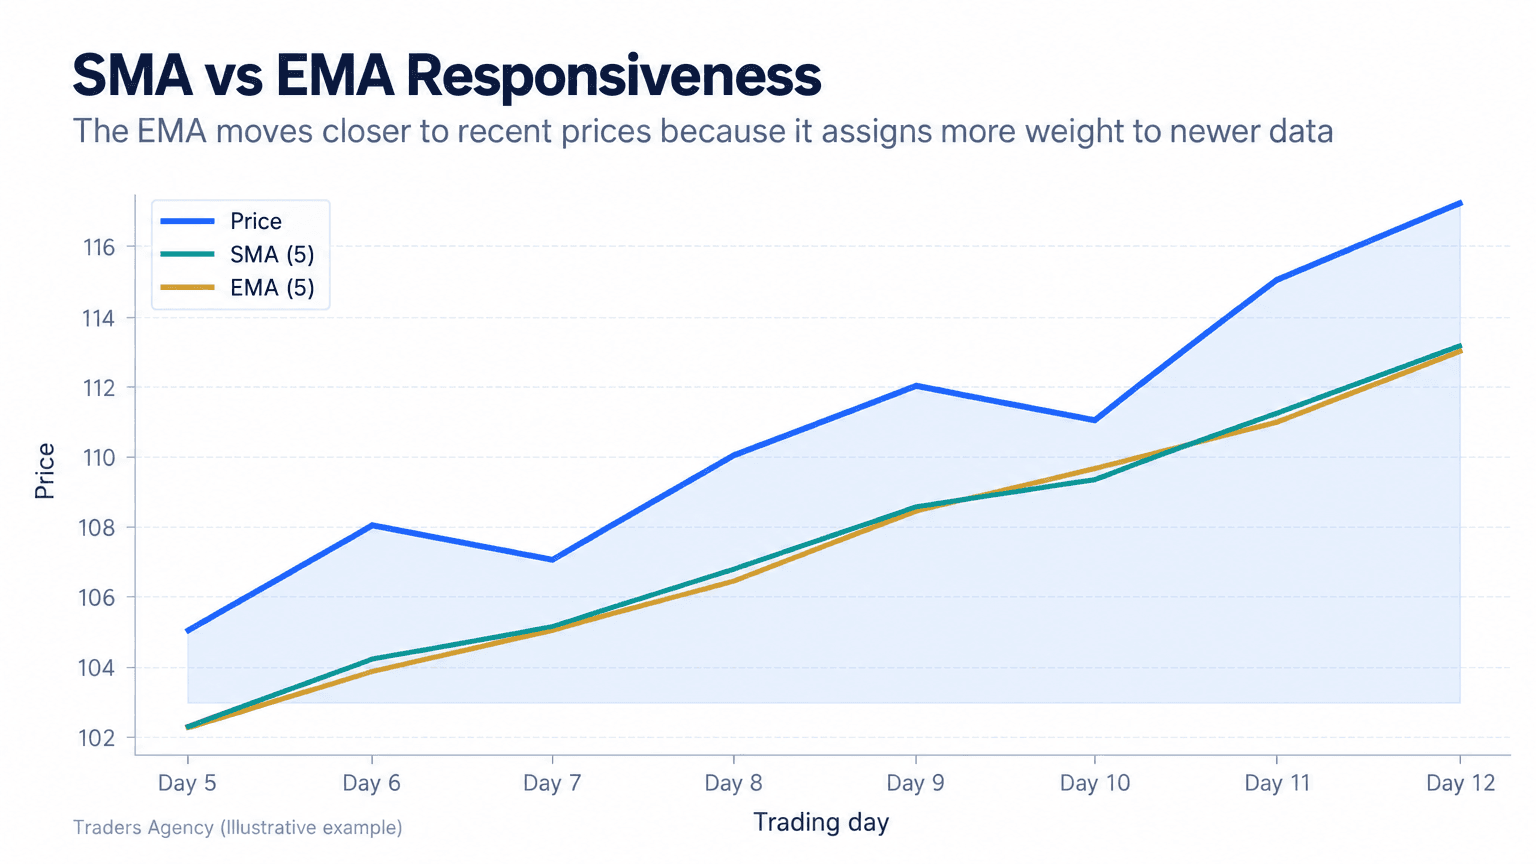
Side by side, you can see the EMA bending toward price sooner while the SMA lags behind and smooths out more of the move. If you want to build this comparison yourself, it takes about ten seconds on any charting platform: add both indicators to the same chart, set them to the same period, and overlay them on one candlestick series.
Want expert trading insights delivered daily?
Join thousands of traders who rely on Traders Agency for market analysis and trade ideas.
Join Traders AgencyWhich Is Better, EMA or SMA?
Neither one is universally better, and we'd be suspicious of anyone who tells you otherwise. EMA suits faster-moving strategies like day trading because it reacts quickly. SMA suits longer-term trend confirmation because it filters out more noise.
The honest answer depends on your trading style and timeframe. A day trader working 5-minute candles usually wants EMA's responsiveness to catch moves early. A position trader watching a 200-day average usually wants SMA's steadiness so they don't get whipsawed by every short-term wiggle.
There's also a third option worth knowing about: the Weighted Moving Average (WMA), which assigns weights linearly instead of exponentially. WMA sits between the other two: faster than SMA, but calculated differently than EMA's smoothing formula. Our advice for newer traders is to master SMA and EMA first. Add WMA later, once you actually know what problem you're trying to solve with it.
Quick Comparison
| Characteristic | SMA | EMA |
|---|---|---|
| Calculation weight | All prices equal | Recent prices weighted more |
| Speed of reaction | Slower | Faster |
| Line smoothness | Smoother, less jumpy | Choppier, hugs price |
| False signals in chop | Fewer | More |
| Best use case | Trend confirmation | Active trading, momentum shifts |
When Should You Use SMA vs EMA?
For day trading, we lean toward EMA. Day traders need signals that reflect current price action, not an average padded with data from hours ago. On 1-minute, 5-minute, or 15-minute charts, a few bars of lag can mean missing the entry completely.
Swing traders and position traders often prefer SMA, especially on daily or weekly charts, because the smoother line filters out the short-term noise that would otherwise trigger an exit too early. The 200-day SMA in particular is one of the most widely referenced lines in all of technical analysis for judging whether a market is broadly bullish or bearish.
Here's the middle ground our team uses most often, and it works well as a starting template:
- Step 1: Use EMAs for the short periods (8, 9, or 20) to catch momentum shifts as early as possible.
- Step 2: Use SMAs for the long periods (50, 100, 200) to define the bigger trend you're trading with or against.
- Step 3: Only take signals that agree with the long-period line. A short-term EMA cross higher means more when price is already above the 200-day SMA.
What Are Golden Cross and Death Cross Signals?
A golden cross happens when a shorter-term moving average crosses above a longer-term moving average, often signaling the start of an uptrend. A death cross is the mirror image: a shorter-term average crossing below a longer-term one, often signaling the start of a downtrend.
The most widely followed version uses the 50-day and 200-day averages, though the same logic applies to 20-day and 50-day EMAs on shorter timeframes. Here's a worked example. Say a stock's 20-day EMA has been sitting below its 50-day EMA for weeks while price consolidates sideways. Then price starts climbing, and the 20-day EMA pushes above the 50-day EMA. That crossover is the golden cross, and many traders treat it as confirmation that upward momentum has real support behind it.
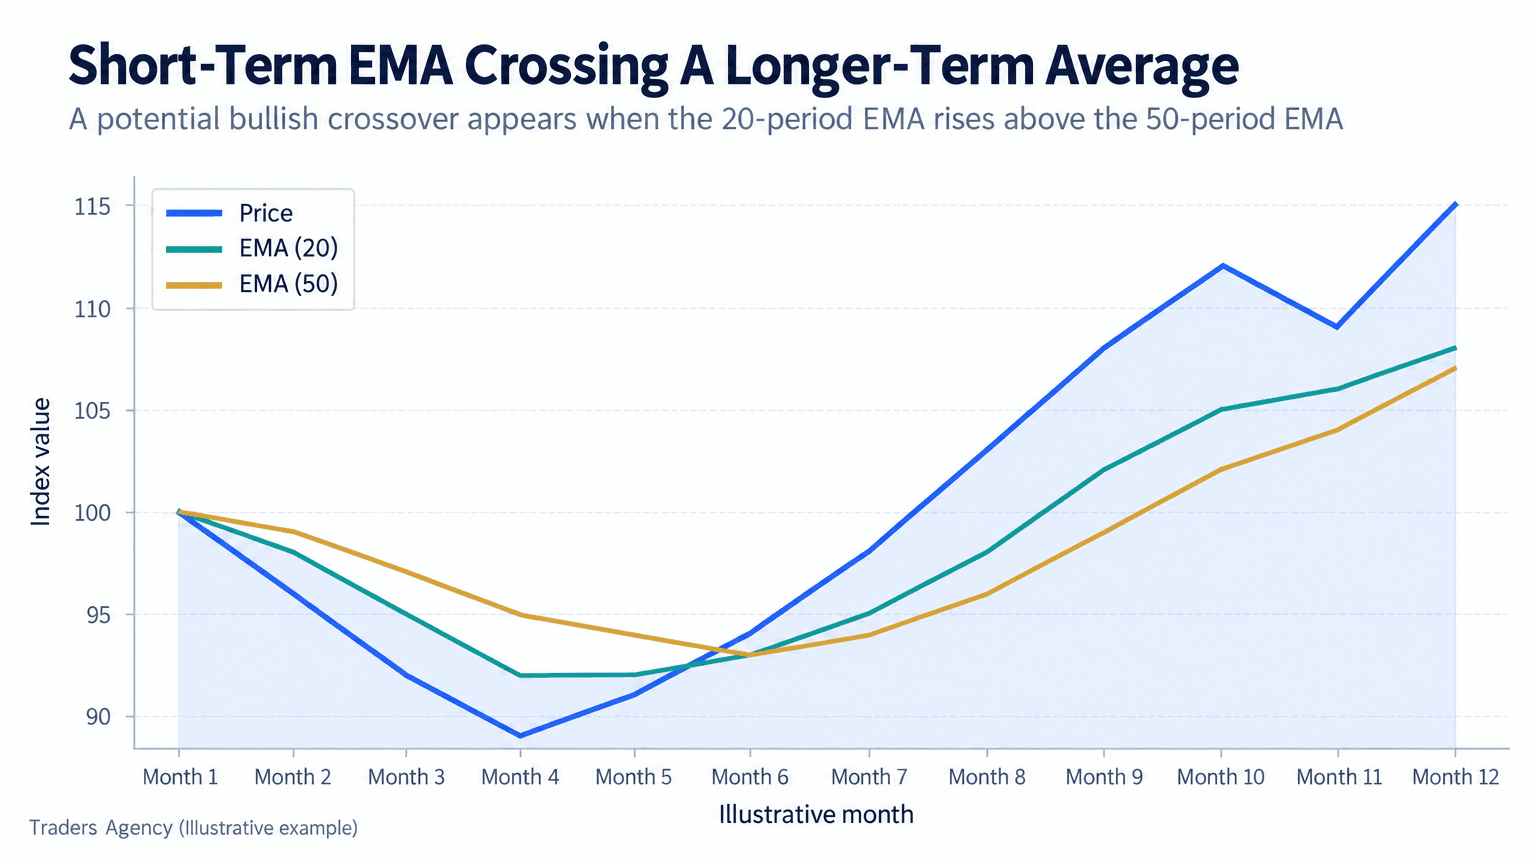
These crossovers are a starting point, not a complete strategy framework on their own. Plenty of traders build entire swing-trading systems around watching for golden and death crosses on the daily chart, then dropping to a shorter timeframe to time the actual entry.
How Do You Combine Moving Averages With Other Indicators?
Moving averages do their best work as confirmation tools, not stand-alone signals. Acting on a single crossover with no other input is one of the most common mistakes we see from newer traders.
Lag, False Signals, and What That Costs You
Both SMA and EMA are lagging indicators. They're built entirely from past price data, which means they will always confirm a move after it has already begun. EMA lags less than SMA, but it still lags, and that speed advantage comes with a tradeoff: more sensitivity to short-term noise produces more false signals in choppy, sideways markets.
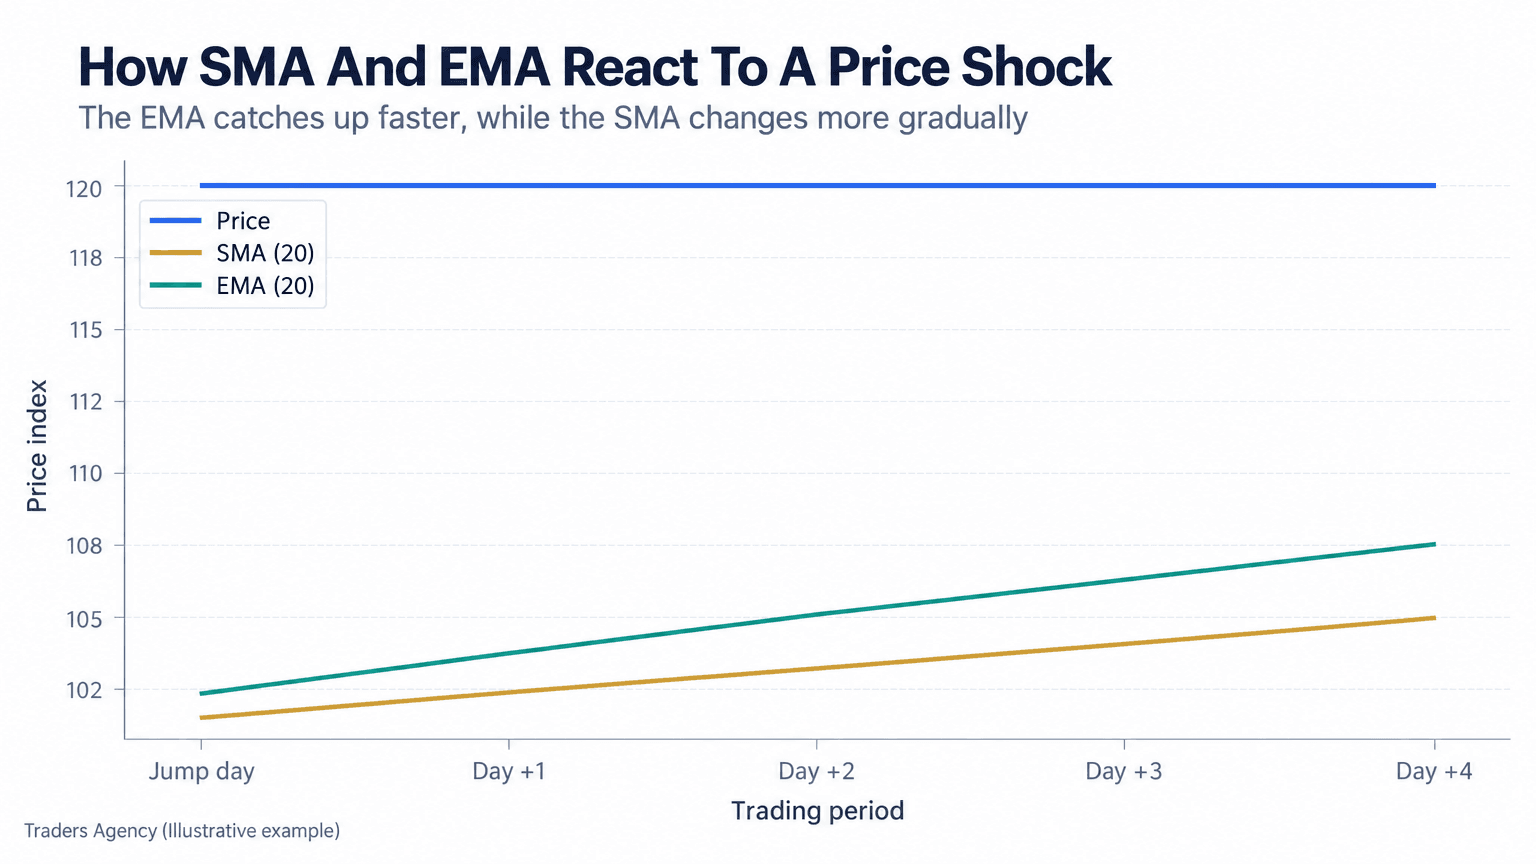
Watch how the EMA catches up to the price jump far sooner than the SMA does. That's a real edge in a trending market. In a range-bound market, that exact same sensitivity fires a signal that reverses on you a day later.
Pairing Moving Averages With Confirmation Tools
- RSI (Relative Strength Index): tells you whether a crossover is happening in overbought or oversold territory
- Volume: a golden cross on rising volume carries far more weight than one on thin volume
- Support and resistance: moving averages frequently act as dynamic support or resistance, so study how price behaves when it touches the line
- MACD: built from EMAs itself, which makes it a natural second opinion on momentum shifts
Practical Application: Risk and Position Sizing
We never recommend trading a moving average crossover as your only signal. Treat it as one piece of a broader setup that includes a defined stop loss, a sensible position size, and a plan for both the best and the worst outcome.
Our baseline: risk no more than 1% to 2% of your account on any single trade built around a moving average signal, and place your stop below (or above) a recent swing point rather than at an arbitrary dollar figure. If the crossover fails and price reverses hard, you want a predetermined exit, not a decision made under pressure.
Watch Out: Avoid trading moving average crossovers in extremely choppy or low-volume conditions. Both SMA and EMA lose reliability when price isn't trending in a clear direction, and that's exactly where crossover signals produce the most whipsaws.
If you want to keep building your technical analysis foundation after this guide, the Cboe publishes free educational material on indicators and market structure, and the Federal Reserve site is a solid place to track the macro data that drives the trends these averages are measuring.
Remember This: Use EMA when you need speed, use SMA when you need confirmation, and never take either one as a signal on its own. The line tells you what price has done. Your plan tells you what to do about it.
Want expert trading insights delivered daily?
Join thousands of traders who rely on Traders Agency for market analysis and trade ideas.
Join Traders AgencyDISCLAIMER: Traders Agency does not offer financial advice. The information provided is for educational purposes only and should not be considered financial advice. Traders Agency is not responsible for any financial losses or consequences resulting from the use of the information provided. Trading carries inherent risks and may not be suitable for all individuals. You are advised to conduct your own research and seek personalized advice before making any investment decisions, recognizing the potential risks and rewards involved.
See more from Traders Agency on Google
Make us a preferred source and our market analysis will appear more prominently in your Google Search, Top Stories, and AI results.
Add to Preferred Sources