
Unusual options activity is order flow that breaks sharply from a contract's normal trading pattern, usually flagged when volume overwhelms open interest or when large, aggressive orders hit the tape outside typical size. Traders use it to infer where institutions and informed money may be positioning ahead of a known event. It is not a guarantee of direction. It is a probability signal that demands context, and in this guide our education team will show you exactly how to read it.
You have probably seen the screenshot: some trader spots 10,000 call contracts sweep across three exchanges in under a minute, and the stock rips 12% two days later. That story gets repeated so often it starts to sound like a cheat code. It isn't.
We have spent years teaching traders how to read options flow properly, and the gap between "I saw a big print" and "I understand what that print means" is where most retail accounts bleed out. This article walks through how we interpret unusual options activity at a professional level: how to screen for it, how to tell a sweep from a block, how to read strike and expiry selection the way an institutional desk would, and how to build a defined-risk trade around a flow signal instead of blindly copying it.
By the end, you will know how to run your own screening process, sidestep the most common false-signal traps, and size a flow-based trade so that a wrong read does not wreck your account.
What Is Unusual Options Activity?
Bottom Line: Unusual options activity is a probability signal, not a directional guarantee, and its value depends on context like sweep versus block, strike and expiry selection, and how crowded the trade already is. Traders who treat it as one input for building a defined-risk position tend to fare better than those who copy a print outright.
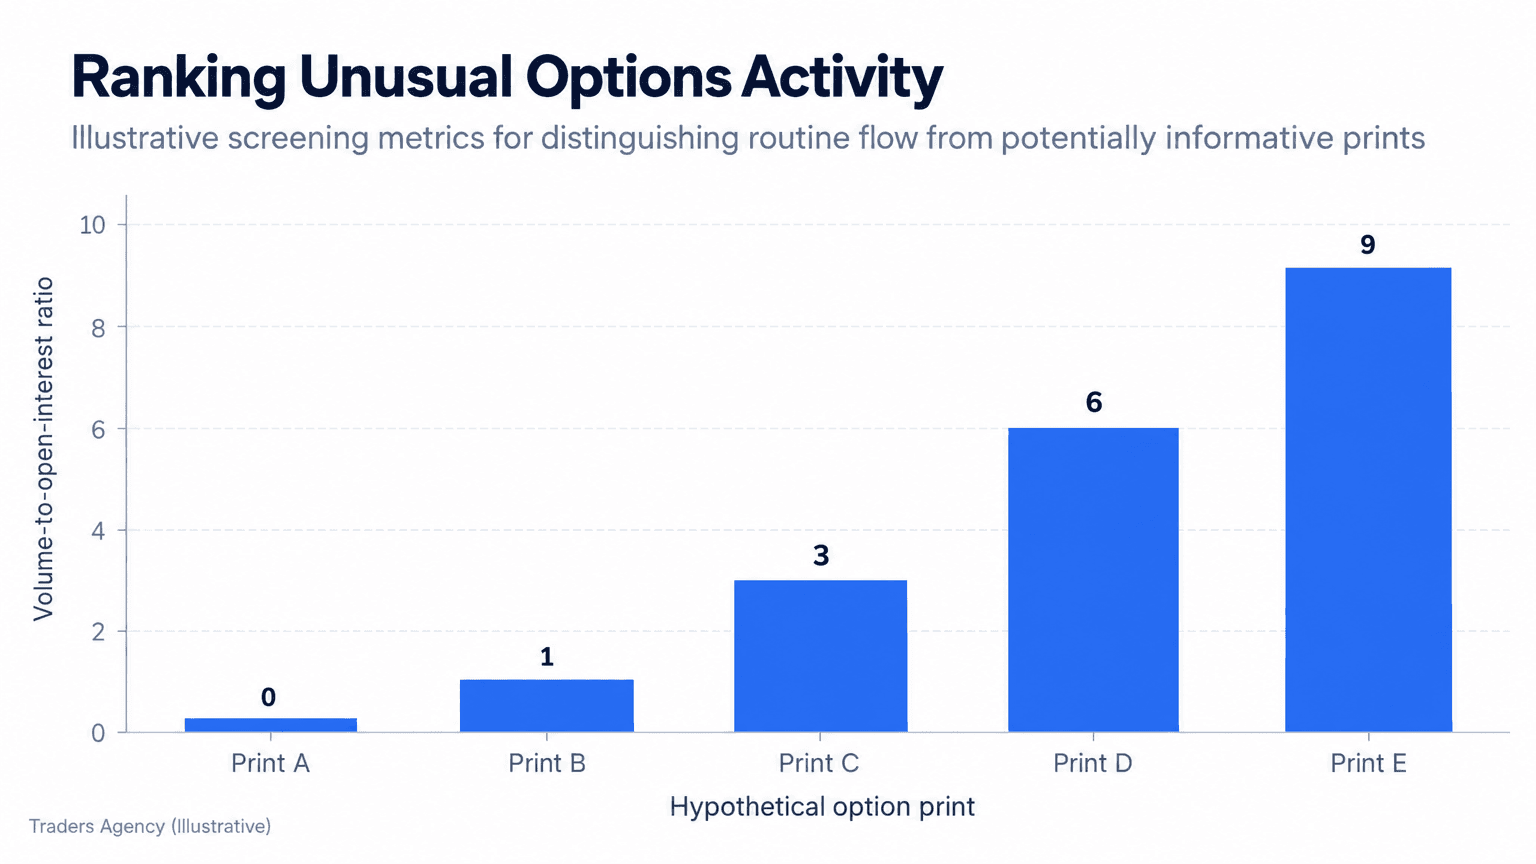
Unusual options activity refers to options contracts trading at volumes significantly higher than their existing open interest, or orders executed with unusual size, speed, or aggression relative to that contract's normal liquidity. It is typically measured with a volume-to-open-interest ratio, where a reading above 2x to 3x flags a contract for closer review.
The logic is straightforward. Open interest tells you how many contracts already exist. Volume tells you how many traded today. When volume dwarfs open interest, new positions are being opened at a pace that is not organic retail behavior. It is often a fund, a market maker, or an informed trader taking a fresh stance.
That does not mean every unusual print is "smart money." Plenty of unusual activity is hedging, rolling, or market-maker inventory management with no directional opinion attached. Reading the print correctly is the entire skill.
Key Concept: Volume tells you what traded today. Open interest tells you what already existed. When volume runs 3x or more above open interest on a specific strike and expiry, new money is opening fresh positions, and that is worth investigating.
Our Five Screening Criteria
When we build a screen for unusual options activity, these are the five inputs we insist on:
- Volume-to-open-interest ratio above 3x on the specific strike and expiry, not the ticker as a whole.
- Premium spent, not just contract count. A $50,000 sweep matters far more than a $2,000 one.
- Time to expiration, since short-dated flow implies urgency and near-term conviction.
- Strike distance from spot. Far out-of-the-money buying suggests a lottery-style bet, while near-the-money flow suggests a higher-conviction directional view.
- Order type, sweep versus block, which tells you how the trade was executed and why that execution choice matters.
What Does Unusual Options Activity Actually Mean?
Unusual options activity means someone is establishing a position of meaningful size relative to a contract's normal trading pattern. What that position means depends entirely on context. It could signal informed conviction, a hedge against an existing stock position, or a market maker adjusting exposure. It is a clue, not a conclusion.
We teach our members to treat every unusual print as a question rather than an answer. Who is on the other side? Is this an opening trade or a closing trade? Is the buyer paying the ask aggressively, which suggests urgency, or resting a bid, which suggests patience?
Daily volume is published by the exchanges, and open interest is compiled and published by the OCC, and cross-referencing that public data against a flow tool is how you begin separating noise from signal. The Cboe market statistics pages are a good free starting point for verifying what a scanner shows you.
A single sweep on a mid-cap biotech ahead of an FDA decision date reads very differently than the same sweep on a mega-cap tech name with nothing scheduled on the calendar. Context is what turns a data point into a thesis.
How Do You Find Unusual Options Activity?
Finding unusual options activity requires either a dedicated scanner that flags volume-to-open-interest anomalies in real time, or a manual process of screening options chains for contracts trading well above their typical volume. Most active traders we work with use both: a paid scanner for speed, and manual verification for context.
Building Your Screening Workflow
There is a real market now for the unusual options activity scanner, with paid platforms offering real-time alerts, sweep detection, and historical flow databases. Some traders start with a free unusual options activity scanner, and several brokers now build basic flow alerts directly into their platforms at no extra cost, though the depth and speed lag well behind paid tools.
If you would rather build your own process than pay for one, here is the workflow we recommend:
- Pull the data. Gather end-of-day options volume and open interest for every name on your watchlist.
- Apply the ratio filter. Flag any contract where volume exceeds 3x open interest.
- Cross-check premium size. A $10,000 print is not the same conversation as a $500,000 one.
- Check the calendar. Does the underlying have upcoming earnings, an FDA date, an investor day, or a macro event that would explain the flow?
- Log and track. Record the print and follow what actually happens over the next 1 to 5 sessions. This log becomes your personal edge database.
Some traders build a custom feed using an unusual options activity API, pulling raw exchange data and running their own filters rather than trusting a third-party dashboard. That is the more advanced route, and it hands you control over your thresholds instead of accepting a vendor's default sensitivity. Others plot flagged strikes directly on TradingView overlays so flow signals and technical structure sit on the same screen.
You will also find endless discussion in unusual options activity threads on social platforms, where retail traders post screenshots of large prints. Treat those as anecdotes, not research. By the time a print is trending publicly, the edge, if there ever was one, is largely gone.
Want expert trading insights delivered daily?
Join thousands of traders who rely on Traders Agency for market analysis and trade ideas.
Join Traders AgencyWhat Is the Difference Between a Sweep and a Block Trade?
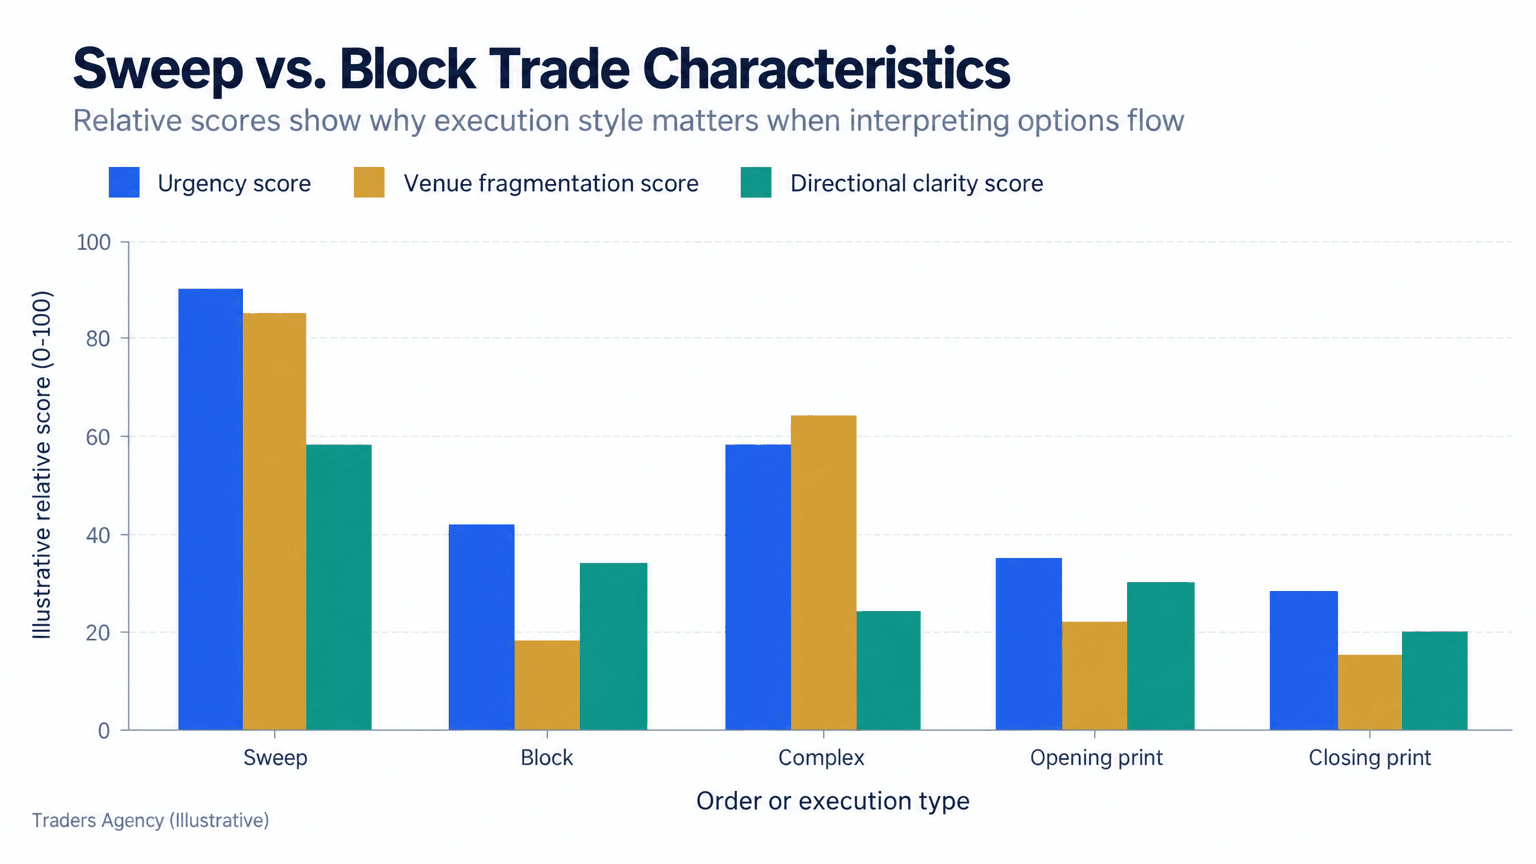
A sweep is an order broken up and executed simultaneously across multiple exchanges to fill as fast as possible, which signals urgency. A block trade is a single large order, often negotiated privately and reported after the fact, which usually signals a deliberate, less time-sensitive position.
The distinction matters more than most retail flow-followers realize. A sweep paying the ask across five exchanges in seconds tells you the buyer wanted fills now, at nearly any price, because they believed the option's value was about to change. That is urgency. A block negotiated at a single strike, frequently at a price between the bid and ask, tells you two parties agreed on size and price without that time pressure. That is often institutional hedging or portfolio adjustment rather than a directional bet.
| Characteristic | Sweep | Block |
|---|---|---|
| Execution | Split across multiple exchanges in seconds | Single negotiated fill, often reported late |
| Price paid | Crosses the spread, pays the ask | Frequently mid-spread |
| Implied urgency | High | Low to moderate |
| Most common intent | Near-term directional conviction | Hedging, rolling, portfolio adjustment |
| Our weighting for short-term theses | Heavier | Lighter |
We weight sweeps more heavily than blocks when building a short-term thesis precisely because urgency is informative. Someone willing to cross the spread aggressively across fragmented venues is telling you they do not want to wait.
Complex Orders and Multi-Leg Prints
Advanced flow readers also have to watch for complex orders: multi-leg trades like spreads, straddles, or collars executed as a single package. Newer traders scanning raw call or put volume mistake these for simple directional bets all the time.
A trader buying downside protection on 50,000 shares through a put spread is not betting the stock falls. They are insuring an existing long position. If you only see the put volume without recognizing the paired leg, you will misread a hedge as a bearish signal.
Watch Out: This is the single most common flow-reading mistake we see. Before you label a large put print "bearish," check whether it is one leg of a spread or a collar wrapped around an existing stock position.
Reading Strike Selection and Expiry for Institutional Intent
Strike and expiry selection reveal how much conviction and time pressure sit behind an unusual print. Near-the-money strikes with short expiries suggest high-conviction, near-term directional views. Far out-of-the-money strikes with longer expiries more often reflect cheap speculative positions or asymmetric bets with lower implied probability.
A Worked Example
Say a stock is trading at $84. On a Tuesday afternoon, you spot a sweep of 8,000 call contracts at the $90 strike expiring in 11 days, paying $1.40 per contract. That is roughly $1.12 million in premium, executed in under 90 seconds across four exchanges.
Here is how we break that down:
| Input | Reading |
|---|---|
| Strike distance | $90 is about 7% out-of-the-money: meaningful, but not a lottery ticket |
| Expiry | 11 days is short enough to imply a move is expected soon, likely around a scheduled event |
| Execution type | Sweep, meaning urgency, meaning the buyer wanted exposure immediately |
| Premium size | Over $1 million on a short-dated OTM position is real conviction, not a rounding error |
Now compare that to a block of 500 contracts at the $100 strike expiring in 60 days, paying $0.60, filled at a negotiated mid-spread price. Same underlying, same call side, completely different message. The second trade reads far more like a slowly built position or one hedge component inside a larger book, not an urgent directional bet.
How Do You Turn a Flow Signal Into a Defined-Risk Trade?
An unusual options activity strategy built for advanced traders uses flow as an idea filter, then expresses the resulting thesis through your own defined-risk structure rather than copying the exact strike and expiry of the original print. That single discipline separates professional flow trading from speculative mirroring.
Step-by-Step: Structuring the Trade
- Step 1: Confirm the signal. Verify the volume-to-open-interest ratio, premium spent, execution type, and whether a scheduled event explains the urgency.
- Step 2: Form your own thesis. Does your chart work support the direction the flow implies? Is there support, a breakout level, or a trend in agreement?
- Step 3: Choose a structure you control. Instead of buying the same 11-day out-of-the-money calls and eating the theta decay, build a spread that buys you time and caps your downside.
- Step 4: Size it as speculation. Cap the position at 1% to 2% of account value before you place the order.
- Step 5: Define your exit in advance. Know your profit target, your time stop, and the price level that invalidates the thesis.
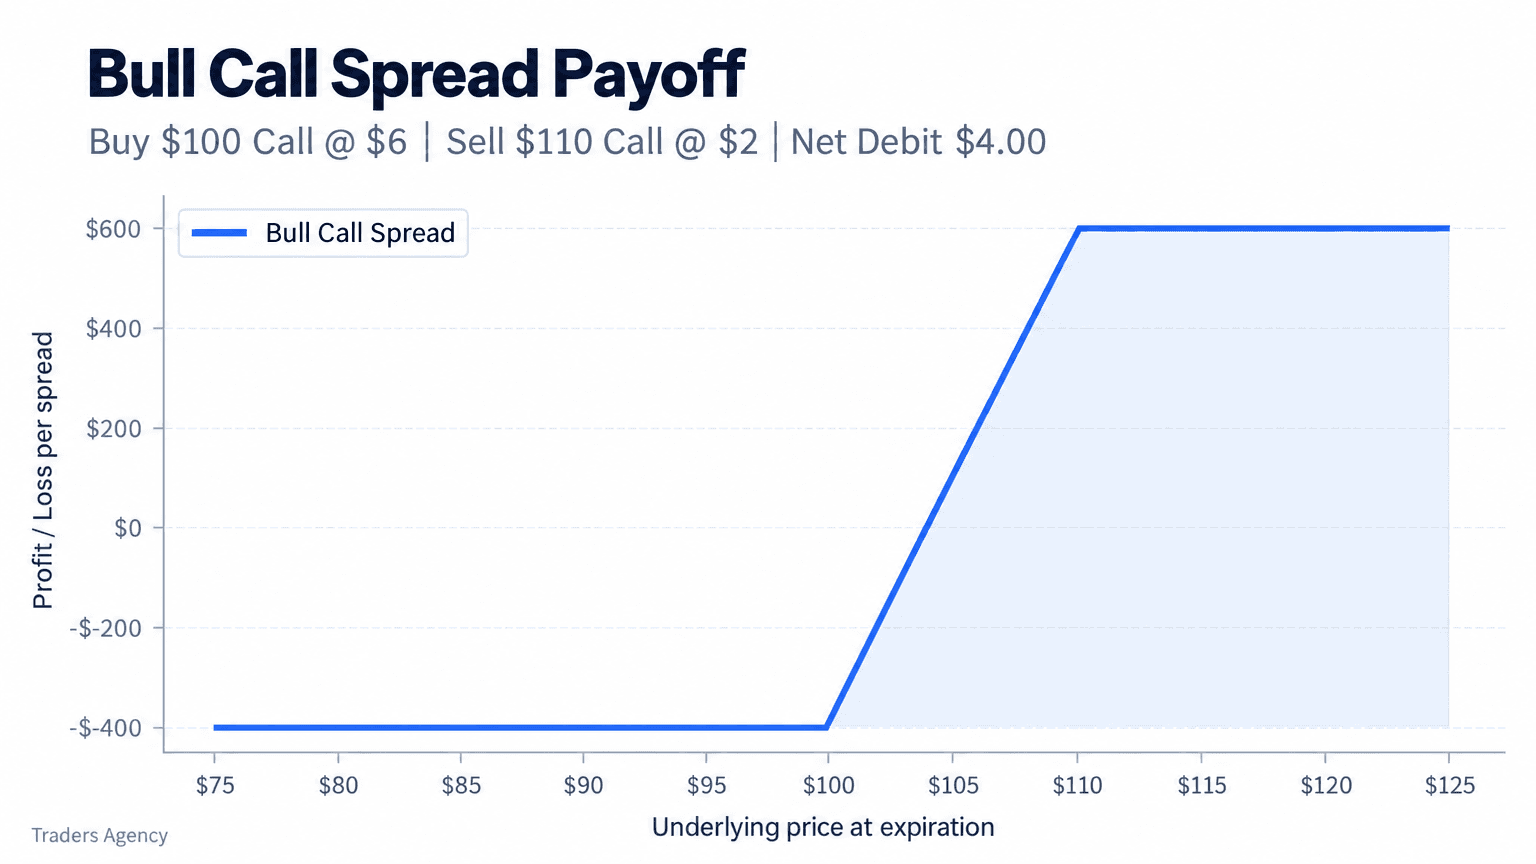
Going back to that $90 strike sweep on the $84 stock, here is how we would more often express it: a bull call spread with more runway than the original print.
| Parameter | Value |
|---|---|
| Stock price | $84 |
| Buy | $86 call, 30 days out, for $2.80 |
| Sell | $92 call, 30 days out, for $1.10 |
| Net debit | $1.70 per spread |
| Breakeven | $87.70 |
| Max gain | $4.30 per spread (stock at or above $92 at expiry) |
| Max loss | $1.70 per spread (stock at or below $86 at expiry) |
This structure gives you nearly three times the time window of the original 11-day sweep, caps your risk at the $1.70 debit paid, and pays you only if the stock closes above the $87.70 breakeven, with the full $4.30 gain requiring a close at or above $92.
Risk Management When Trading Flow Signals
Trading unusual options activity carries real false-signal risk, because flow data can reflect hedging, rolling positions, or market-maker adjustments rather than genuine directional conviction. Sound risk management here means small size, defined-risk structures, and never treating a single print as confirmation on its own.
Our Position Sizing Rule
We cap any single flow-based trade at 1% to 2% of total account value and treat it as a speculative allocation, never a core position. Flow signals are probabilistic. Even well-read institutional prints fail to play out a meaningful percentage of the time, and your sizing has to assume that from the start.
Watch Out: The five mistakes that cost flow traders the most money:
- Chasing the print after the move. Once a sweep is circulating publicly, the edge is usually gone.
- Copying exact strikes and expiries without adjusting for your own risk tolerance and account size.
- Ignoring the hedge possibility. Not every large put buy is bearish. Ask whether the buyer likely owns the stock.
- Overweighting a single data point. One print without corroborating volume, technical structure, or a scheduled event is thin evidence.
- Skipping the exit plan. Flow trades deserve the same defined stops and targets as every other position you hold.
We also remind members that flow analysis works best as a supplement to technical and fundamental work, not a replacement for it. Flow tells you where money may be moving. Your own chart work and event research tell you whether that move makes sense.
Frequently Asked Questions
What is unusual options activity?
It is options volume or order execution that significantly exceeds a contract's normal pattern, often measured by a volume-to-open-interest ratio above 3x, suggesting new institutional or informed positioning.
What does unusual options activity mean for a stock's direction?
It tells you someone is taking a meaningful position, but it does not confirm direction on its own. Hedges, rolls, and market-maker flow can produce the same signal as a genuine directional bet.
How do you find unusual options activity without a paid tool?
Manually screen options chains for volume exceeding open interest by 3x or more, then check premium size and the event calendar. A dedicated scanner is faster and more reliable for real-time alerts, but the manual method teaches you more.
How does an unusual options activity scanner work?
It continuously compares real-time volume against existing open interest across thousands of contracts, flagging outliers based on preset thresholds like ratio size, premium spent, and execution speed.
Is a sweep more significant than a block trade?
Generally yes for short-term theses, since a sweep signals urgency by crossing multiple exchanges quickly, while a block often reflects a slower, negotiated position with far less time pressure.
Can retail traders profitably follow unusual options activity?
It is possible, but it requires disciplined position sizing, defined-risk structures, and healthy skepticism toward any signal that is already widely shared. Crowded, publicly discussed prints tend to carry diminished edge.
Want expert trading insights delivered daily?
Join thousands of traders who rely on Traders Agency for market analysis and trade ideas.
Join Traders AgencyDISCLAIMER: Traders Agency does not offer financial advice. The information provided is for educational purposes only and should not be considered financial advice. Traders Agency is not responsible for any financial losses or consequences resulting from the use of the information provided. Trading carries inherent risks and may not be suitable for all individuals. You are advised to conduct your own research and seek personalized advice before making any investment decisions, recognizing the potential risks and rewards involved.
See more from Traders Agency on Google
Make us a preferred source and our market analysis will appear more prominently in your Google Search, Top Stories, and AI results.
Add to Preferred Sources