
An options chain is simply a table listing every available call and put option for a stock, organized by strike price and expiration date. It shows you the price, trading activity, and risk data for each contract. Once you understand the columns, the whole table stops looking like a wall of numbers and starts looking like a map of what other traders expect a stock to do.
You've probably opened an options chain before, maybe on Fidelity, Schwab, or another broker's platform, and felt a little overwhelmed. Rows of numbers, columns with abbreviations like IV and OI, colors that seem to mean something but you're not sure what. That reaction is normal. Every options trader has stared at that same screen on day one.
In this guide, we'll teach you exactly how to read an options chain, column by column, so you can confidently pull up any stock's chain and understand what you're looking at within seconds. By the end, you'll know what strike prices and expiration dates mean, how calls differ from puts in the layout, what bid/ask, volume, and open interest actually tell you, and how to spot liquid options worth trading versus ones you should avoid.
What Is an Options Chain?
Bottom Line: Reading an options chain comes down to matching strike price, expiration, and the bid/ask, volume, and open interest columns to gauge a contract's cost and liquidity. Once you can scan those columns quickly, the chain becomes a readable snapshot of market expectations rather than a confusing wall of numbers.
An options chain (sometimes called an option chain or options matrix) is a listing of all the call and put contracts available for a particular stock or ETF, broken out by expiration date and strike price. Think of it as a menu: the stock is the restaurant, and each row is a different dish (contract) with its own price and details.
Every options chain organizes itself around three core pieces of information:
- Expiration date: when the contract stops existing
- Strike price: the price at which the option lets you buy or sell the stock
- Contract type: whether it's a call (right to buy) or a put (right to sell)
Around those three anchors, the chain adds pricing and activity data: bid, ask, volume, open interest, and implied volatility. If you've never opened one before, just remember this: a chain is a snapshot of every bet currently being made on where a stock is headed, organized into one table. Contract specifications and listing standards are set at the exchange level, and you can review how listed options are structured directly at Cboe.
Key Concept: An options chain answers two questions for every contract listed: at what price (the strike) and by when (the expiration). Everything else on the table is pricing and activity data built around those two anchors.
Most major brokers display the chain the same general way, though the exact layout differs slightly. Learning how to read an options chain on one platform (say, Fidelity or Schwab) makes it much easier to read one anywhere else, because the underlying structure barely changes.
How Do You Read an Options Chain Step by Step?
To read an options chain step by step: select the stock, choose an expiration date, scan the strike prices in the center column, then compare calls on the left against puts on the right. Each row shows pricing and activity for that specific strike and expiration.
Here's the process we walk new members through when they open a chain for the first time.
- Step 1: Pull up the stock and open the chain. On most platforms, you search the ticker symbol and click an "Options" or "Chain" tab. On Fidelity, this sits under the trade ticket for the symbol. On Schwab's thinkorswim and web platform, it's a dedicated "Options Chain" link right next to the quote.
- Step 2: Select an expiration date. You'll see a row or dropdown of dates, usually weekly for the next month and monthly further out. Click one, and the entire chain refreshes to show only contracts expiring that day. This is the step most beginners miss. If your chain looks "wrong," check that you're actually looking at the expiration you intended.
- Step 3: Find the current stock price. Most chains highlight or center the table around the stock's current price. This is your reference point for everything else on the page.
- Step 4: Read across the row. Each row represents one strike price. Calls sit on the left side of that row, puts on the right. The strike itself usually sits in the middle column.
- Step 5: Compare multiple strikes. Scroll up and down to see how price, volume, and open interest change as the strike moves further from the current stock price. This comparison is really the heart of analyzing a chain: you're looking for where the activity and pricing make sense for your strategy.
What Do Strike Price and Expiration Date Mean on an Options Chain?
The strike price is the fixed price at which an option allows you to buy (call) or sell (put) the underlying stock. The expiration date is the last day that option exists before it becomes worthless or gets exercised.
Say a stock is trading at $100. You'll see strikes listed at $90, $95, $100, $105, $110, and so on, spaced in $1, $2.50, or $5 increments depending on the stock and how far from the current price you look. Strikes closer to the stock price are usually spaced tighter, because that's where most trading interest sits.
Expiration dates matter just as much. A call option with a strike of $100 expiring in one week behaves very differently from the same $100 strike expiring in six months. The shorter-dated option loses value faster as time passes (a concept called time decay), while the longer-dated one has more time for the stock to move in your favor, but usually costs more upfront.
A quick mental model: strike price answers "at what price," and expiration date answers "by when." You need both to understand what you're actually buying.
Want expert trading insights delivered daily?
Join thousands of traders who rely on Traders Agency for market analysis and trade ideas.
Join Traders AgencyHow Do Calls and Puts Differ on an Options Chain?
Calls give the buyer the right to purchase stock at the strike price, and they sit on the left half of a standard options chain. Puts give the buyer the right to sell stock at the strike price, and they sit on the right half. The strike price column runs down the middle, shared by both sides.
This layout is close to universal across brokers, which is why learning it once pays off no matter which platform you end up using. Scan left of the strike column and you're reading call data: bid, ask, volume, open interest, all specific to calls. Scan right of that same strike row and you're reading the identical data points, but for puts.
A simple way to remember it: calls lean toward betting a stock goes up, puts lean toward betting it goes down (or protecting against a drop). Reading both sides at the same strike tells you how the market is pricing optimism versus pessimism at that exact price point.
Beginners often make the mistake of only looking at one side of the chain. We recommend scanning both every time, even if you only plan to trade one direction, because the relationship between call and put pricing at the same strike reveals information about how the market expects the stock to move.
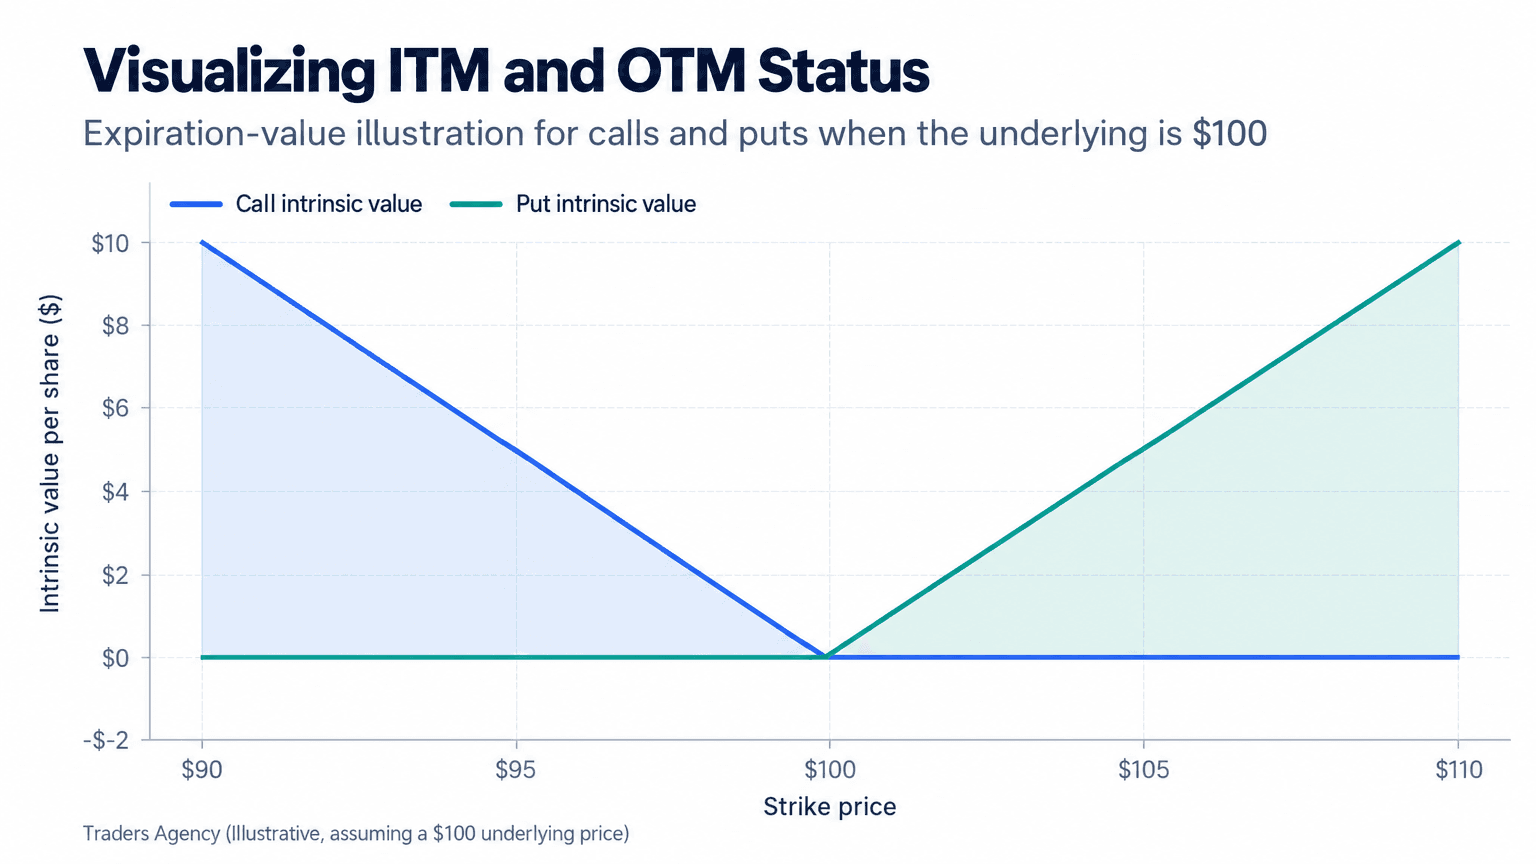
This is also where in-the-money (ITM) and out-of-the-money (OTM) coloring comes in. Most platforms shade ITM options (ones that already have real value based on the stock price) in a different color, usually a light yellow or gray background, than OTM options (ones with no built-in value yet). For a call, ITM means the strike is below the current stock price. For a put, ITM means the strike is above it. That shading is a visual shortcut so you don't have to calculate intrinsic value by hand every time.
What Do Bid/Ask, Volume, and Open Interest Mean?
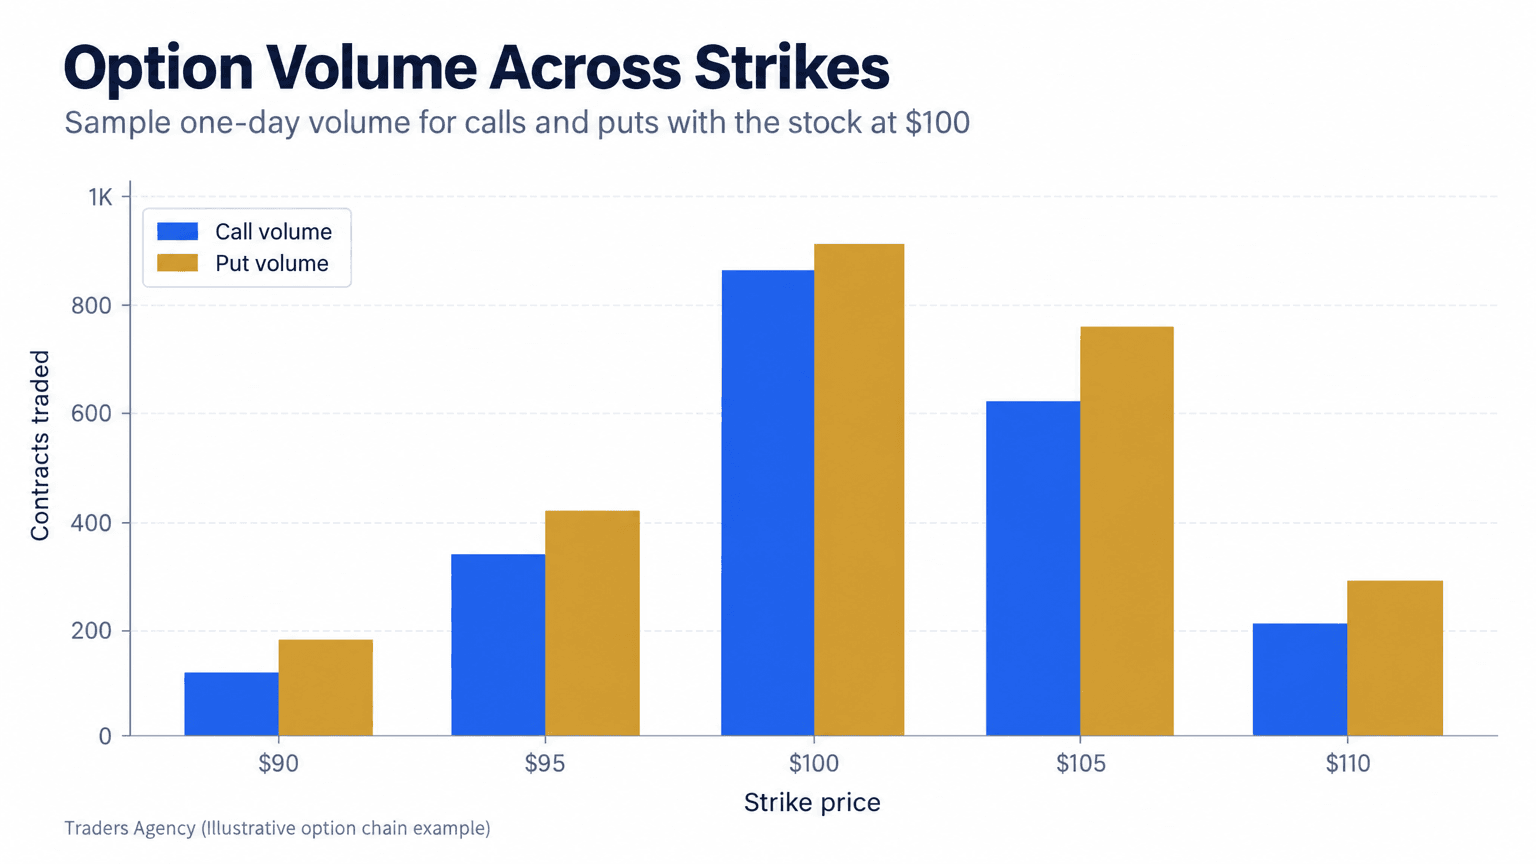
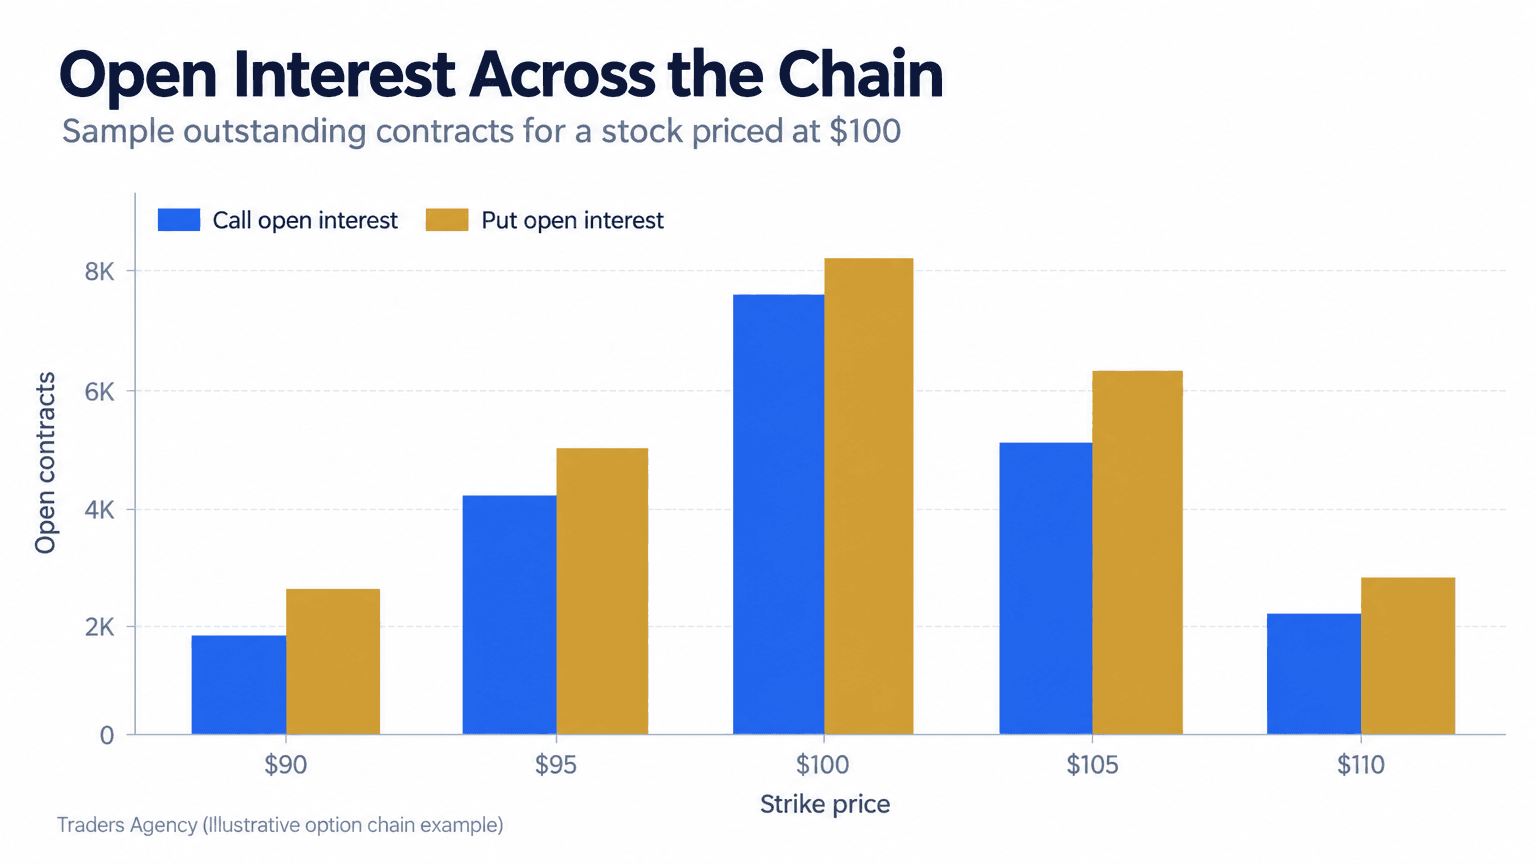
Bid is the highest price a buyer is currently willing to pay for an option, and ask is the lowest price a seller will accept. Volume is how many contracts traded today, and open interest is how many contracts remain open (not yet closed or expired) across all trading days.
These four columns make up the core of any option chain quote, and they're the pieces most beginners skip over too quickly.
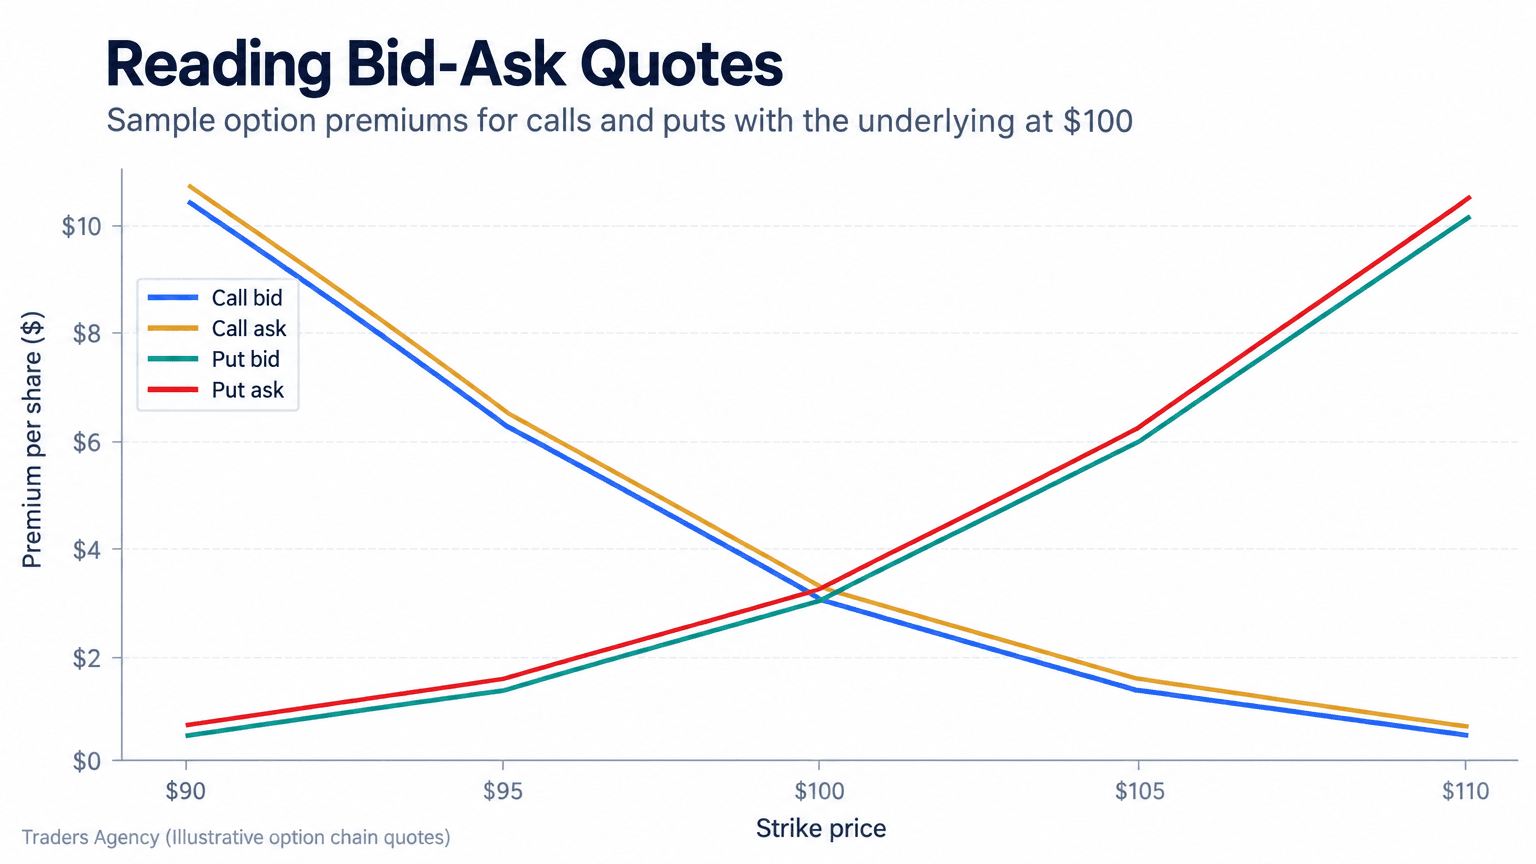
The gap between bid and ask is the bid-ask spread. A narrow spread (say, $1.95 bid and $2.00 ask) usually signals a liquid, actively traded contract. A wide spread (like $1.50 bid and $2.50 ask) often means fewer traders are active in that contract, and you'll likely pay more to get in or out quickly.
Volume tells you about today's activity specifically. If a contract shows volume of 4,200, that means 4,200 of those exact contracts changed hands during the current session.
Open interest tells a different story: total contracts still outstanding, built up over many trading days. A strike with open interest of 15,000 has a lot of history and standing positions behind it, which usually correlates with easier entries and exits.
Finally, implied volatility (IV) is a percentage reflecting how much the market expects the stock to move before expiration. Higher IV generally means more expensive options, because bigger expected moves increase the value of the right to buy or sell at a fixed price.
Remember This: Volume is today's activity. Open interest is the standing crowd. A contract can show heavy volume for one session and still have almost no lasting market behind it, so we check both before entering.
How Do You Spot Liquid Options and Avoid Common Pitfalls?
A liquid option is one with high volume and high open interest relative to other strikes in the same chain, along with a tight bid-ask spread. These contracts are easier to enter and exit without losing money to the spread itself.
We generally look for contracts with open interest above roughly 500 to 1,000 and a bid-ask spread that's a small percentage of the option's price, not a fixed dollar amount, since cheaper options naturally have smaller spreads. A $0.10 spread on a $0.50 option is expensive relative to its price. That same $0.10 spread on a $10 option barely matters.
Here are the pitfalls we see beginners run into most often:
- Trading the wrong expiration by accident: double-check the date selector before placing any order
- Chasing far out-of-the-money options because they're cheap: low price often means low liquidity and low odds of profit
- Ignoring open interest entirely: a contract with high volume today but near-zero open interest may have no real standing market
- Confusing bid/ask with "fair value": the midpoint between bid and ask is a more realistic estimate of what you'd actually pay
- Not checking IV relative to the stock's normal range: buying options when IV is unusually high means you're paying a premium for volatility that may not show up
Watch Out: A wide bid-ask spread can cost you real money before the stock ever moves. If you buy at the ask and the only exit is the bid, you start the trade down by the full spread. Always measure the spread as a percentage of the option's price.
Options Chain Example Walkthrough
Let's work through a simplified option chain example. Say a stock trades at $100, and you pull up the chain for an expiration 30 days out. You scan down to the $100 strike row.
| Data Point | $100 Call | $100 Put |
|---|---|---|
| Bid | $3.20 | $2.90 |
| Ask | $3.30 | $3.00 |
| Bid-Ask Spread | $0.10 (about 3% of price) | $0.10 (about 3% of price) |
| Volume | 2,800 | 2,400 |
| Open Interest | 12,500 | 11,800 |
That tight spread and high open interest on both sides tells you the $100 strike is one of the most liquid points on the entire chain, which makes sense since it's closest to the current stock price.
Now compare that to a strike further out of the money:
| Data Point | $110 Call |
|---|---|
| Bid | $0.45 |
| Ask | $0.65 |
| Bid-Ask Spread | $0.20 (roughly 36% of the midpoint price) |
| Volume | 180 |
| Open Interest | 600 |
The spread here, measured as a percentage of price, is much wider, and the activity is thinner. This contract is still tradable, but you'd want to be far more careful about the price you accept when entering or exiting.
That side-by-side comparison is the same one we run mentally every single time we open a live chain. It takes about ten seconds and it saves a surprising amount of money.
Why Do So Many Options Traders Lose Money?
Most options traders who lose money do so because they misjudge time decay, trade illiquid contracts with wide spreads, size positions too large relative to their account, or buy options without a clear plan for exit. These mistakes compound quickly in a market where both price direction and timing have to be right.
Options differ from stocks because they expire. A stock you're wrong about can sit in your account for years waiting to recover. An option you're wrong about can expire worthless in weeks, with no second chances. Combine that with wide bid-ask spreads on illiquid contracts, and the math works against undisciplined traders fast.
This is also why reading the chain correctly matters so much. Traders who understand option chain quotes, who check open interest before entering, and who size positions conservatively are already avoiding several of the most common ways beginners lose money.
How Should You Apply This When Trading?
Use the options chain every single time before placing a trade, not just to find a price but to confirm liquidity, check the spread, and compare nearby strikes. Skipping this step is one of the fastest ways to get a bad fill or end up stuck in a contract you can't exit cleanly.
Here's the simple pre-trade checklist we teach:
- Confirm the expiration date. Make sure the chain you're reading matches the date you intend to trade.
- Check open interest. Look for a reasonably high number at your chosen strike, generally above 500 to 1,000.
- Measure the bid-ask spread. Judge it as a percentage of the option's price, not in raw dollars.
- Review implied volatility. Compare current IV to where it's been recently for that stock.
- Decide your exit plan first. Know your profit target and your stop before you enter, not after.
As for position sizing, we generally recommend new options traders risk a small, defined percentage of their account on any single trade, often 1% to 3%, and never allocate so much to one expiration date that a single bad move causes outsized damage.
Risk Warning: Options can move fast in both directions, and the chain itself won't protect you from poor risk management. It only gives you better information to manage that risk with. Position size is still your primary defense.
Frequently Asked Questions
What is an option chain?
An option chain is a table listing all available call and put contracts for a stock, organized by strike price and expiration date, along with pricing and activity data like bid, ask, volume, and open interest.
How do you analyze an option chain?
You analyze an option chain by selecting an expiration date, comparing strikes near the current stock price, and checking volume, open interest, and bid-ask spread to judge liquidity before comparing calls to puts at the same strike.
Where should beginners start?
Start by picking a familiar, heavily traded stock, open its chain, and practice identifying the strike price, expiration date, and whether each strike is in-the-money or out-of-the-money before looking at pricing data.
Is reading an options chain different on Fidelity versus Schwab?
The core structure is the same (calls on the left, puts on the right, strikes in the middle), though the exact location of the expiration selector and column order can differ slightly between the two platforms.
What is the 3-5-7 rule in options trading?
The 3-5-7 rule is a risk management guideline some traders use, generally suggesting no more than 3% of capital on a single trade, 5% across related positions, and 7% total options exposure, though specific percentages vary by trader and account size.
What does ITM and OTM coloring mean on an options chain?
In-the-money (ITM) options are typically shaded on most platforms to show they already hold intrinsic value, while out-of-the-money (OTM) options appear unshaded, giving you a quick visual cue without calculating value manually.
Is there a printable reference for options chain terminology?
Many brokers and education providers offer downloadable guides summarizing chain layout and terminology. The Cboe education resources are a solid free starting point, and a one-page cheat sheet works well while you're practicing on a live platform.
Want expert trading insights delivered daily?
Join thousands of traders who rely on Traders Agency for market analysis and trade ideas.
Join Traders AgencyDISCLAIMER: Traders Agency does not offer financial advice. The information provided is for educational purposes only and should not be considered financial advice. Traders Agency is not responsible for any financial losses or consequences resulting from the use of the information provided. Trading carries inherent risks and may not be suitable for all individuals. You are advised to conduct your own research and seek personalized advice before making any investment decisions, recognizing the potential risks and rewards involved.
See more from Traders Agency on Google
Make us a preferred source and our market analysis will appear more prominently in your Google Search, Top Stories, and AI results.
Add to Preferred Sources