
Earnings per share is the portion of a company's profit assigned to each share of its stock. It's one of the first numbers traders see on any earnings report, and it's the building block behind the P/E ratio and nearly every stock valuation conversation you'll run into. By the end of this guide, you'll know how to calculate it, where to find it, and how to tell a genuinely strong EPS from one that's been artificially inflated.
You've probably seen this play out: a company "beats earnings," the stock pops 5% in the premarket, and you're left wondering what number everyone is actually reacting to. Most of the time, that number is EPS. It looks simple on the surface, but once you understand the mechanics behind it, you'll read earnings reports completely differently.
We get asked about this constantly by newer members, so our education team built this guide: earnings per share explained step by step, with real numbers.
What Is EPS?
Bottom Line: EPS tells you how much profit a company earns per share, but the raw number can mislead if it's driven by buybacks or one-time items rather than real business growth. Knowing how to find diluted EPS, compare it against analyst estimates, and check whether gains come from actual earnings or share count tricks lets you read an earnings report the way professional traders do.
EPS (earnings per share) is a company's net income divided by its number of outstanding shares. It tells you how much profit is attributable to a single share of stock, and it's the foundation for how traders and analysts judge whether a company is growing profitably.
Think of it like splitting a pizza. If a company earns $10 million in profit and has 10 million shares outstanding, each share gets a "slice" worth $1.00 in earnings. That $1.00 is the EPS.
EPS doesn't tell you the stock price. It tells you how profitable the company is on a per-share basis, which is a completely different thing. A $5 stock and a $500 stock can both have an EPS of $1.00, and that comparison alone tells you almost nothing about which is the better investment.
Key Concept: EPS measures profitability per share, not value per share. Two companies with identical EPS can trade at wildly different prices, which is exactly why the P/E ratio exists.
How Do You Calculate EPS?
The earnings per share formula is: EPS = (Net Income − Preferred Dividends) ÷ Weighted Average Shares Outstanding.
Here's what each piece means:
- Net Income: The company's total profit after all expenses, taxes, and interest are paid. You'll find this on the income statement.
- Preferred Dividends: Subtracted because preferred shareholders get paid before common shareholders. If a company has no preferred stock, skip this step entirely.
- Weighted Average Shares Outstanding: The average number of shares that existed during the reporting period, since share counts can change mid-quarter due to buybacks or new issuances.
Earnings Per Share Example
Say a company reports $50 million in net income for the quarter, pays $2 million in preferred dividends, and has 48 million weighted average shares outstanding.
| Input | Value |
|---|---|
| Net Income | $50,000,000 |
| Preferred Dividends | $2,000,000 |
| Earnings Available to Common Shares | $48,000,000 |
| Weighted Average Shares Outstanding | 48,000,000 |
| Reported EPS | $1.00 per share |
That final number is what gets printed in headlines and compared against what analysts expected.
Where Do You Find EPS in Financial Statements?
This is where a lot of beginners get tripped up: net income comes from the income statement, not the balance sheet. The balance sheet is where you find shares outstanding, listed under stockholders' equity.
Where to Actually Find This Data
You don't need to rebuild the EPS formula from scratch every time. Here's where it already lives:
- 10-Q filings: Quarterly reports filed with the SEC, containing unaudited financials and EPS figures. You can pull them directly from the SEC's EDGAR database.
- 10-K filings: Annual reports with audited financials, more detail, and full-year EPS.
- Stock screeners: Most brokerage platforms and financial data sites display EPS directly on a stock's summary page.
- Earnings press releases: Companies typically headline both EPS and revenue the moment earnings drop.
Our team recommends pulling the actual 10-Q or 10-K at least once if you're serious about a position. Press releases sometimes highlight "adjusted" EPS figures that exclude certain costs, and those numbers can look a lot rosier than the official GAAP (Generally Accepted Accounting Principles) figure sitting a few pages deeper in the filing.
What's the Difference Between Basic and Diluted EPS?
Basic EPS uses only the weighted average shares actually outstanding during the period. Diluted EPS accounts for shares that could be created through stock options, convertible bonds, or warrants, giving you a more conservative picture of earnings per share.
This distinction matters because diluted EPS is almost always equal to or lower than basic EPS. If a company carries a pile of outstanding stock options or convertible debt, exercising those could flood the market with new shares, spreading the same profit thinner across a bigger pool.
We always tell our members the same thing: when comparing companies, compare diluted earnings per share, not basic. It's the more honest number, especially for tech and growth companies that compensate employees heavily with stock options.
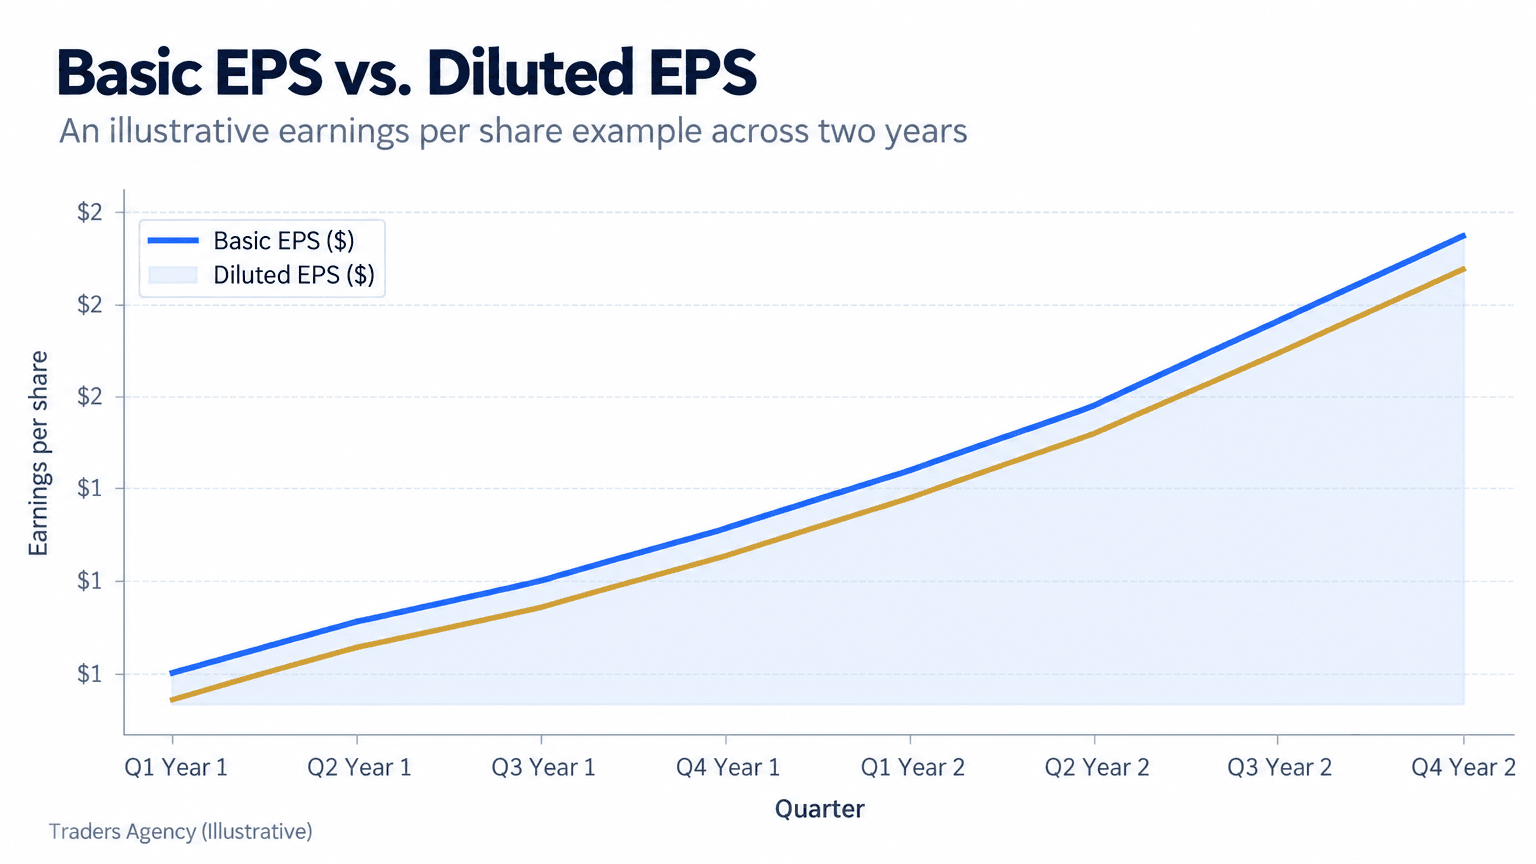
Notice how the gap between basic and diluted EPS stays fairly consistent over time. That gap is roughly the "dilution tax" from stock-based compensation and convertible securities.
Want expert trading insights delivered daily?
Join thousands of traders who rely on Traders Agency for market analysis and trade ideas.
Join Traders AgencyWhat Factors Can Affect EPS?
EPS can rise or fall for reasons that have nothing to do with how the business is actually performing. Two of the biggest culprits are stock buybacks and share issuance.
How Buybacks Inflate EPS
When a company buys back its own stock, it reduces the number of shares outstanding. If net income stays flat but the share count shrinks, EPS goes up even though the company didn't earn a single extra dollar.
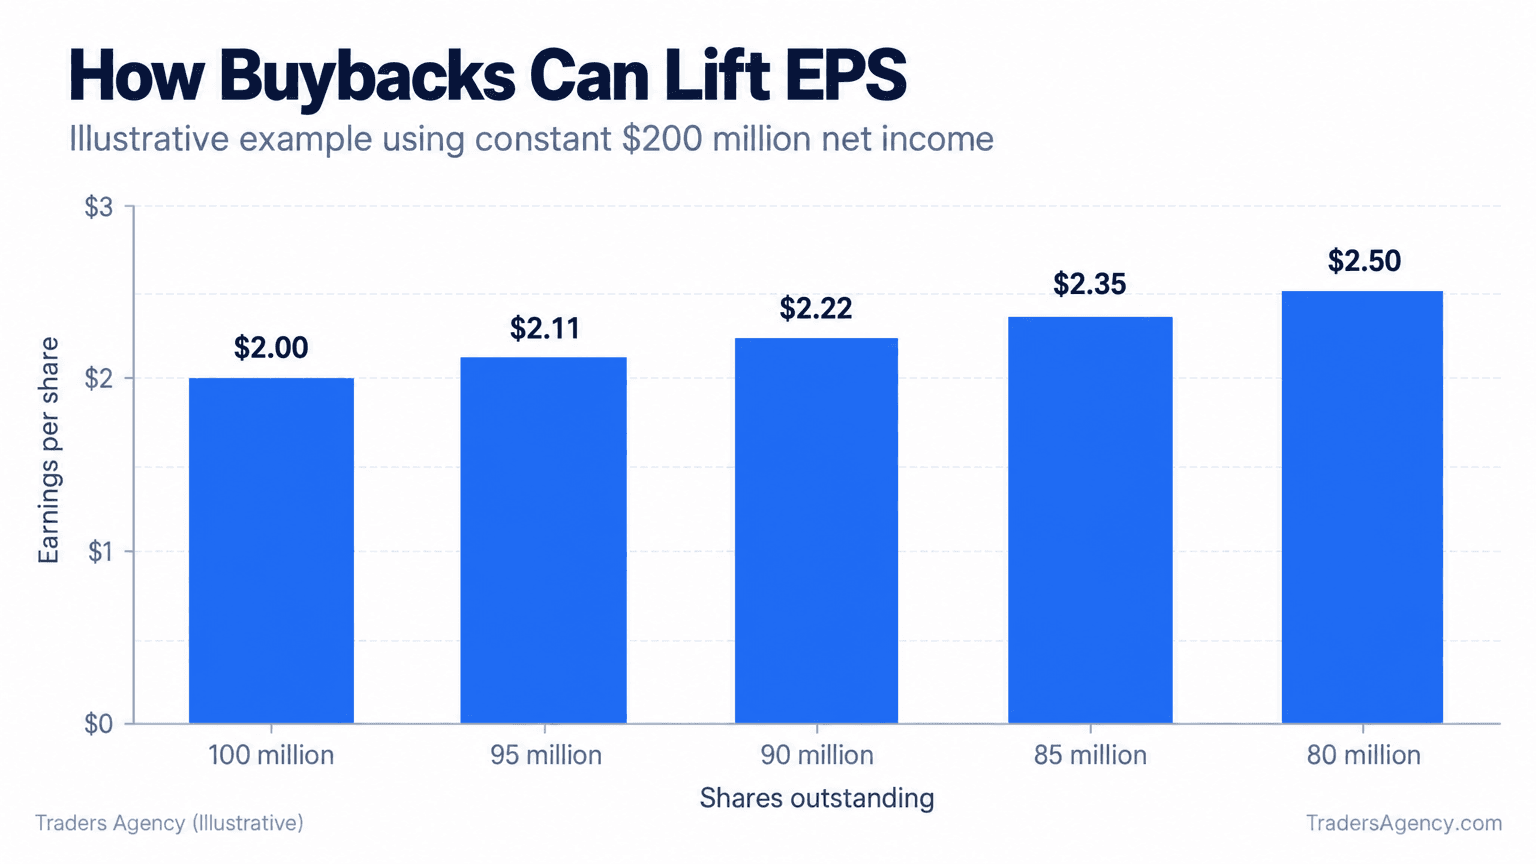
In that illustration, net income never changed. The company simply bought back 20 million shares, and EPS jumped from $2.00 to $2.50 purely from the math.
Watch Out: Always check whether EPS growth is coming from real profit growth or from a shrinking share count. A buyback-driven "beat" tells you nothing about the health of the underlying business.
The Analyst "Beat the Estimate" Game
Before every earnings release, Wall Street analysts publish an EPS estimate based on their own models. When a company reports EPS above that number, it's called a "beat." Below it, a "miss."
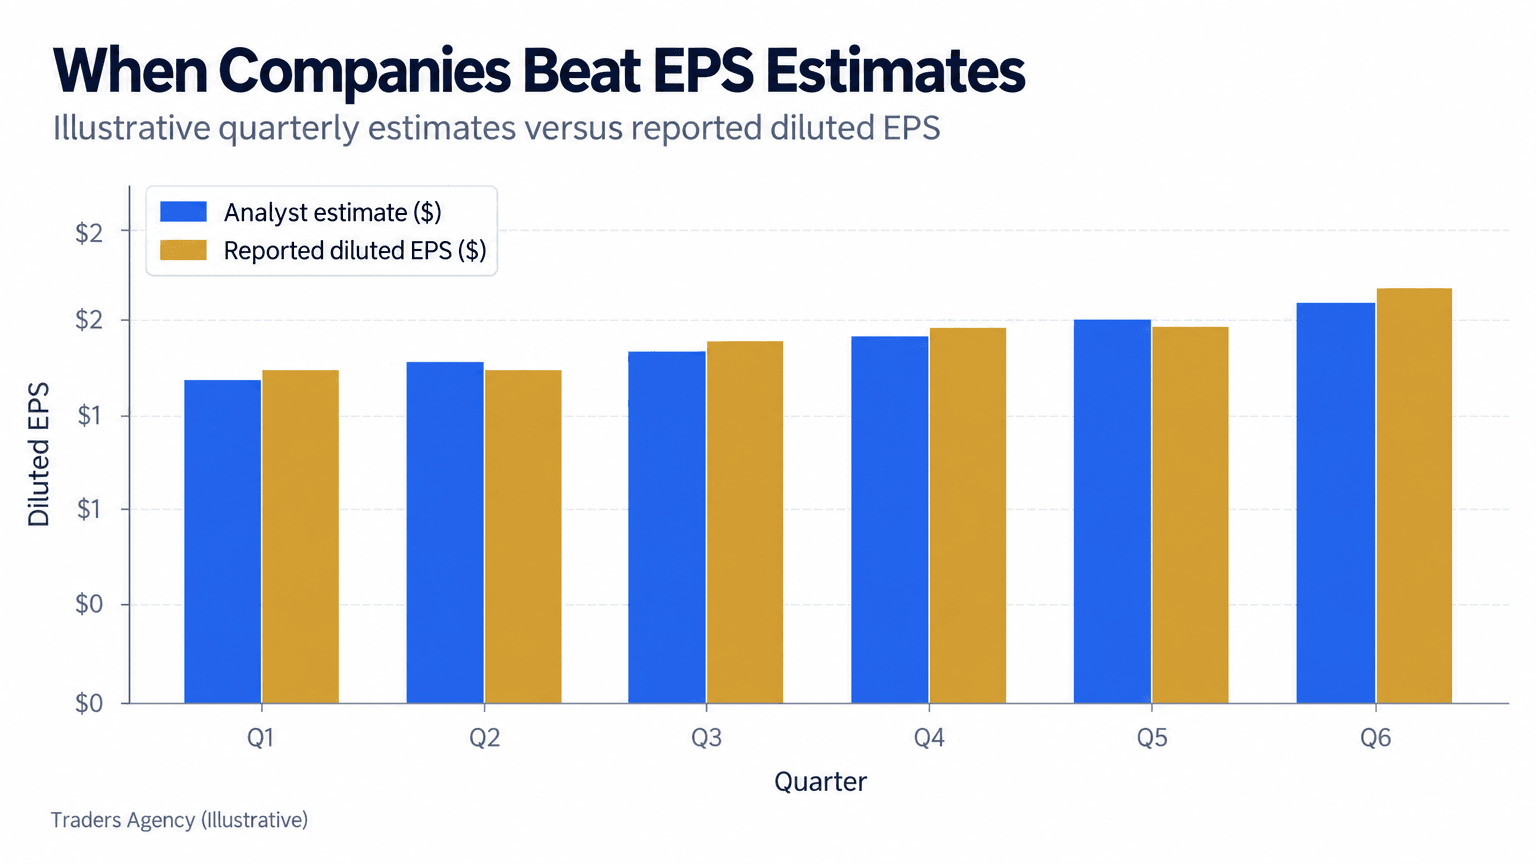
Companies know this game well. Management often issues conservative guidance ahead of time specifically so the actual report comes in "better than expected." A small beat can trigger a rally even when year-over-year growth is weak, while a small miss can tank a stock that's still fundamentally healthy.
What Is a Good EPS on a Stock?
There's no single number that qualifies as a "good" EPS, because it depends entirely on the industry, the share price, and the company's growth stage. A high-growth tech company and a mature utility should be judged on completely different EPS scales.
What matters more than the raw number is the trend: is EPS growing quarter over quarter and year over year, and is that growth coming from real revenue rather than buybacks?
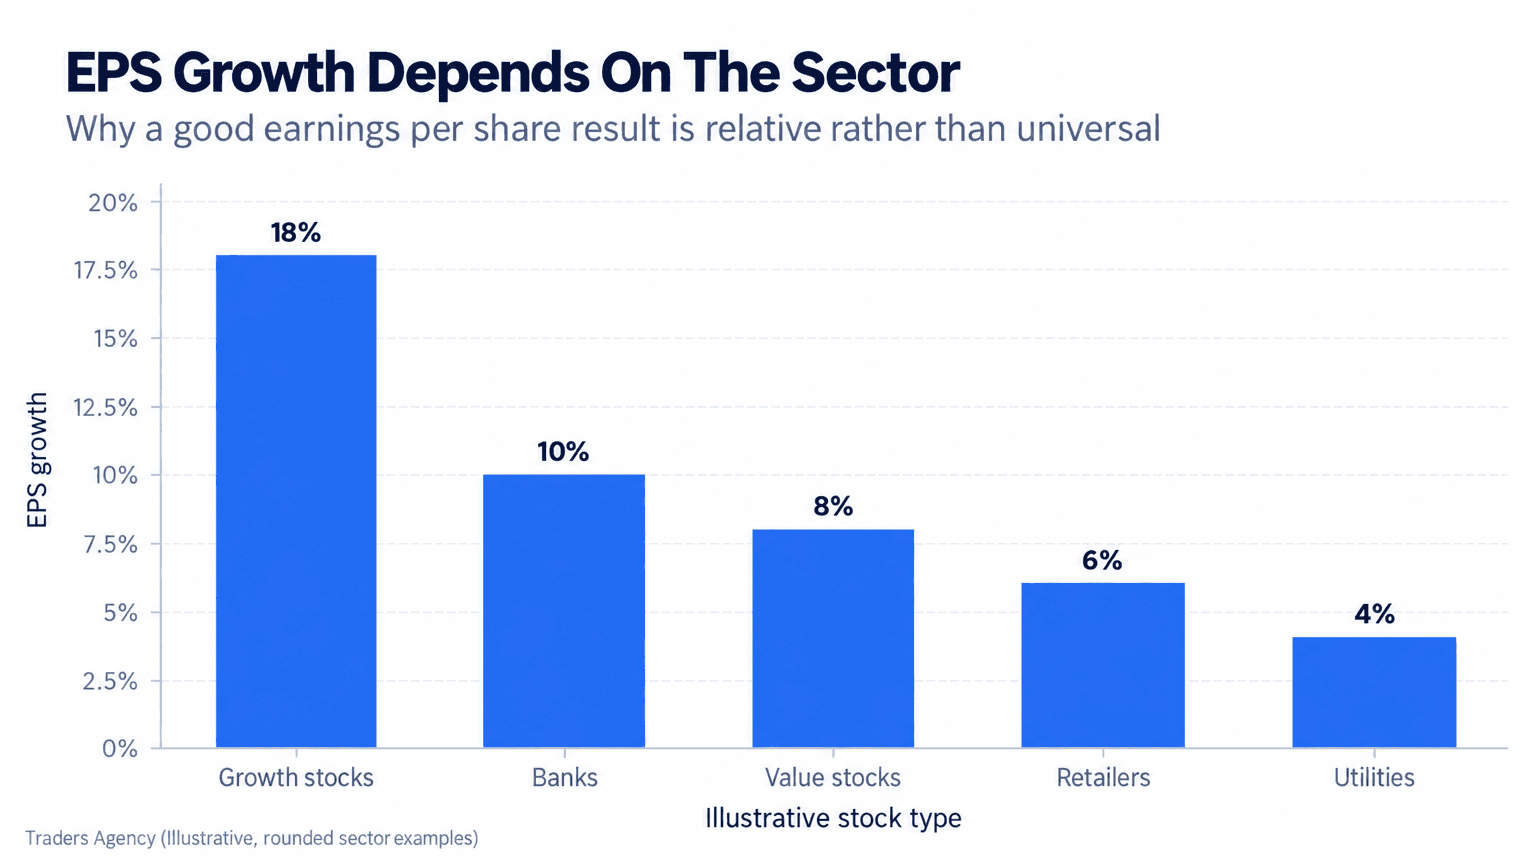
Growth stocks typically carry higher expected EPS growth rates since investors are paying up for future earnings. Banks and value stocks tend to show steadier, lower EPS growth, reflecting more mature and more predictable business models.
What Do Earnings Per Share Tell You?
EPS tells you how much profit a company generates per share, which lets you compare profitability across time periods and, when adjusted properly, across similar companies.
On its own, EPS is a building block rather than a complete verdict. It becomes genuinely useful once you combine it with share price to form the ratio most traders actually care about: the P/E ratio, or price-to-earnings ratio.
What Is a Good P/E Ratio?
The P/E ratio is the stock price divided by EPS, and it shows how much investors are paying for each dollar of earnings. A "good" P/E is relative, generally lower for value stocks and higher for growth stocks, so compare it against industry peers rather than treating it as an absolute benchmark.
Is EPS the Same as a Dividend?
No. EPS is the profit allocated to each share on paper, while a dividend is the actual cash payment a company chooses to distribute to shareholders out of that profit. A company can post strong EPS and pay no dividend at all if it would rather reinvest earnings back into the business.
EPS in Human Terms
If this still feels abstract, picture EPS as a report card grade for each individual share you own. The grade can improve either because the business genuinely got better, or because the class got smaller (fewer shares) while nothing else changed.
Your job as a trader is to figure out which one is actually happening. That's the whole game.
How Do You Use EPS in Real Trading Decisions?
When EPS Matters Most
- Comparing a company's own performance across quarters (quarter-over-quarter and year-over-year growth)
- Calculating the P/E ratio for valuation comparisons
- Sanity-checking whether an earnings "beat" reflects real growth or financial engineering
When to Be Cautious
- Don't compare raw EPS across companies with wildly different share prices or share counts
- Don't treat "adjusted EPS" in a press release as equivalent to GAAP EPS without checking the filing
- Don't assume a beat automatically means the stock is a buy. Check whether guidance was lowered beforehand
Risk Management Note
EPS is a fundamental metric, not a timing tool. We never recommend sizing a position based on EPS alone.
Watch Out: Pair EPS analysis with your existing technical approach, and use normal position sizing and stop-loss discipline around earnings dates. Volatility tends to spike regardless of which direction the beat or miss goes.
Frequently Asked Questions
What is a good EPS on a stock?
There's no universal number. A good EPS is one that's consistently growing relative to the company's own history and its industry peers.
What do earnings per share tell you?
EPS tells you how much net income is allocated to each outstanding share, giving you a standardized way to track a company's profitability over time.
What is a good P/E ratio?
A good P/E ratio varies by sector and growth rate, and it's best judged by comparing a company against similar companies rather than against a fixed benchmark.
Is EPS the same as a dividend?
No. EPS is accounting profit per share, while a dividend is the actual cash distributed to shareholders. The two can differ significantly.
How do you calculate EPS from a balance sheet?
Net income comes from the income statement, while shares outstanding comes from the balance sheet. Divide net income (minus preferred dividends) by weighted average shares outstanding.
What's the difference between basic and diluted EPS?
Basic EPS uses the weighted average shares outstanding during the period, while diluted EPS factors in shares that could be created from options, warrants, or convertible securities.
Can buybacks make EPS misleading?
Yes. Buybacks shrink the share count, which can push EPS higher even when net income hasn't grown at all.
Why do stocks move on an EPS beat or miss?
Analyst estimates set the market's expectations. Reported EPS above or below that number often triggers an immediate price reaction regardless of the longer-term trend.
Want expert trading insights delivered daily?
Join thousands of traders who rely on Traders Agency for market analysis and trade ideas.
Join Traders AgencyDISCLAIMER: Traders Agency does not offer financial advice. The information provided is for educational purposes only and should not be considered financial advice. Traders Agency is not responsible for any financial losses or consequences resulting from the use of the information provided. Trading carries inherent risks and may not be suitable for all individuals. You are advised to conduct your own research and seek personalized advice before making any investment decisions, recognizing the potential risks and rewards involved.
See more from Traders Agency on Google
Make us a preferred source and our market analysis will appear more prominently in your Google Search, Top Stories, and AI results.
Add to Preferred Sources